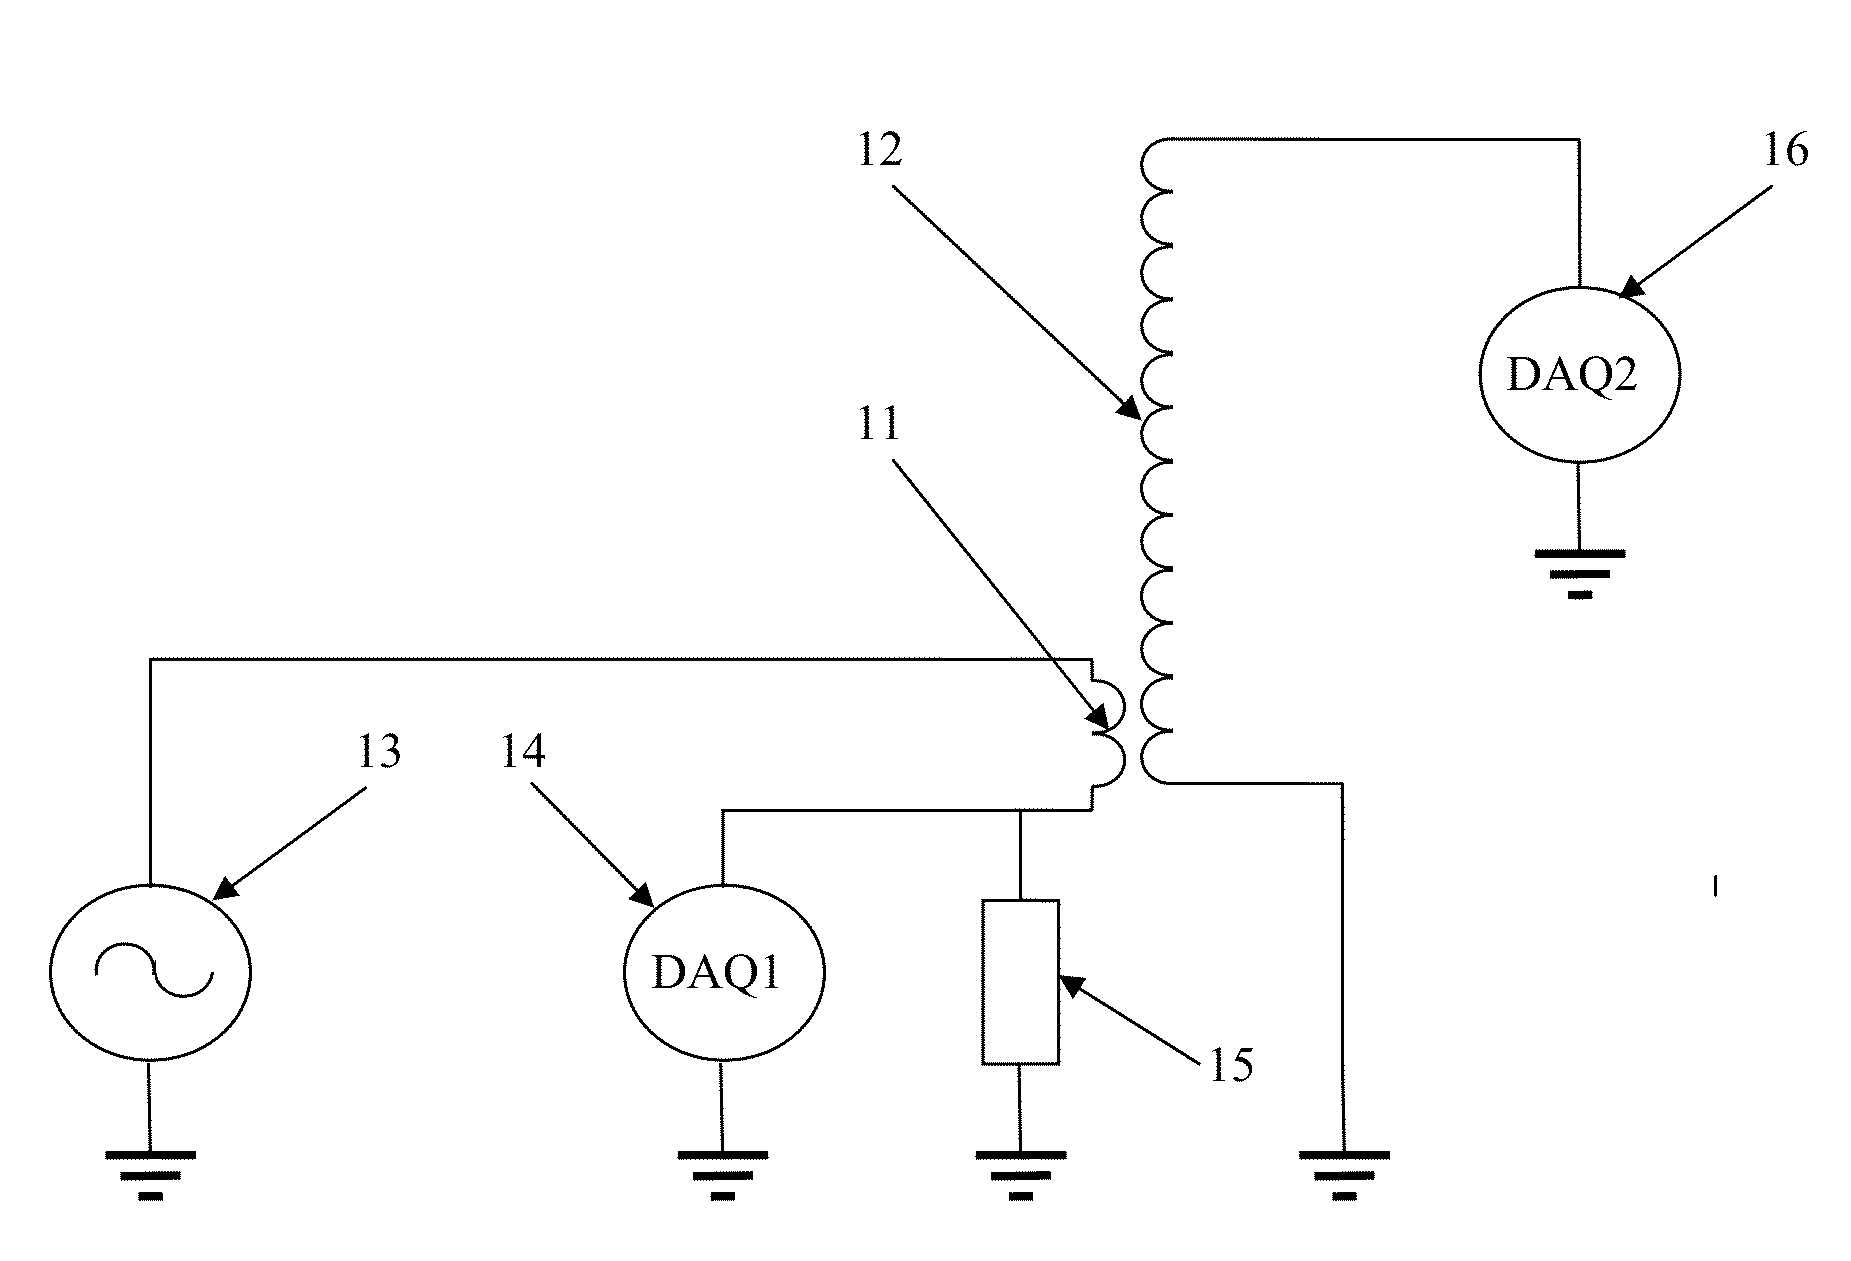
Impedance resonance sensor for real time monitoring of different processes and methods of using same
a technology of impedance resonance and process, applied in the direction of impedence measurement, material impedance, instruments, etc., can solve the problems of device lack of desired sensitivity, prior devices deficient for a plurality,
- Summary
- Abstract
- Description
- Claims
- Application Information
AI Technical Summary
Benefits of technology
Problems solved by technology
Method used
Image
Examples
example 1
2.1 Example 1
Use of an IR Sensor to Evaluate Properties of Motor Oil
[0056]Description of experiment:
[0057]1. Three samples of motor oil were obtained from auto repair shop:[0058]fresh new oil;[0059]motor oil after 3678 miles of usage; and[0060]motor oil after 7801 miles of usage.
[0061]2. The samples were placed in three vials of 15 cc volume.
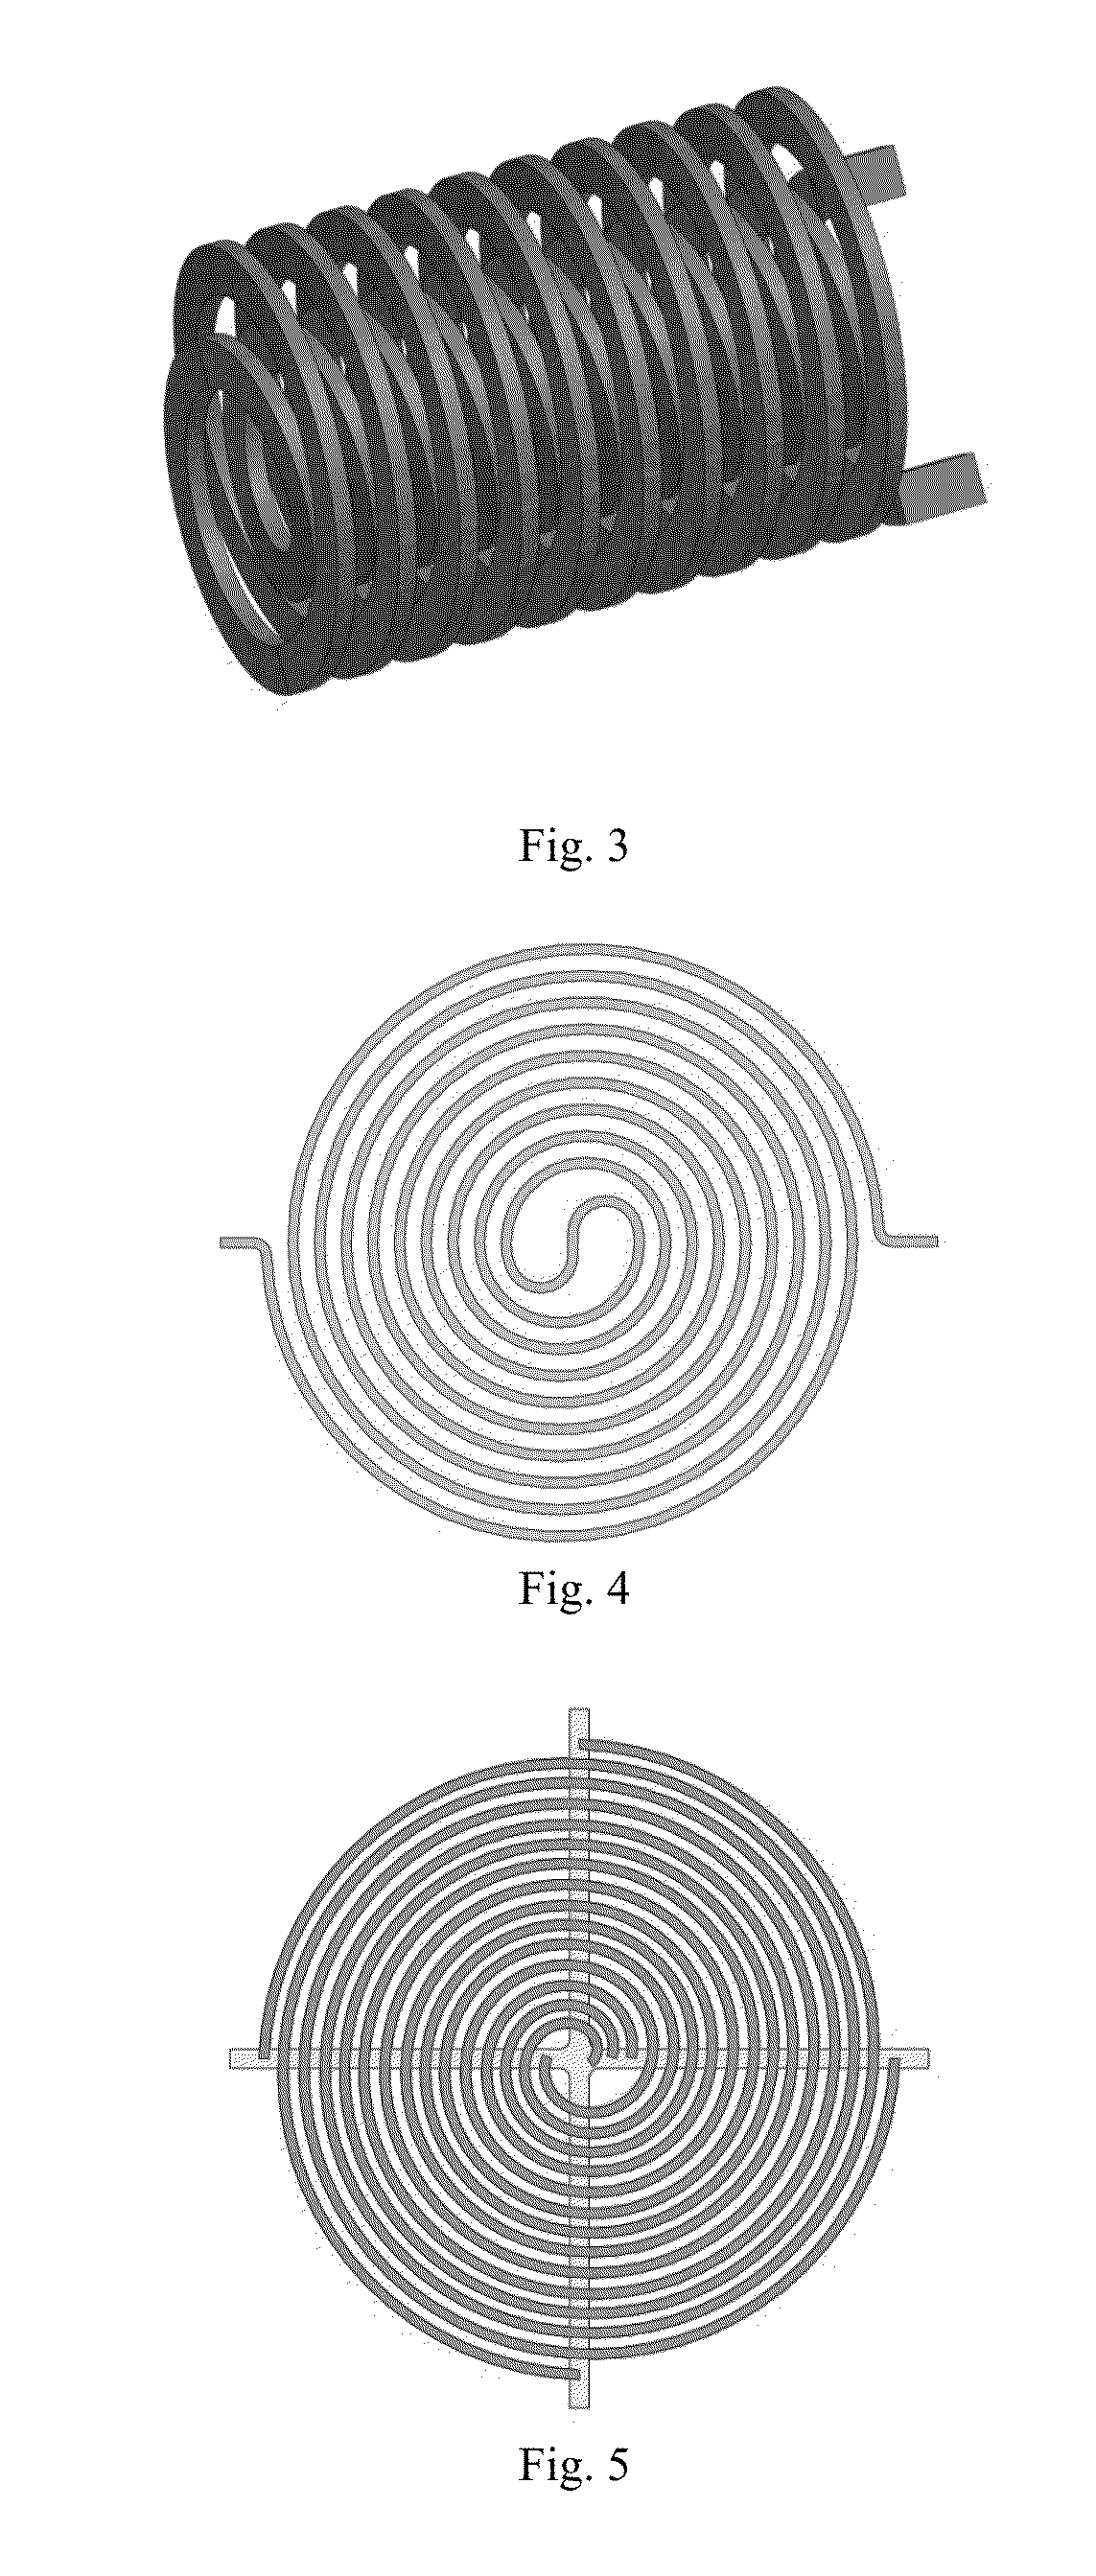
[0062]3. An IR sensor having a sensing coil of the type shown in FIG. 3 has been immersed in each of the vials by turns.
[0063]Results of the measurement are shown in FIG. 7, FIG. 8, and FIG. 9.
example 2
2.2 Example 2
Use of at Least One System of IR Sensors for Real Time Monitoring of a Quality of Slurry During a CMP Process
[0064]At least one embodiment of the invention is directed to real time monitoring quality of slurry during a CMP process. It is critical to reduce wafer defects during the polishing process and lower cost of ownership in current and next generation CMP tools. To maintain CMP slurry health during usage, it is essential to monitor and control slurry's chemical (e.g., oxidizer and additive levels and their decay behavior), as well as abrasive properties, including particles size distribution (PSD), large particle counts (LPC), density, etc. The method allows in real time monitoring of the oxidizer concentration as well as the abrasive particle information in CMP slurry blends. This works on the principles of chemometrics, which is a two-phase process. In the first “calibration” phase, samples with known property values are measured by the system. A mathematical pro...
example 3
2.3 Example 3
IR Measuring of Somatic Cell Count, Lactose Concentration and Fat Content in Milk
[0066]Using a standard potentiostat we identified areas where an electrical field influences various milk components. FIG. 10 shows a “screen shot” or graph of five different milk samples scanned with a potentiostate in a frequency range from about 10-about 170 MHz. We can see on the screen shot / graph areas where graph plots for different milk samples split in amplitude. These are areas where phenomena of impedance spectroscopy take place. In those areas, influence of each individual constituent can be defined. These scans show a large number of possible frequencies that could be used for measurement of milk components.
[0067]In order to identify the best fitted frequencies, we used three milk samples with the minimum and maximum concentrations of target constituent: 1) skim milk (about 0% fat) and 3.2% pasteurized milk to identify the frequency of monitoring fat content; 2) pasteurized 3.2%...
PUM
| Property | Measurement | Unit |
|---|---|---|
| electrical input impedance | aaaaa | aaaaa |
| operating frequency | aaaaa | aaaaa |
| volume | aaaaa | aaaaa |
Abstract
Description
Claims
Application Information
 - R&D
- Intellectual Property
- Life Sciences
- Materials
- Tech Scout
- Unparalleled Data Quality
- Higher Quality Content
- 60% Fewer Hallucinations
Browse by: Latest US Patents, China's latest patents, Technical Efficacy Thesaurus, Application Domain, Technology Topic, Popular Technical Reports.
© 2025 PatSnap. All rights reserved.Legal|Privacy policy|Modern Slavery Act Transparency Statement|Sitemap|About US| Contact US: help@patsnap.com


