
Method and apparatus for analyzing a root cause of a service impact in a virtualized environment

a virtualized environment and root cause technology, applied in the field of data center management operations, can solve the problems that the failure of any component in the data center may or may not have an impact on service availability, capacity, performance, and may take several minutes for an operator to determine the actual outage-causing even

Inactive Publication Date: 2013-04-18
ZENOSS
View PDF1 Cites 53 Cited by
  • Summary
  • Abstract
  • Description
  • Claims
  • Application Information

AI Technical Summary

Benefits of technology

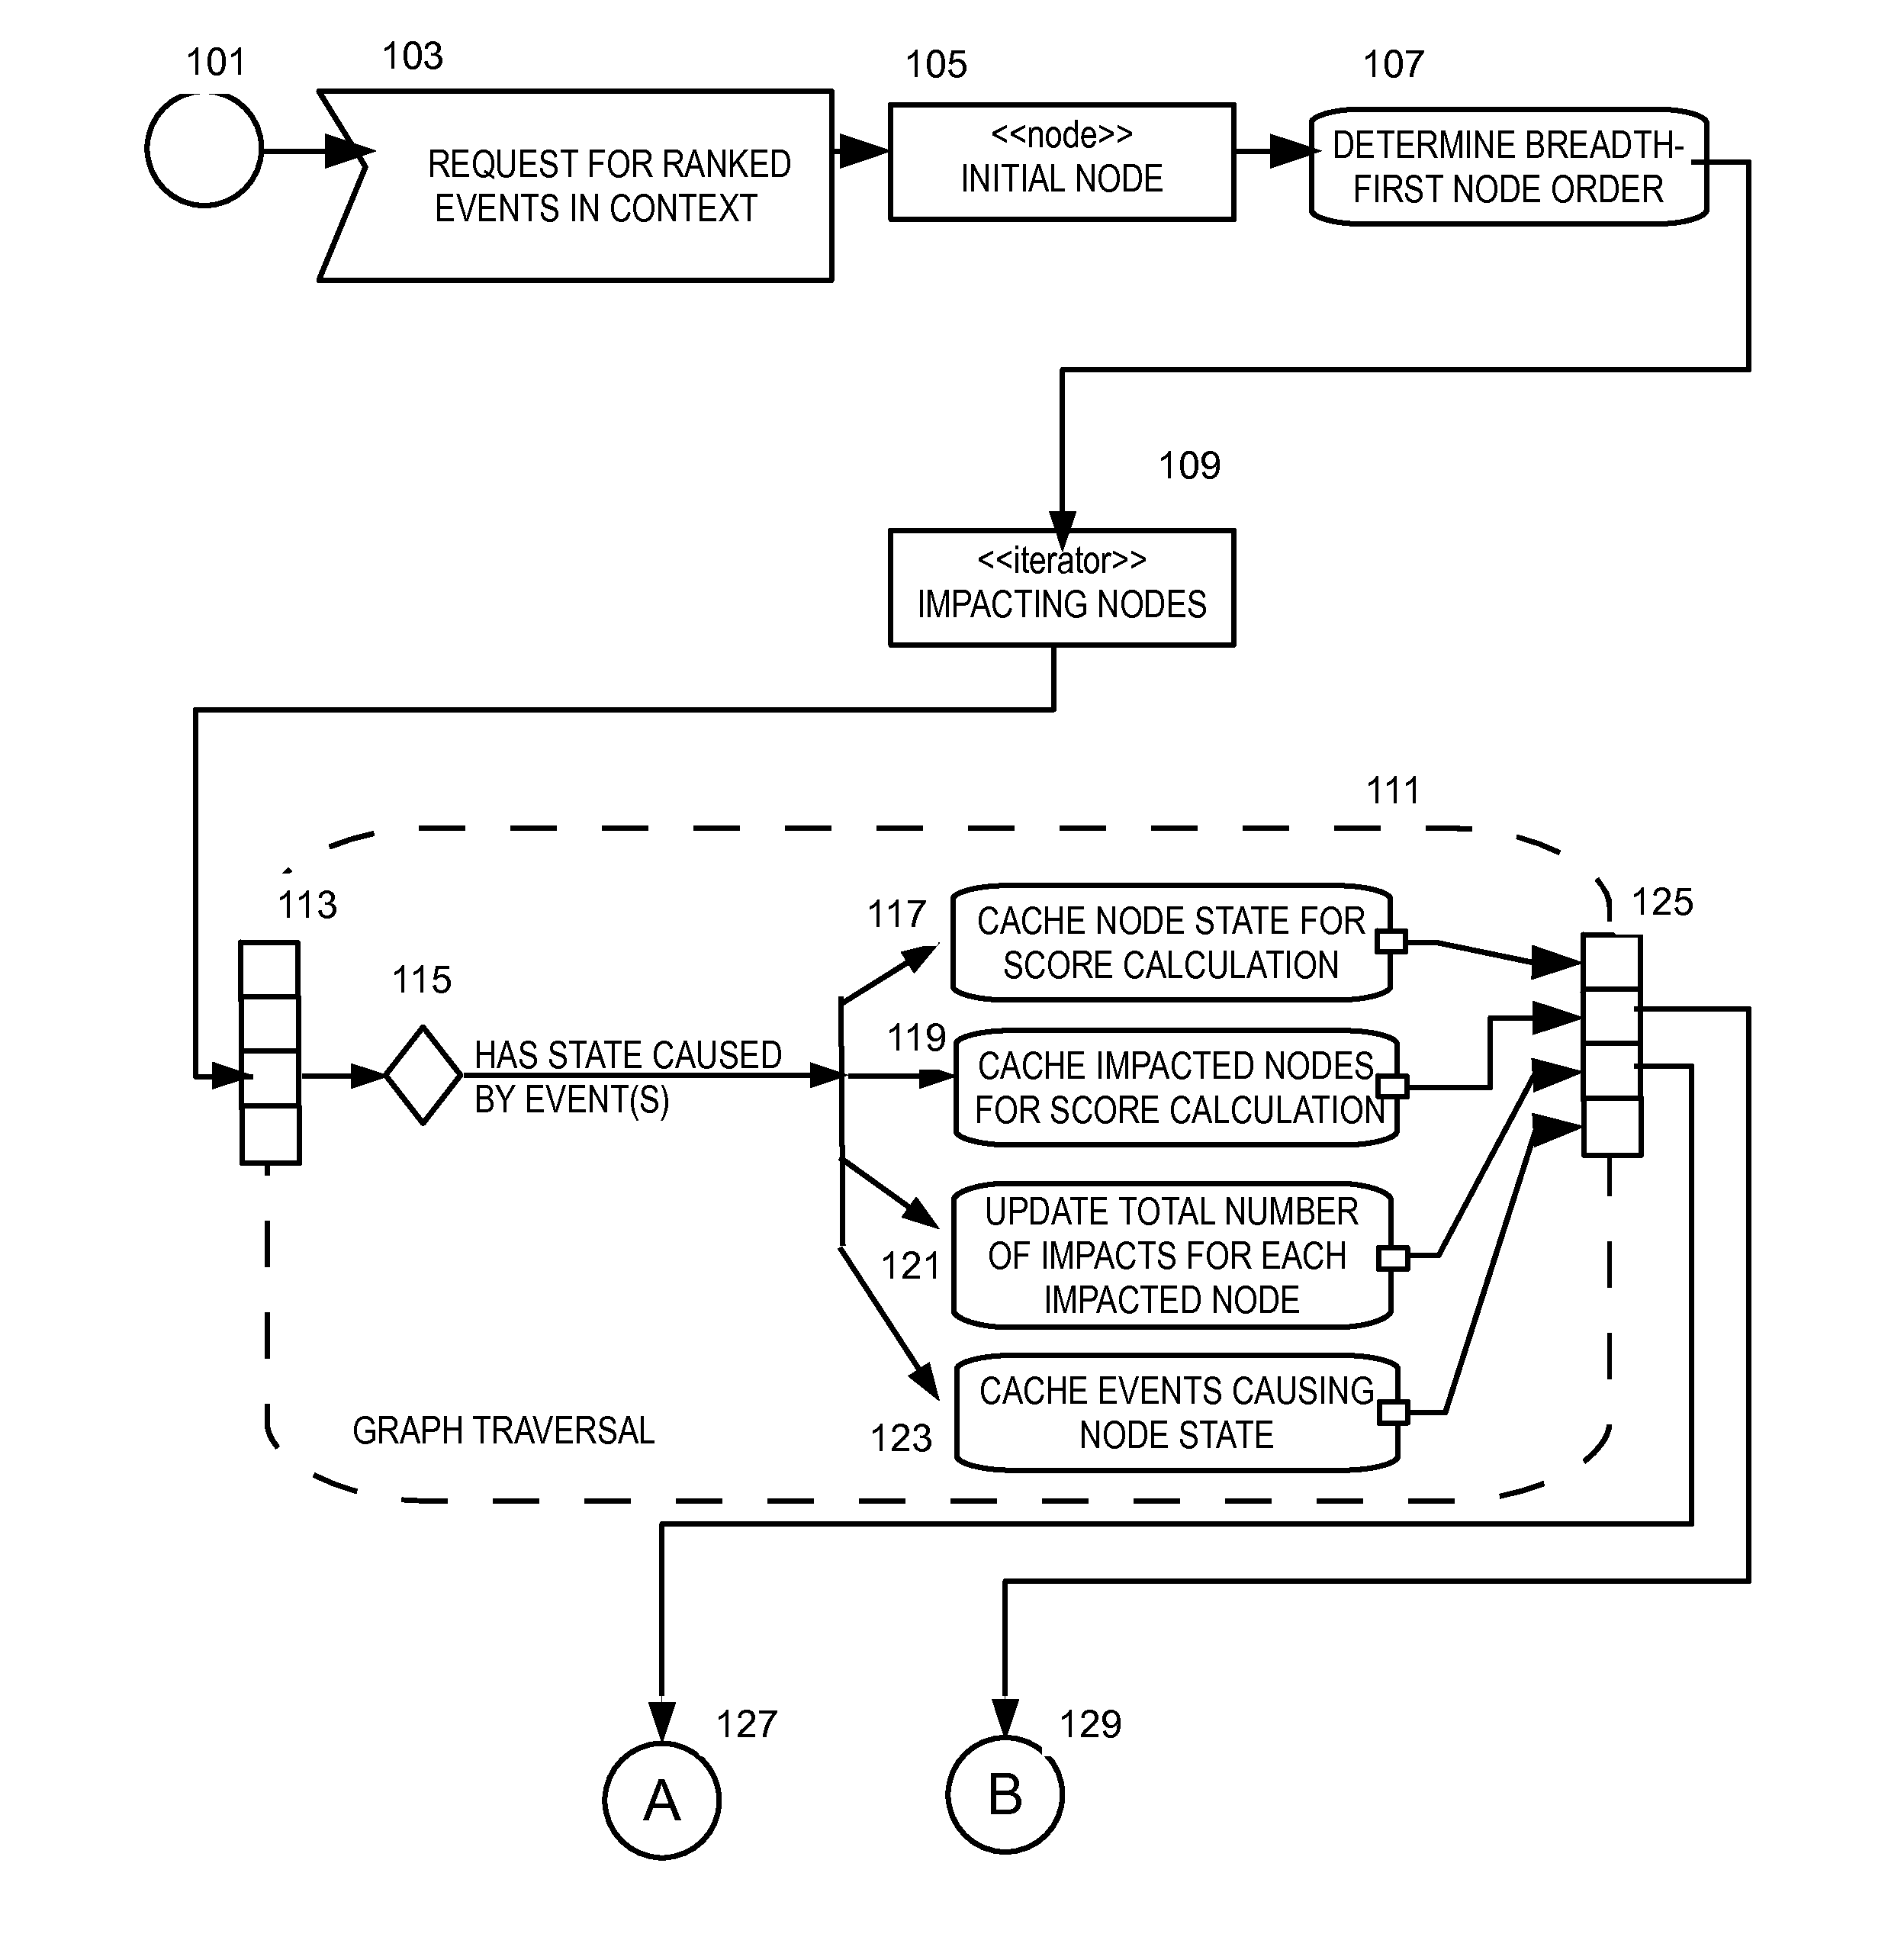
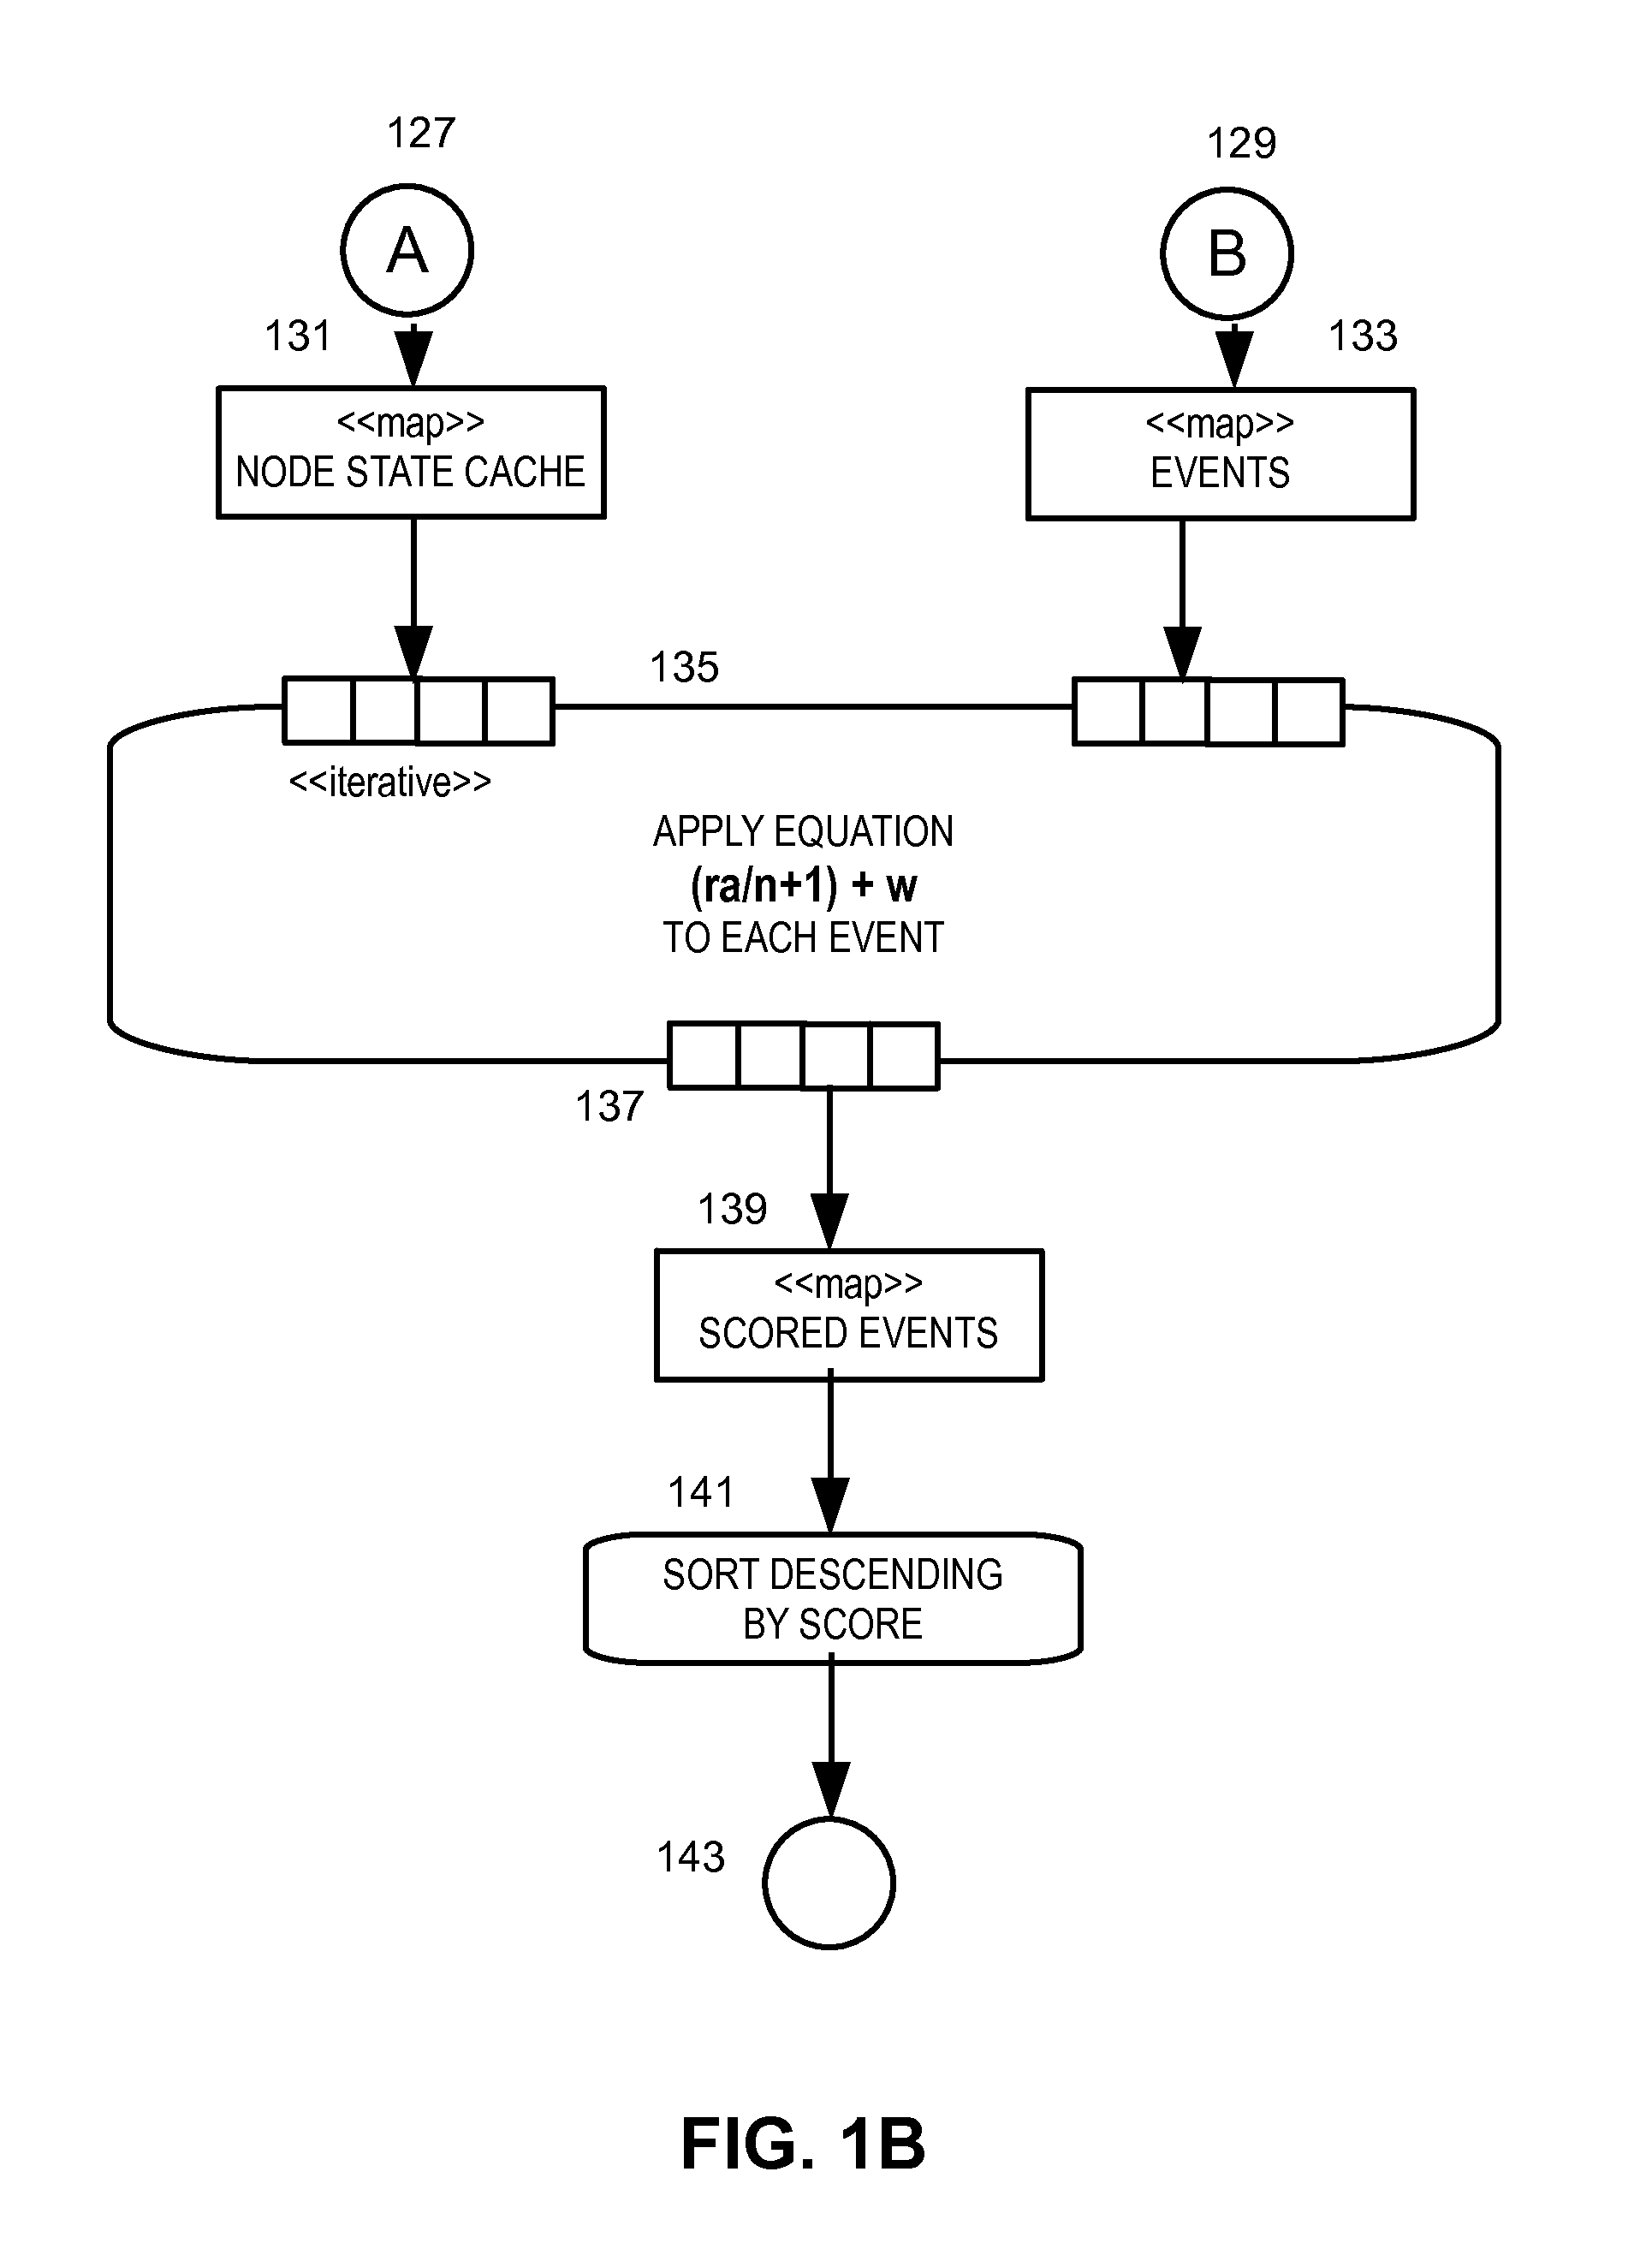
The present invention provides a computer system, method, and computer-readable medium that can determine the root cause of a service impact by analyzing a dependency graph that represents the relationships among infrastructure elements in a managed system and how they interact with each other in delivering a service. The system can rank each event that affects the state of an infrastructure element based on its impact on other infrastructure elements and provide a score for each event, indicating its importance in the service. The system can also use pre-defined policies to handle different types of events and can determine the state of an infrastructure element based on an absolute calculation specified in a policy assigned to it. Overall, the invention allows for quick identification of the root cause of a service impact and enables timely remediation of the issue.

Problems solved by technology

Failure of any component in the data center may or may not have an impact on service availability, capacity, or performance.
As a result traditional Impact Analysis and Service Assurance engines based on infrastructure “fingerprinting” break due to the fact that policies are not dynamically updated as service dependencies change.
In a dynamic virtualized datacenter, any number of problems may affect any given component in the datacenter infrastructure; these problems may in turn affect other components.
By a creating a dynamic dependency graph of these components and allowing a component's change in state to propagate through the graph, the number of events one must manually evaluate can reduced to those that actually affect a given node, by examining the events that have reached it during propagation; this does not, however, minimize the number of events to a single cause, because any event may be a problem in itself or may indicate merely a reliance on another component with a problem.
Although fewer events must be examined to solve a given service outage, it still might take an operator several minutes to determine the actual outage-causing event.
Typical root cause analysis methods are unable to react to changes in the dependency topology, and thus must be more detailed; since they require extensive a priori knowledge of both the nodes being monitored, the relationships between the nodes being monitored and the importance of the types of events that may be encountered, they are extremely prone to inaccuracy without constant and costly reevaluation.
Furthermore, they are inflexible in the face of event storms or the migration of virtual network components, due to their reliance on a static configuration.

Method used


Image

  • Method and apparatus for analyzing a root cause of a service impact in a virtualized environment
  • Method and apparatus for analyzing a root cause of a service impact in a virtualized environment
  • Method and apparatus for analyzing a root cause of a service impact in a virtualized environment

Examples


Embodiment Construction

[0031]In overview, the present disclosure concerns data centers, typically incorporating networks running an Internet Protocol suite, incorporating routers and switches that transport traffic between servers and to the outside world, and may include redundancy of the network. Some of the servers at the data center can be running services needed by users of the data center such as e-mail servers, proxy servers, DNS servers, and the like, and some data centers can include, for example, network security devices such as firewalls, VPN gateways, intrusion detection systems and other monitoring devices, and potential failsafe backup devices. Virtualized services and the supporting hardware and intermediate nodes in a data center can be represented in a dependency graph in which details and / or the location of hardware is abstracted from users. More particularly, various inventive concepts and principles are embodied in systems, devices, and methods therein for supporting a virtualized data...


PUM


Abstract

A dependency graph includes nodes representing states of infrastructure elements in a managed system, and impacts and events among the infrastructure elements in a managed system that are related to delivery of a service by the managed system. Events are received that cause change among the states in the dependency graph. An event occurs in relation to one of the infrastructure elements of the dependency graph. Each individual node that was affected by the event is analyzed and ranked based on (i) states of the nodes which impact the individual node, and (ii) the states of the nodes which are impacted by the individual node, to provide a score for event(s) which is associated with the individual node. Plural events are ranked based on the scores. The root cause of the events with respect to the service is provided based on the events which were ranked.

Description

CROSS-REFERENCE TO RELATED APPLICATIONS[0001]This application is a continuation-in-part and claims priority to U.S. Ser. No. 13 / 396,702 filed 15 Feb. 2012 which claims the benefit of provisional application 61 / 443,848 filed 17 Feb. 2011, and this application claims the benefit of provisional applications 61 / 547,153 filed 14 Oct. 2011, all of which are expressly incorporated herein by reference.TECHNICAL FIELD[0002]The technical field in general relates to data center management operations, and more specifically to analyzing events in a data center.BACKGROUND[0003]Complex data center environments contain a large number of infrastructure elements which interact to deliver services such as email, e-commerce, web, and a wide variety of enterprise applications. Failure of any component in the data center may or may not have an impact on service availability, capacity, or performance. Static mapping of infrastructure and application components to services is a well understood process, how...

Claims


Application Information

Patent Timeline
Patent Type & Authority Applications(United States)
IPC IPC(8): G06F17/30
CPCG06F11/079G06F11/0709
Inventor MCCRACKEN, IAN C.
Owner ZENOSS
Learn More