
Method for positioning a well relative to seismic image of the subsoil

a well and seismic image technology, applied in the field of subsoil exploration techniques, can solve the problems of reducing affecting so as to reduce the extent of the seismic interpretation, increase the confidence, and improve the accuracy of the method

Inactive Publication Date: 2012-09-06
TOTAL PUTEAUX FR
View PDF7 Cites 2 Cited by
  • Summary
  • Abstract
  • Description
  • Claims
  • Application Information

AI Technical Summary

Benefits of technology

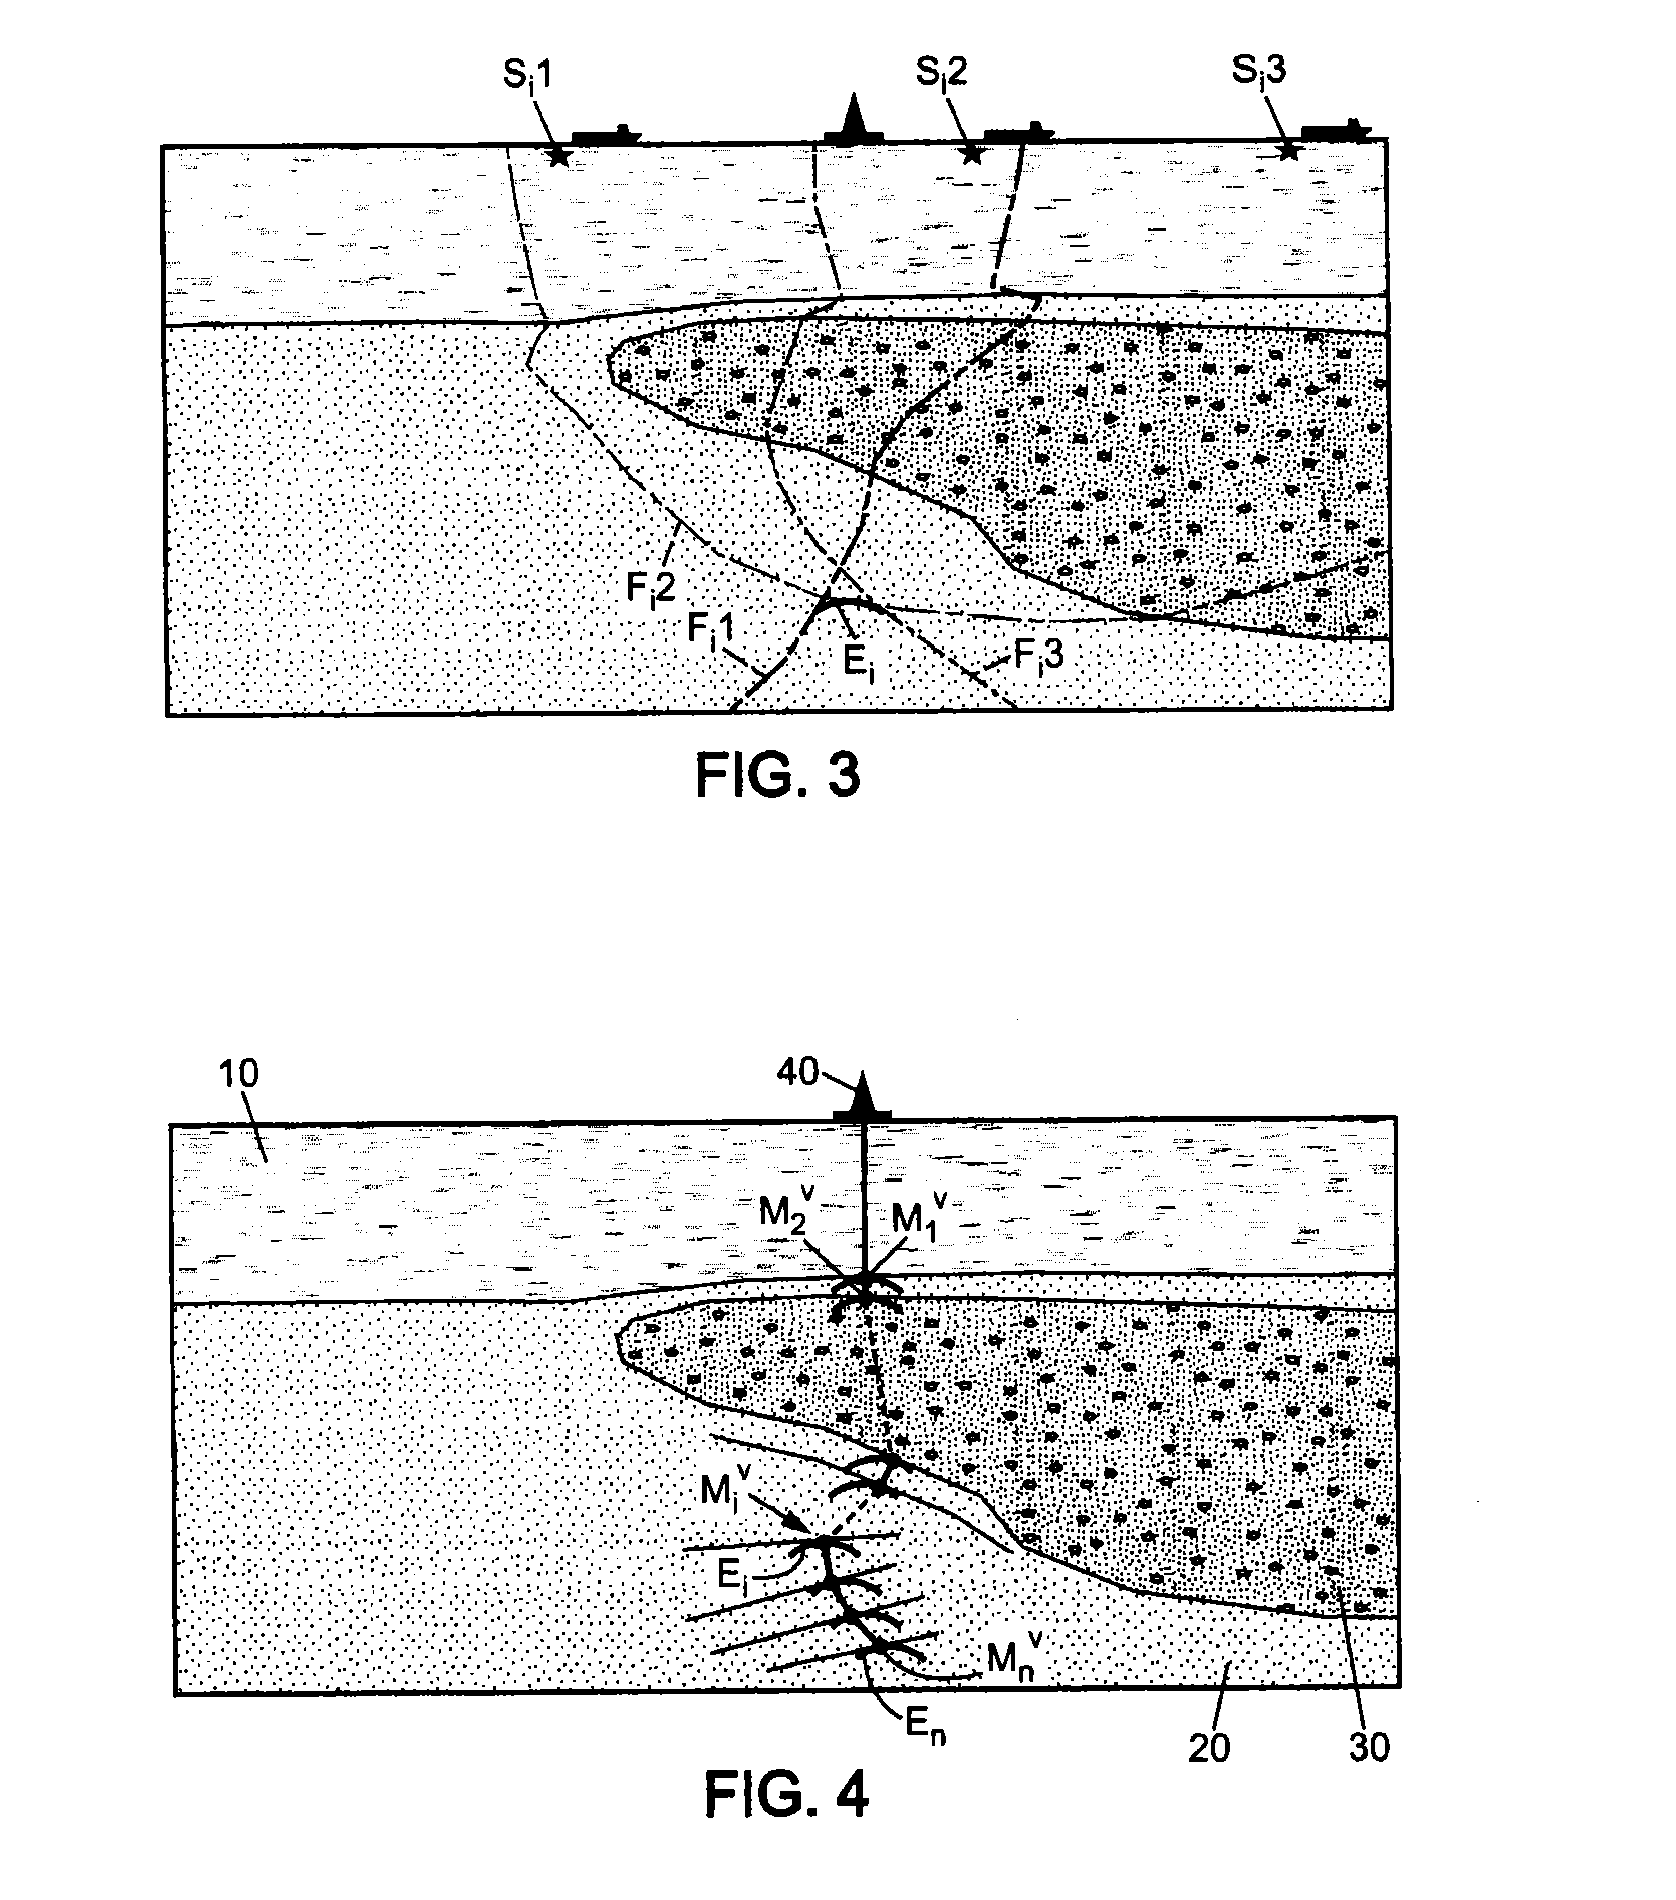
[0015]The method can be executed for a set of detector positions in the well in order to estimate its trajectory within the seismic image. It thus makes it possible to reliably reconcile the information acquired directly from the well with the observations made on the seismic image. It can also provide an indication of the deformation exhibited by the seismic image, notably if the latter has been depth-migrated, in as much as the real positions of the detectors can be ascertained from the geometry of the borehole.
[0016]The method ensures, by construction, consistency between the seismic image and the calculated trajectory of the well and makes it possible to perform calibration in a complex speed environment. Technically, having a calibrated well (i.e. a well that is correctly replaced in the seismic image) in a degraded image, for example under a salt canopy, makes it possible to extend the seismic interpretation into the area of poor visibility with greater confidence. The result of this is a lesser uncertainty concerning the mapping of the reservoir roofs and bases, and therefore a better appreciation of the accumulations of hydrocarbons in place. This type of method can be implemented on pre-stack time migration (PSTM) or pre-stack depth migration (PSDM) seismic data.
[0017]The area defined by the envelope of the wavefronts in which a detector will be positioned will usually have a certain extent. To reduce this extent and therefore increase the accuracy of the tying process, it is best to choose the emission points so that the wavefronts have angles between them that are sufficiently large. The accuracy of the positioning of the receiver will also be enhanced if the emission points are suitably chosen in the area of the surface seismic recordings that have contributed to the imaging relating to the geological dip, observed on the detector. The accuracy of the positioning of the receiver can also be enhanced by increasing, beyond three, the number of checkshots from different emission points. A possible method is to use directional detectors, capable of detecting the respective directions of incidence of the seismic waves and of analysing the directions of incidence detected relative to the directions of propagation of the estimated wavefronts.

Problems solved by technology

Obviously, the seismic images produced in this way, and the underlying speed models, exhibit certain distortions because they are only estimations derived from a necessarily limited number of measurements.
On the other hand, in more complex geological cases, and notably in the case of boreholes under salt canopies, the waves emitted on the surface and recorded in the well often do not have a trajectory comparable to that of the surface seismics.
However, the method is then very imprecise when the quality of the image is mediocre or when the speed model used for the migration departs from reality, which is often the case with wells under salt.
The result of this is an uncertainty as to the nature of the reflectors thus positioned.
Furthermore, if the imaging is highly degraded, e.g. for lack of illumination, the method may simply be impossible to implement, since there is no seismic data to compare with the synthetic trace.
In this case, the location uncertainty of the well leads to an uncertainty concerning the extrapolation of the data acquired from the well and concerning the geometry of the reservoirs encountered by the well.

Method used


Image

  • Method for positioning a well relative to seismic image of the subsoil
  • Method for positioning a well relative to seismic image of the subsoil
  • Method for positioning a well relative to seismic image of the subsoil

Examples


Embodiment Construction

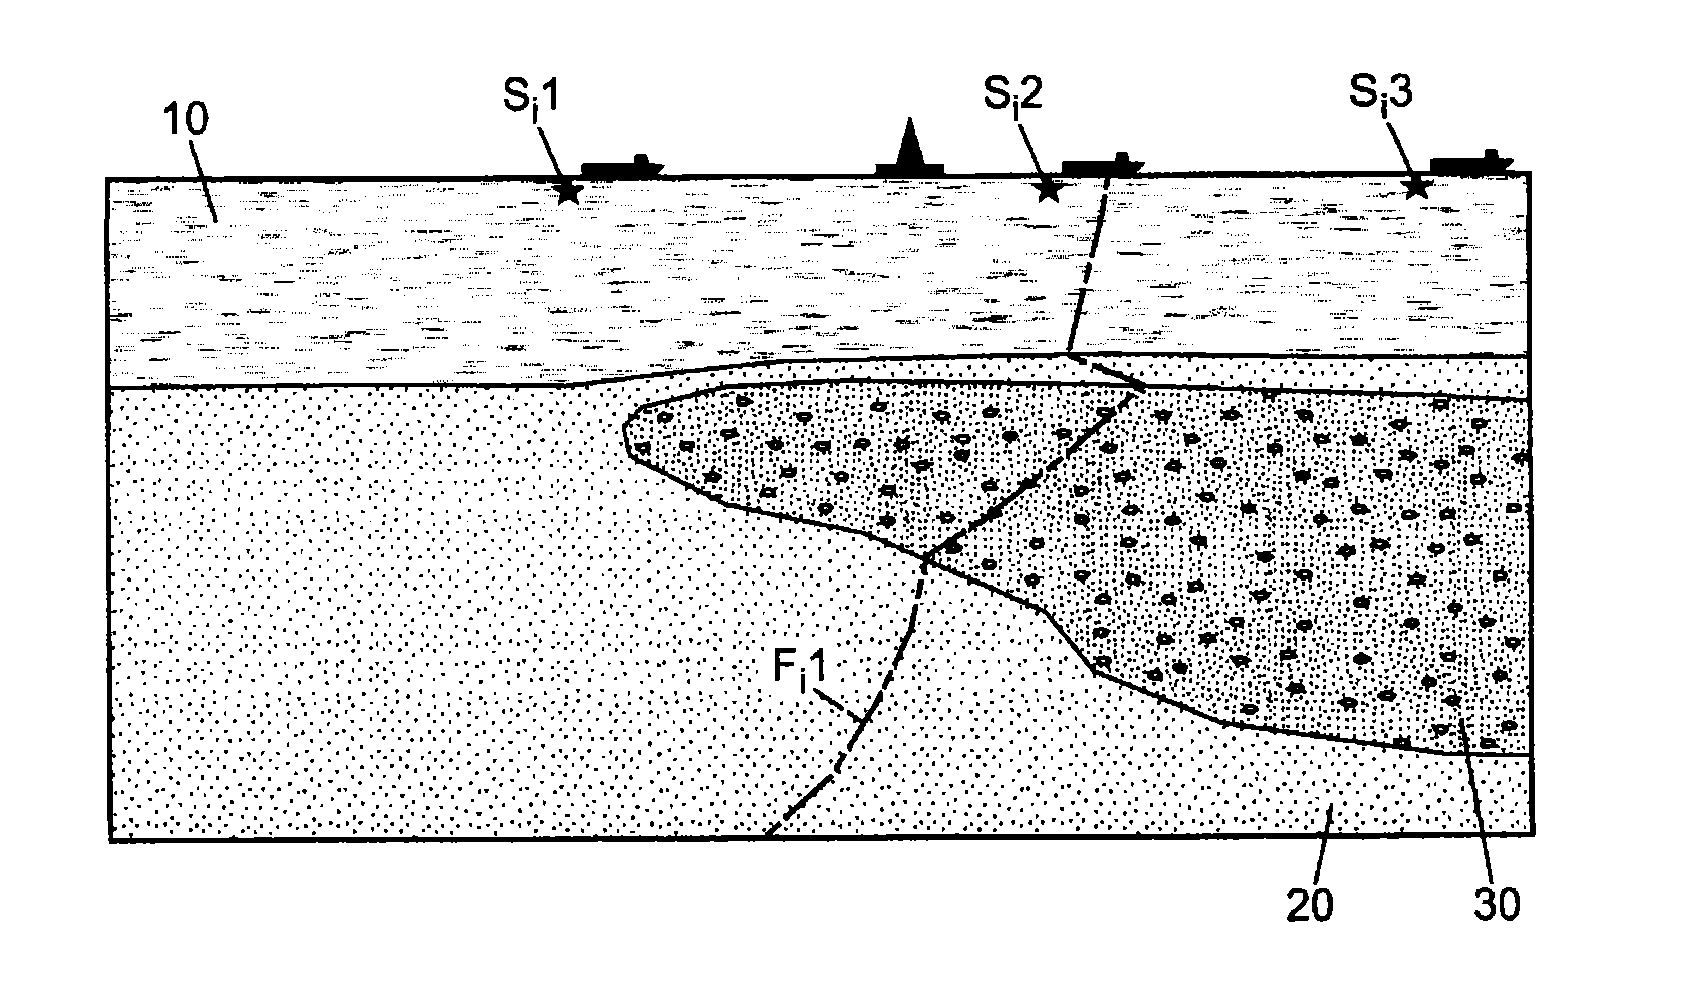
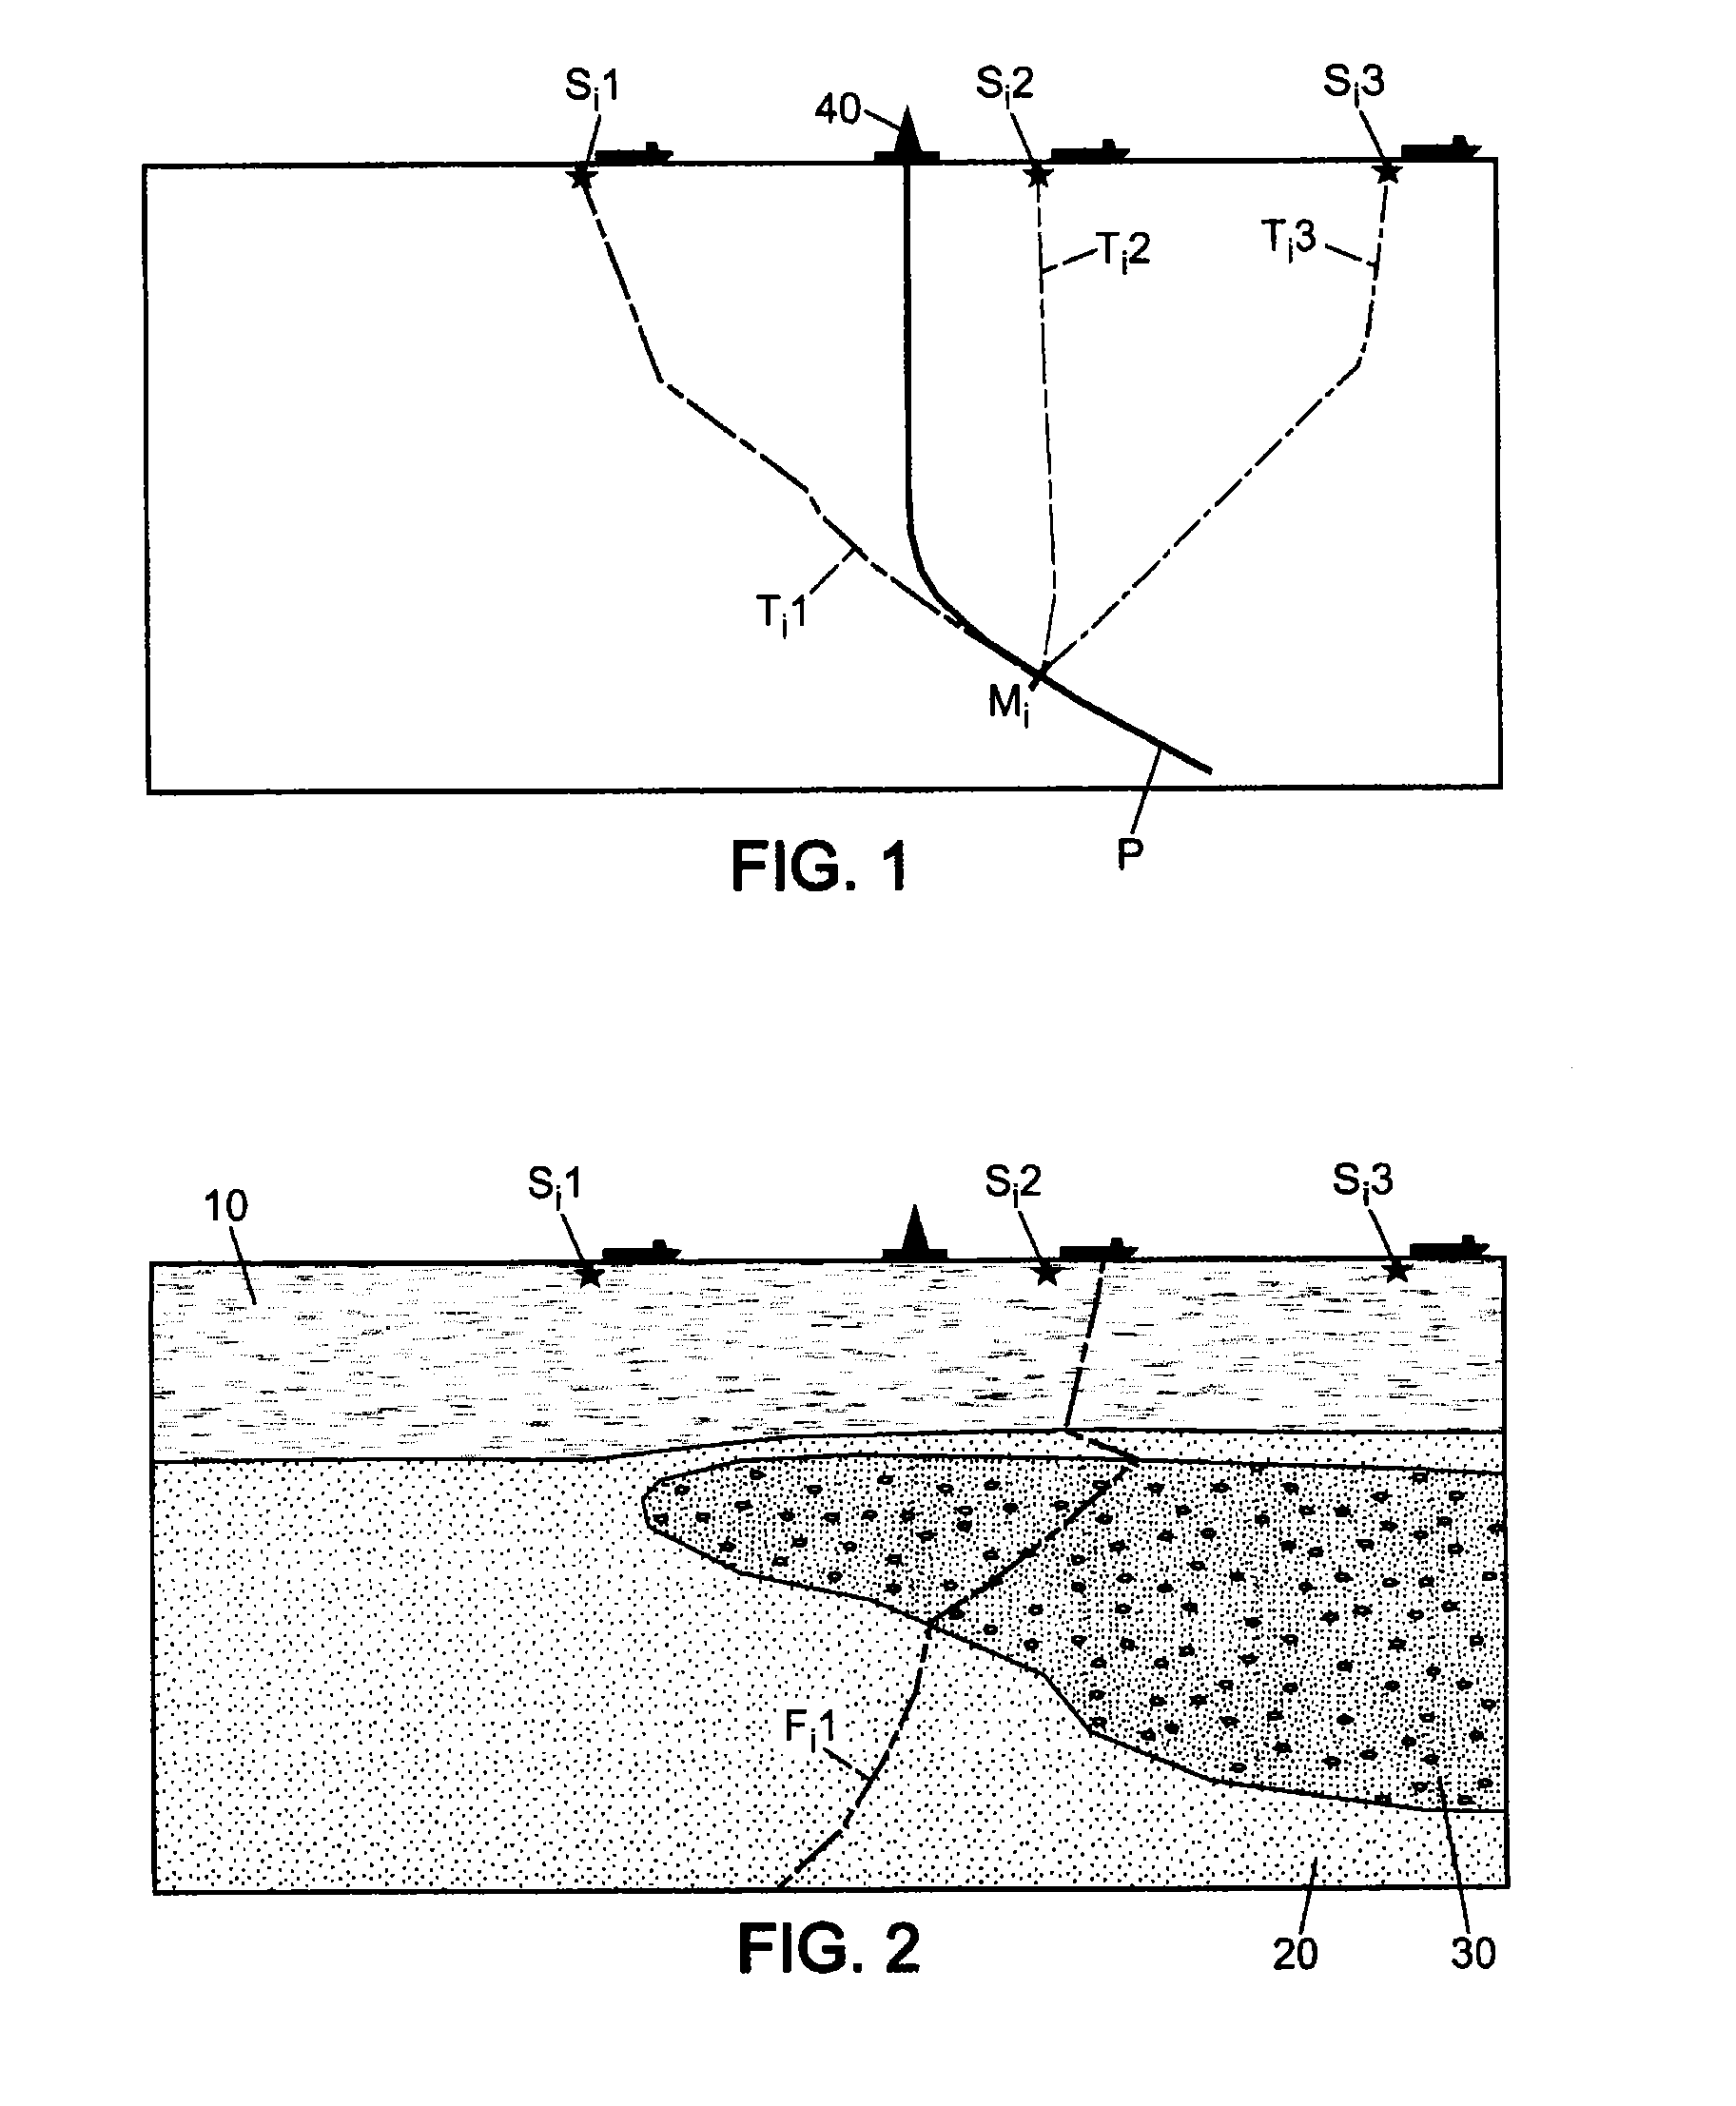
[0030]An exemplary embodiment of the method according to the invention is illustrated in FIGS. 1-4 in the case of a well P drilled under the sea. Surface seismic recordings have previously been made, and their processing has made it possible to construct a seismic image, preferably three-dimensional, of an area of the subsoil. The processing may have been performed according to any known migration technique using the estimation of a speed model V, for example a PSDM or PSTM technique.

[0031]In the simple case represented in FIG. 1, it is considered that the seismic waves encounter three different environments, namely seawater and two types of rocky formations under the sea bed. The speed model V (FIG. 2) provides a three-dimensional map of the speed of propagation of the seismic waves and therefore, in this simple example, shows three regions where the speed has different values, corresponding to the seawater (10) and to the two types of rocky formations (20, 30). This is a model whi...


PUM


Abstract

Three seismic waves are emitted from different emission points situated outside the well that is to be positioned relative to a seismic image. The times of arrival of these seismic waves are measured on a detector placed in the well. The propagation of the seismic waves emitted from the respective emission points is simulated using a speed model that has been used to construct the seismic image. The simulation provides the respective wavefronts presented by each of the waves at the end of a time equal to the time of arrival measured on the detector for this wave. The detector can then be positioned in the envelope area of the wavefronts, adjacent to the intersection of the wavefronts estimated in the seismic volume.

Description

PRIORITY CLAIM[0001]The present application is a National Phase entry of PCT Application No. PCT / FR2009 / 052242, filed Nov. 20, 2009, the disclosure of which is hereby incorporated by reference herein in its entirety.BACKGROUND OF THE INVENTION[0002]The present invention relates to subsoil exploration techniques. It is known, notably in oil exploration, to produce seismic images from series of geophysical measurements performed from the surface and / or in drilling wells. In the seismic reflection technique, these measurements involve the emission into the subsoil of a wave and the measurement of a signal comprising various reflections of the wave on the geological structures encountered. These structures are typically surfaces separating different materials, faults, etc.[0003]The seismic images are two- or three-dimensional representations of the subsoil, the vertical dimension corresponding either to propagation time of the seismic waves or to depth. They are obtained by techniques k...

Claims


Application Information

Patent Timeline
Patent Type & Authority Applications(United States)
IPC IPC(8): G06F19/00
CPCG01V1/42
Inventor MARTIN, VICTORLALANDE, SEVERINECHEYRON, CHRISTIANTHORE, PIERRE
Owner TOTAL PUTEAUX FR
Learn More