Image processing apparatus capable of adding soft focus effects, image processing method, and storage medium
a technology of image processing apparatus and soft focus, applied in the field of image processing apparatus, can solve the problem of different soft focus effects between large-sized images and small-sized images
- Summary
- Abstract
- Description
- Claims
- Application Information
AI Technical Summary
Benefits of technology
Problems solved by technology
Method used
Image
Examples
first embodiment
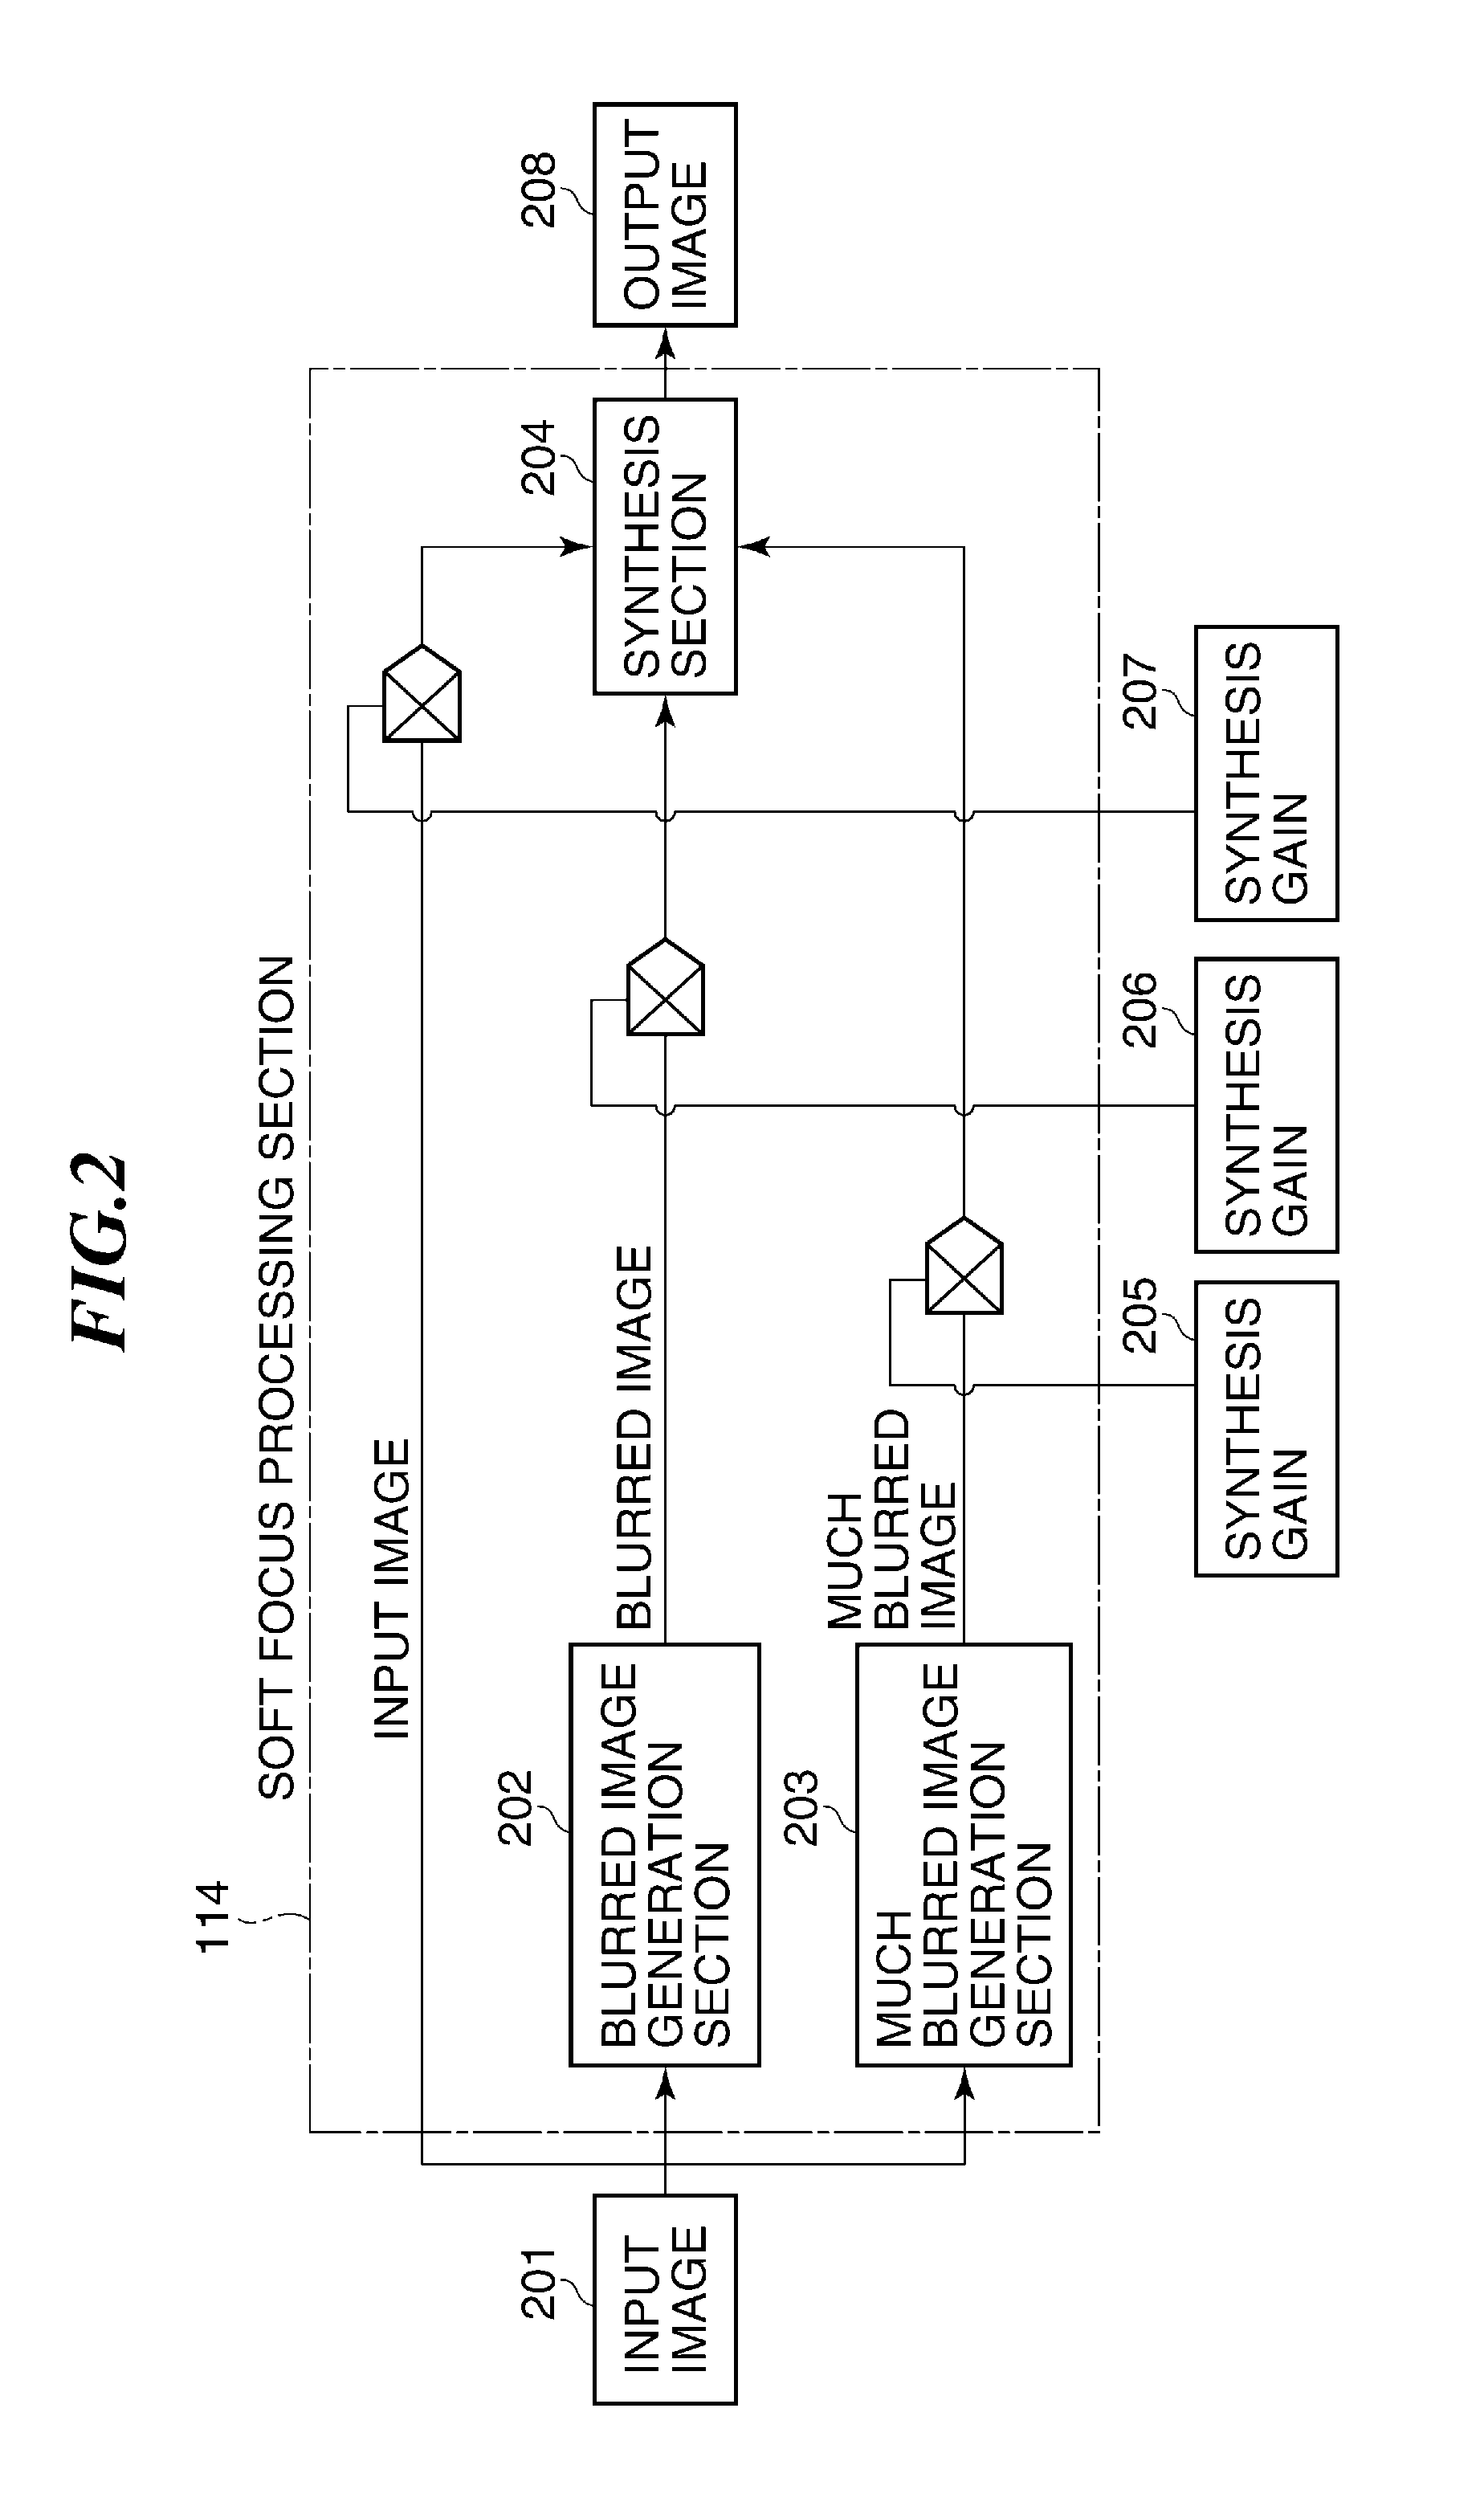
[0060]To solve this problem, in a gain setting method in the first embodiment, the synthesis gains 205 to 207 are set such that the errors are minimized instead of being completely eliminated, and for this purpose, a frequency range in which the errors are reduced is determined according to a scene of an input image. More specifically, the soft focus effects are tailored to a type of a scene of each input image, whereby it is possible to give soft focus effects very close to those given when the errors are eliminated. Now, first, a description will be given of frequency characteristics associated with typical scenes.
[0061]FIGS. 6A, 6B, and 6C are views illustrating typical scenes, respectively. FIG. 6A illustrates a portrait scene, FIG. 6C illustrates a landscape scene, and FIG. 6B illustrates a normal scene other than a portrait scene and a landscape scene. FIG. 7 is a diagram showing general frequency characteristics of the scenes illustrated in FIGS. 6A, 6B, and 6C, respectively....
second embodiment
[0082]In the gain setting method in the second embodiment, a small-sized input image 214 (first input image) and a large-sized input image 213 (second input image) are input to the synthesis gain calculation section 209 as two input images relatively different in image size so as to calculate the synthesis gains 205 to 207. The synthesis gain calculation section 209 analyzes the frequency characteristics of the respective input images 213 and 214.
[0083]FIG. 14 is a flowchart of an input image frequency characteristic analysis process. In the frequency characteristic analysis process, first, an input image is subjected to two-dimensional Fourier transformation (step S1401). Then, a frequency spectrum image in which the luminance represents the amplitude is generated (step S1402).
[0084]FIG. 15A illustrates an example of the input image, and FIG. 15B illustrates an example of the frequency spectrum image generated based on the input image in FIG. 15A. In general, in an image, the amoun...
PUM
 Abstract
Description
Claims
Application Information
 - R&D
- Intellectual Property
- Life Sciences
- Materials
- Tech Scout
- Unparalleled Data Quality
- Higher Quality Content
- 60% Fewer Hallucinations
Browse by: Latest US Patents, China's latest patents, Technical Efficacy Thesaurus, Application Domain, Technology Topic, Popular Technical Reports.
© 2025 PatSnap. All rights reserved.Legal|Privacy policy|Modern Slavery Act Transparency Statement|Sitemap|About US| Contact US: help@patsnap.com


