
Characterization of logging tool performance

a technology of logging tool and performance, applied in the direction of seismology for waterlogging, using reradiation, instruments, etc., can solve the problems of inability to accurately predict the noise of the logging tool is not correlated with finite variance, etc., and achieve the effect of assessing the performance of the logging tool

Inactive Publication Date: 2011-04-21
SHELL OIL CO
View PDF8 Cites 2 Cited by
  • Summary
  • Abstract
  • Description
  • Claims
  • Application Information

AI Technical Summary

Benefits of technology

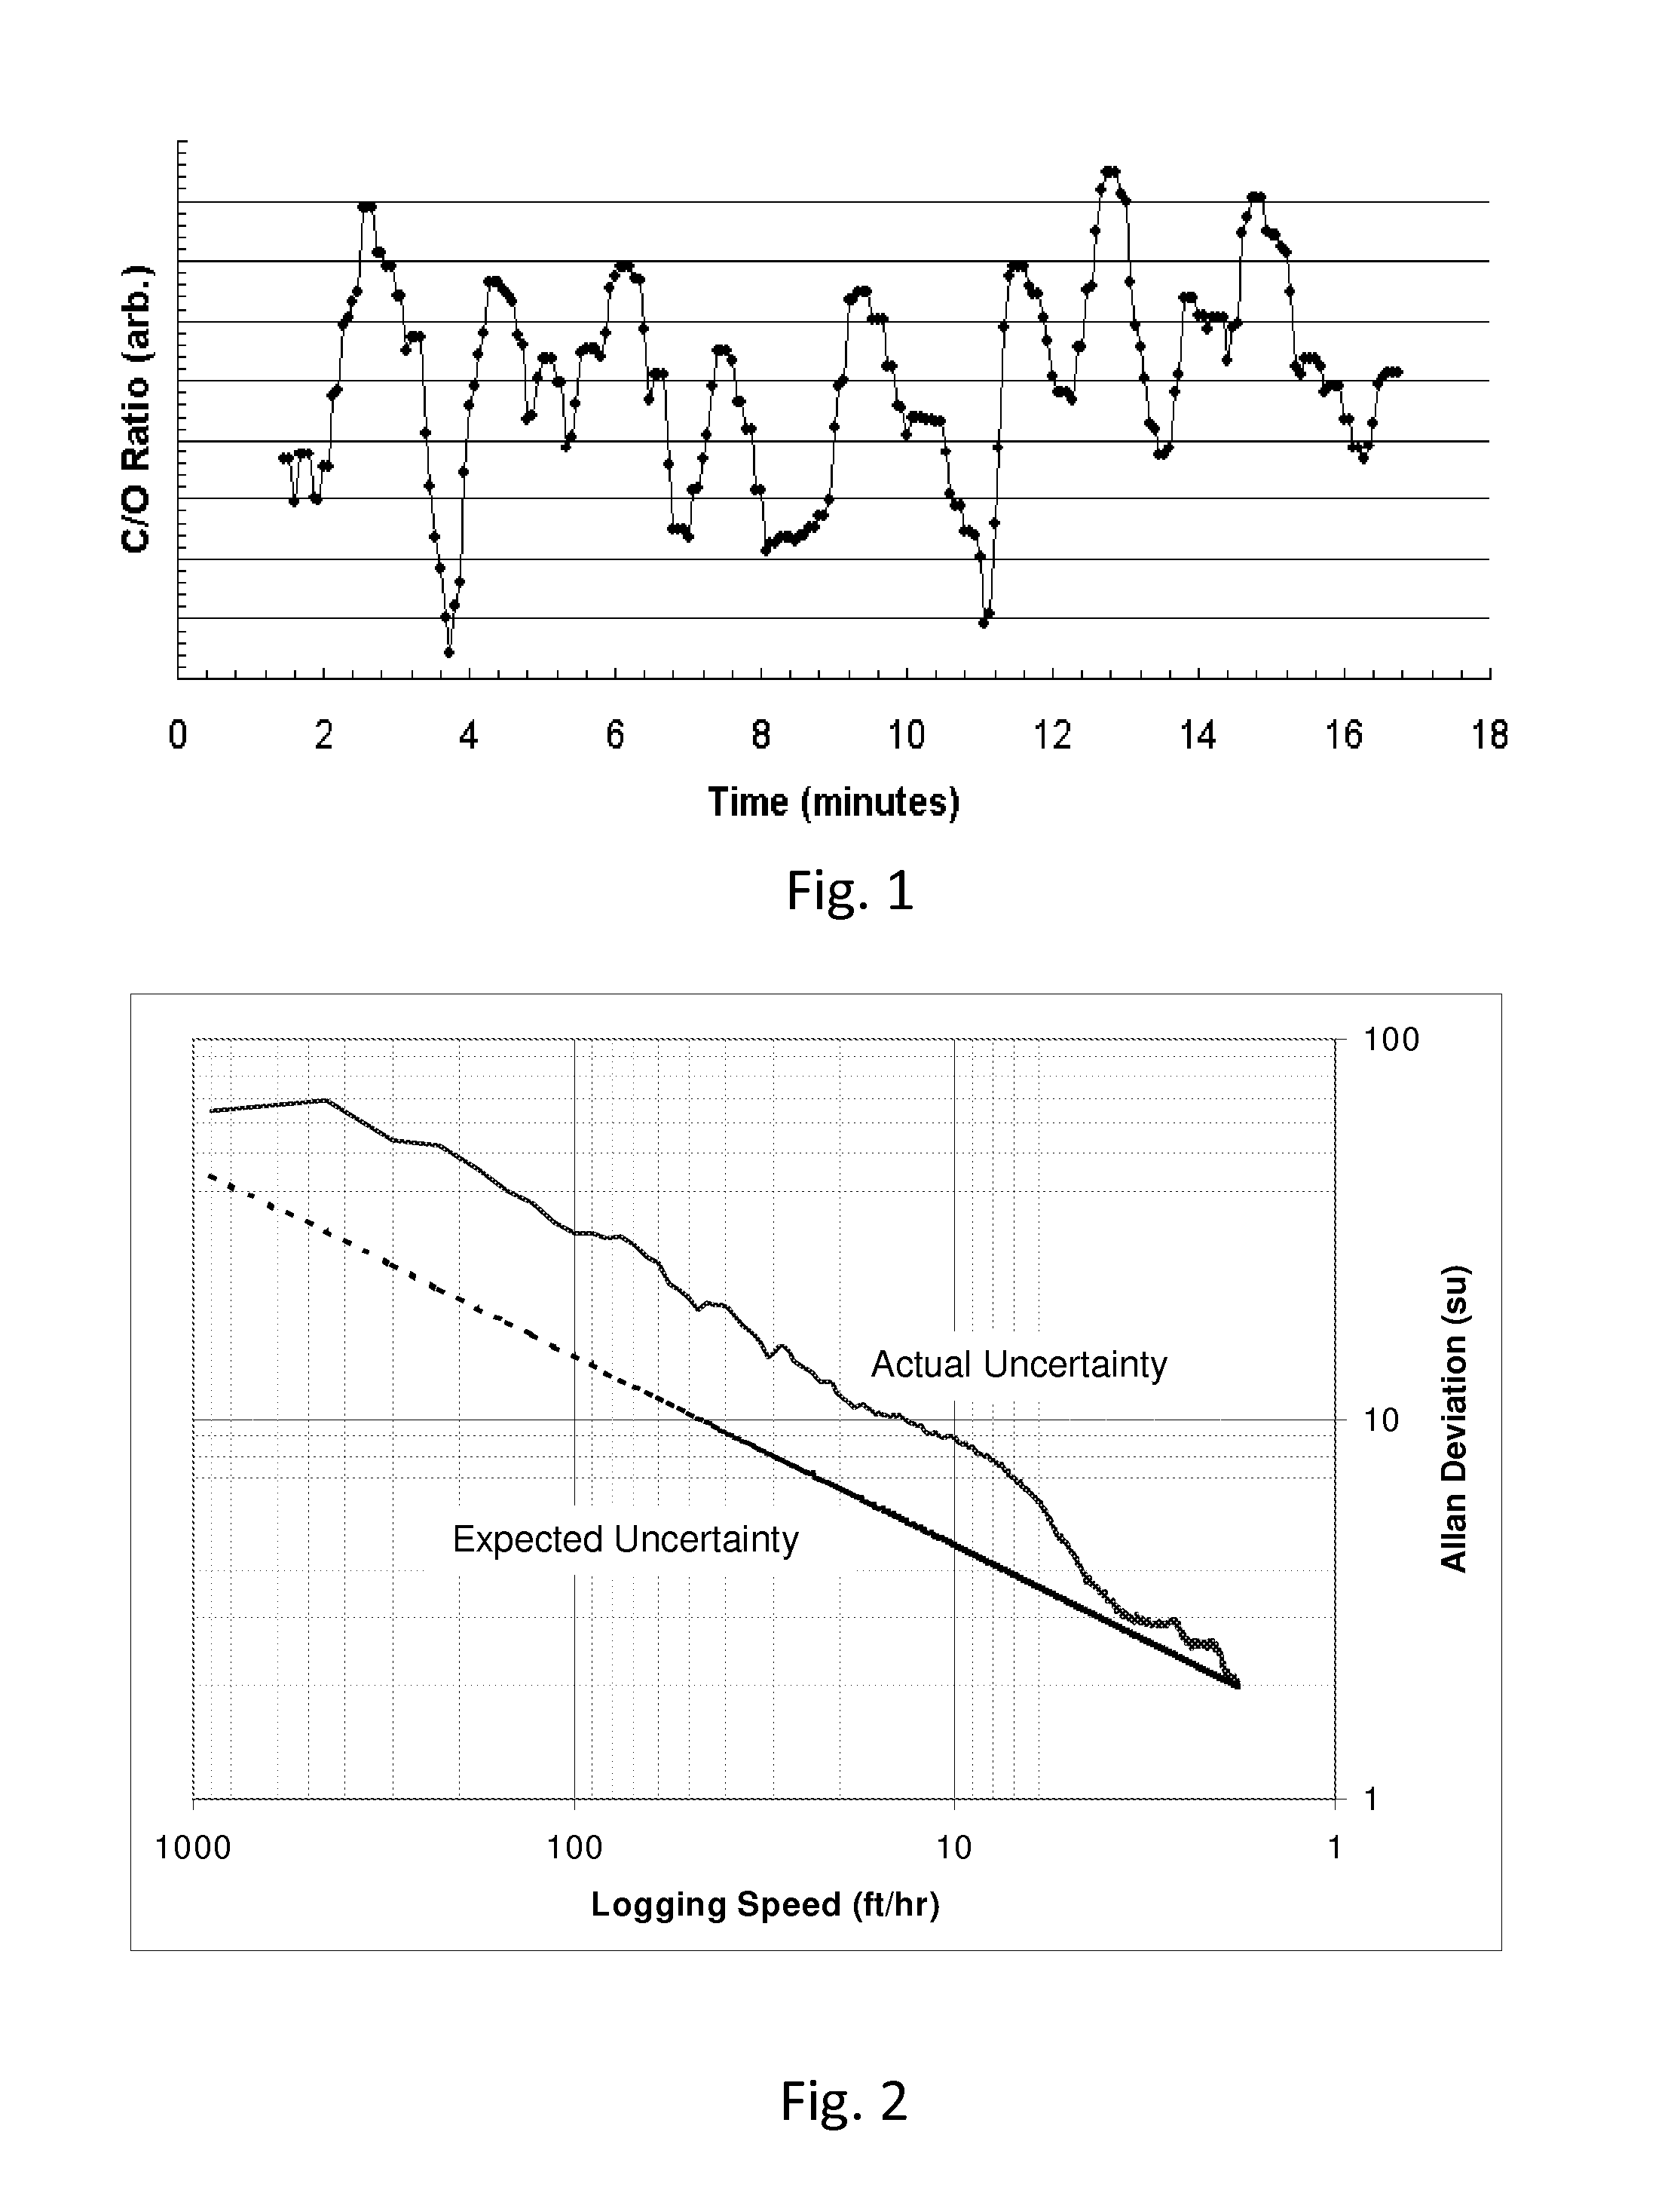
The invention provides a method for determining the uncertainty of measurements made by a logging tool in a borehole. This allows for the selection of an optimal logging speed. The method involves acquiring a logging signal at a constant depth, performing a variance analysis on the data, and using the results of the analysis to output a conclusion regarding the uncertainty of the measurements. The method may also include using an Allan variance to assess the measurements and deriving an optimum logging speed from the analysis. The technical effect of this invention is to improve the accuracy and precision of logging tools in boreholes and optimize the speed at which measurements are made.

Problems solved by technology

However, this approach assumes that the noise of the logging tool is uncorrelated with finite variance.
Because this is not always the case, this mode of estimation will not always predict tool performance accurately.

Method used


Image

  • Characterization of logging tool performance
  • Characterization of logging tool performance
  • Characterization of logging tool performance

Examples


Embodiment Construction

[0013]When it is desired to carry out the invention, a logging tool is lowered into a well. The logging tool is held stationary at one or more predetermined depths and a series of measurements is made at each depth. For each depth, the data comprise a set of measurements over time. The total time period at each depth may be in the range of 1 to 60 minutes, and is more preferably in the range of 10 to 30 minutes. The frequency at which data are collected may be in the range of 1 to 60 data points per minute, and is more preferably in the range of 15 to 30 data points per minute. FIG. 1 is an example of a set of data collected at a single depth over a period of 16 minutes and with a data collection rate of 15 data points per minute. The data may include any of various types of signal, including but not limited to: PNS logs, density logs, neutron porosity, and pulsed neutron capture log (also referred to as sigma logs). Similarly, the data may be indicative of any of various properties...


PUM


Abstract

A method for determining the measurement precision of a formation evaluation tool in a borehole comprises: a) conveying the formation evaluation tool into the borehole, b) using the formation evaluation tool to make measurements, and c) analyzing the measurements using mean squared difference stability statistics to generate an output indicative of measurement precision. Step c) may comprise using an Allan variance to assess the measurements taken in step b). The method may further include deriving an optimum logging speed from the analysis performed in step c), which may occur at the lowest value of the Allan variance.

Description

RELATED CASES[0001]This application claims priority to U.S. provisional application No. 61 / 246,674, which was filed on 29 Sep. 2009 and is incorporated herein by reference.FIELD OF THE INVENTION[0002]This invention relates generally to methods for assessing the performance of pulsed neutron logging tools in a downhole environment and more particularly to the use of statistical techniques to characterize the performance of a logging tool as a function of time or logging speed.BACKGROUND OF THE INVENTION[0003]Oil or gas wells are often surveyed in order to assess one or more properties of the surrounding formation. The surveys are typically carried out using electronic measuring instruments that are conveyed into the borehole on a device such as a cable, a wireline, slickline, drill pipe or coiled tubing. The desired measurements may be carried out using electrical, acoustical, nuclear and / or magnetic signals that pass through the formation and / or the fluids within the borehole. The s...

Claims


Application Information

Patent Timeline
Patent Type & Authority Applications(United States)
IPC IPC(8): G06F17/18G01V9/00G06F19/00
CPCG01V5/105
Inventor KITTRIDGE, MARK GERARDROLLER, CHAD BARRETT
Owner SHELL OIL CO
Learn More