
Imaging of light scattering tissues with fluorescent contrast agents

a tissue and contrast agent technology, applied in the field of spectroscopic imaging of heterogeneous light scattering tissue, can solve the problems of limiting the availability of mri diagnostics, unable to provide a viable spatial imaging procedure, and unable to obtain meaningful relational measurements of fluorescence characteristics from random procedures, etc., to achieve the effect of improving imaging

Inactive Publication Date: 2010-12-02
SEVICK MURACA EVA M +2
View PDF11 Cites 2 Cited by
  • Summary
  • Abstract
  • Description
  • Claims
  • Application Information

AI Technical Summary

Benefits of technology

Enables noninvasive imaging of hidden tissue volumes and improves contrast for photon migration imaging, allowing for the detection of tissue heterogeneities and metabolites in vivo, with enhanced image resolution and contrast that is not solely dependent on the uptake of contrast agents.

Problems solved by technology

Unfortunately, the complexity and expense of MRI diagnostics limit its availability—especially as a means of routine monitoring for disease.
Unfortunately, these procedures generally fail to provide a viable spatial imaging procedure.
One reason imaging based on fluorescence has remained elusive is that meaningful relational measurements of fluorescence characteristics from a random, multiply scattering media, such as tissue, are difficult to obtain.
For example, fluorescent intensity, which is a function of the fluorescent compound (or fluorophore) concentration or “uptake” is one possible candidate for imaging; however, when this property is used in an optically dense medium, such as a particulate (cell) suspension, powder, or tissue, the local scattering and absorption properties confound measured fluorescent intensities.
Like intensity, measurement of these fluorescence characteristics is often limited to well-defined in vitro applications in the research laboratory or in flow cytometry where issues such as scattering, absorption, and changing fluorophore concentrations can be controlled or measured.
Moreover, these limitations generally preclude meaningful fluorescence-based imaging of hidden tissue heterogeneities, such as tumors or other diseased tissue regions, which cannot be detected by visual inspection.
Unfortunately, targeted and site specific delivery of is drugs and contrast agents has historically been a limiting factor in both therapeutics and diagnostic imaging.

Method used


Image

  • Imaging of light scattering tissues with fluorescent contrast agents
  • Imaging of light scattering tissues with fluorescent contrast agents
  • Imaging of light scattering tissues with fluorescent contrast agents

Examples


example 1

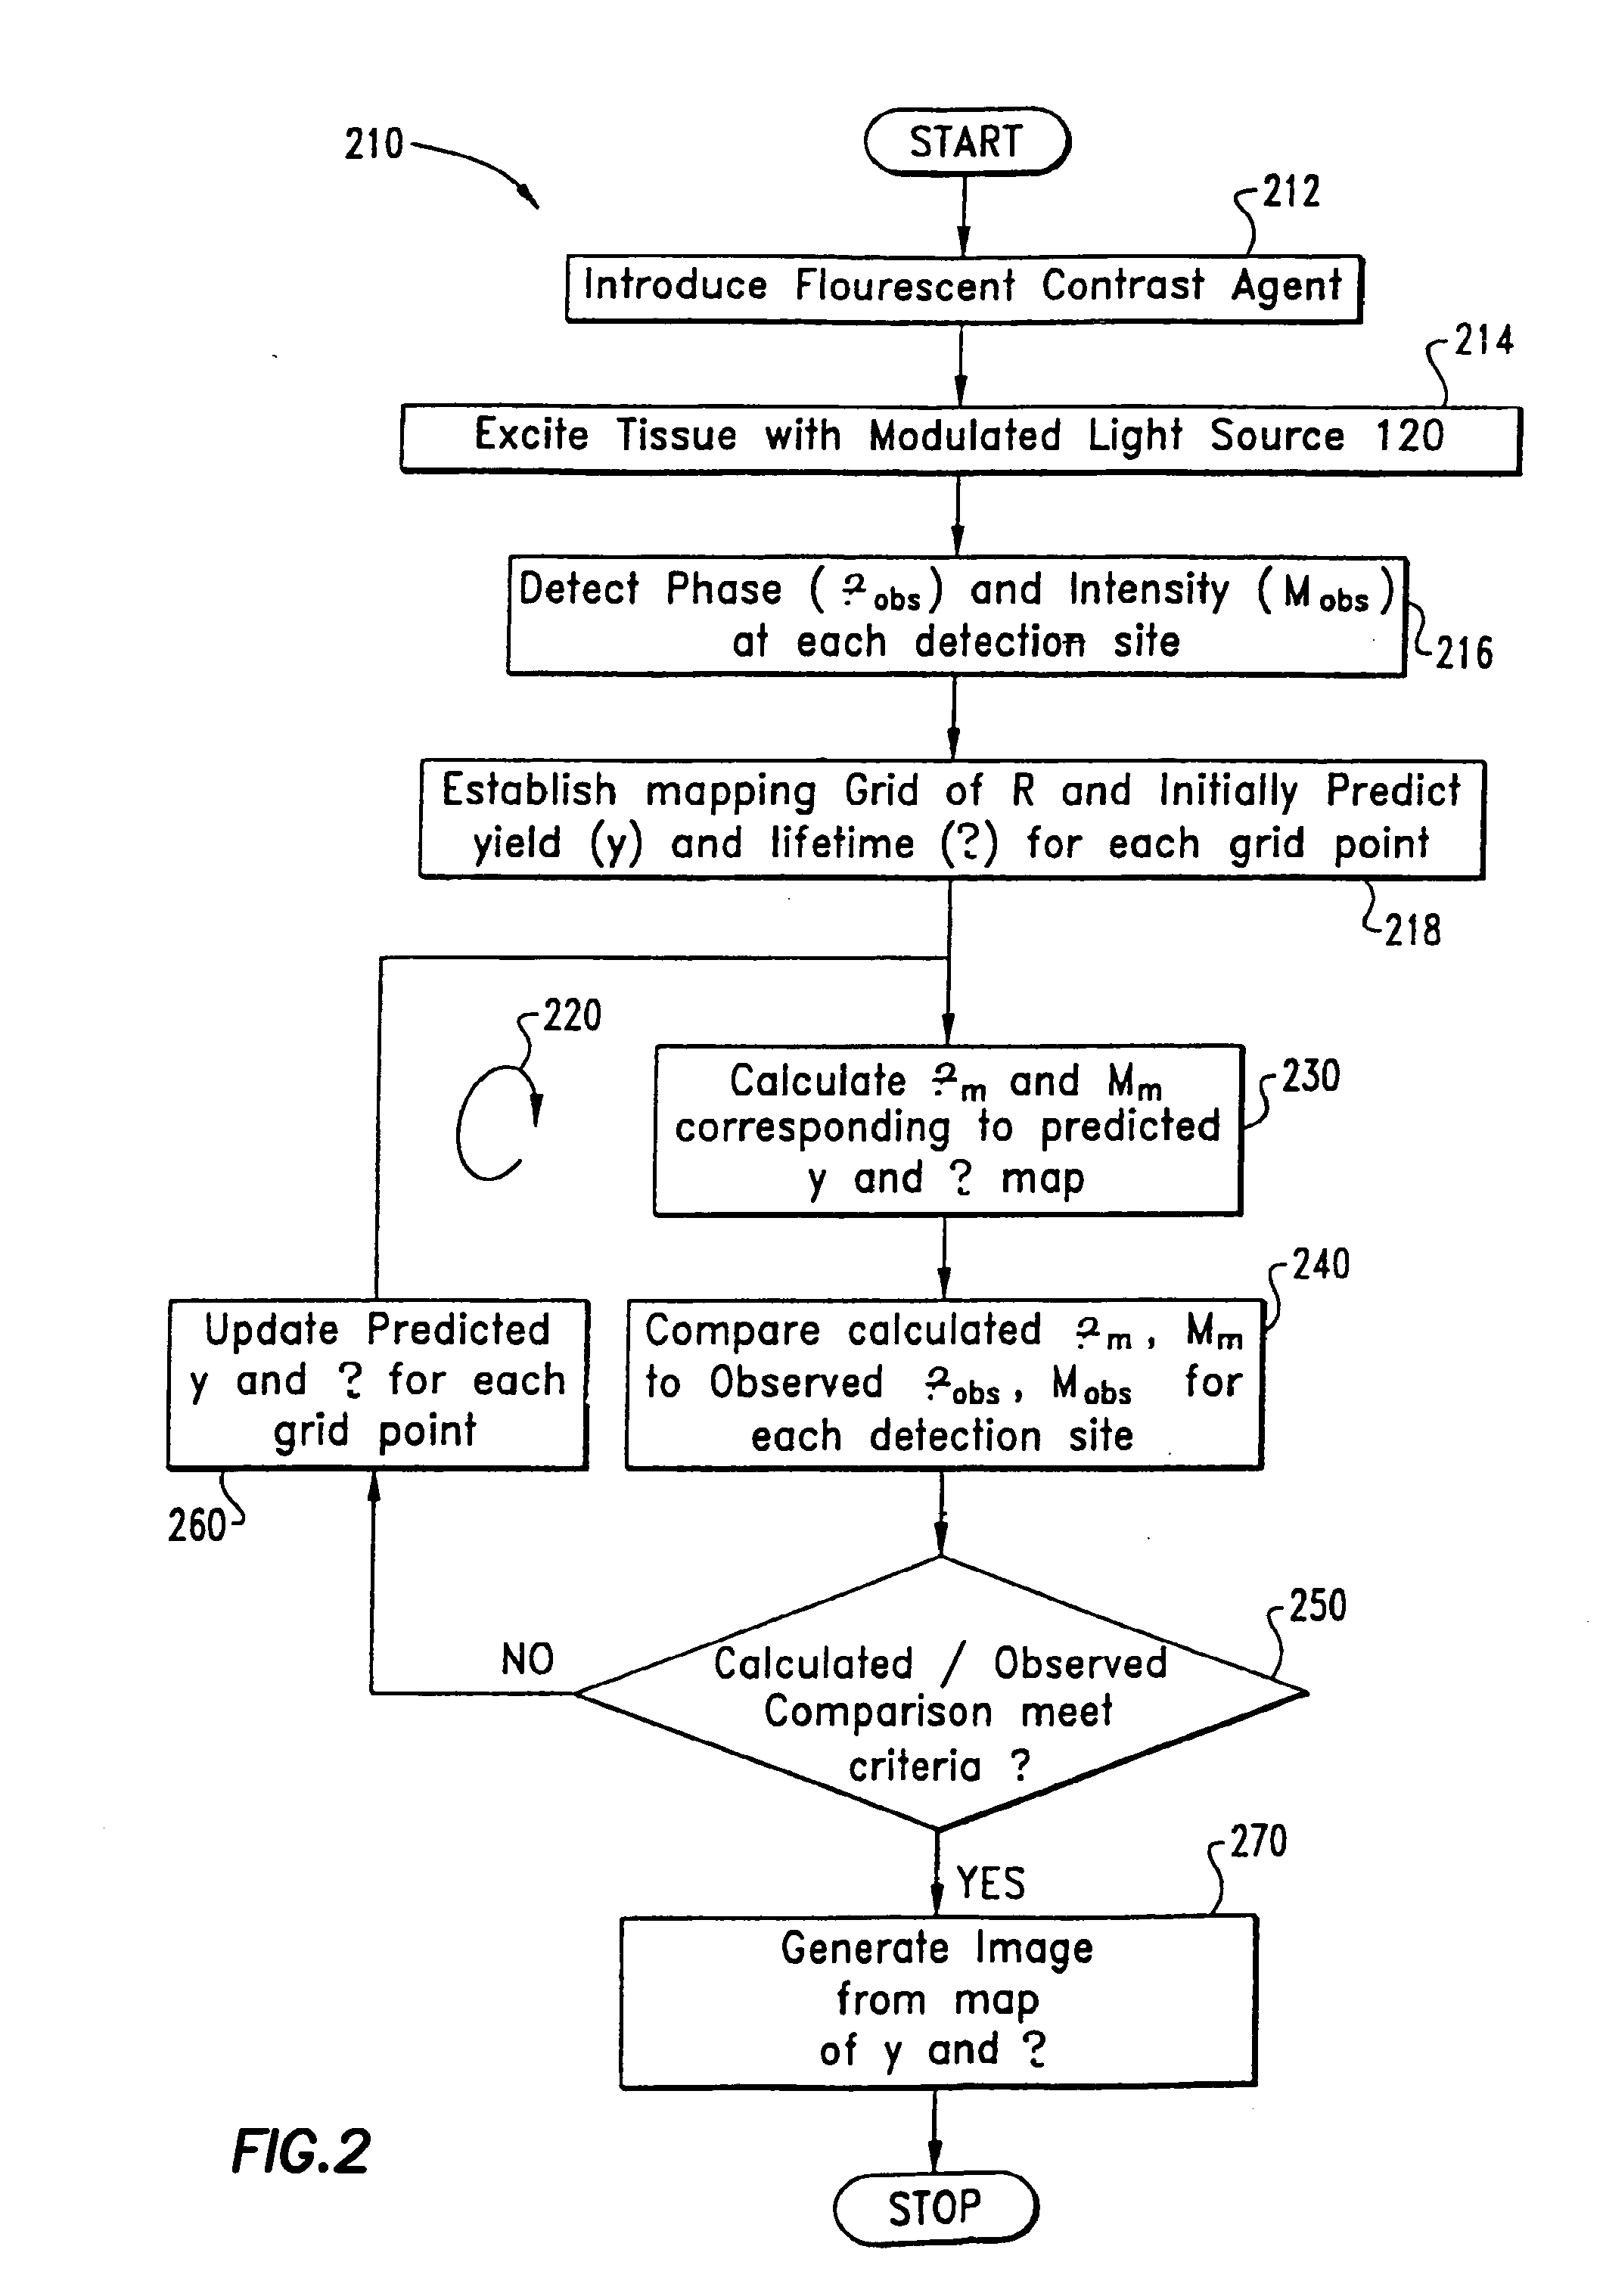
[0108]Example 1 reconstructs fluorescent yield and lifetime with no absorption due to non-fluorescing chromophores. To simulate the experimental data for this example, the fluorescent yield, (ημax→m)j, for the background and the heterogeneity 302 were chosen as 1×10⁻⁵ mm−1 and 1×10⁻³ mm−1 respectively and the fluorescence lifetime, (τ)j, for the background and the heterogeneity 302 chosen as 10 ns and 1 ns respectively. During the execution of loop 220, no a priori knowledge of either the heterogeneity 302 location or the background-fluorescence properties was assumed and a uniform guess of 1×10⁻⁵ mm−1 and 10 ns was given for the fluorescence yield, (ημax→m)j, and lifetime, (τ)j, respectively. Convergence was achieved in less than 50 iterations of Loop 220 (computational time on a SunSparc10: 2 hours) for a two dimensional 17×17 grid. The average values of ημax→m and τ in the grid points which occupy the simulated object converge within 50 iterations to ημax→m=0.93×10⁻³ mm−1 and τ=1...

example 2

[0111]Example 2 reconstructs fluorescent yield and lifetime with a simulated chromophore absorption configured to mimic tissue. The same hidden heterogeneity as well as optical parameters and simulation equipment were used as described in Example 1 except that a uniform background chromophore absorption coefficient, μax→ of 1×10⁻³ mm−1 was used to generate the simulated experimental data. While excitation light propagation was not employed for image reconstruction, we considered this optical property known to estimate the best possible performance for inverse image reconstruction under physiological conditions. The two-dimensional reconstructed spatial map of the fluorescence yield, (ημax→m)j [mm−1], and lifetime, (τ)j [ns], are shown in FIGS. 12 and 13, respectively. As shown in Table 3, the mean value of location of the object according to our criterion based on ημax→m occurred as position (59.4, 58.3) consistent with the conditions used to simulate the experimental data. The dime...

example 3

[0112]Example 3 simulated two hidden heterogeneities in the tissue phantom (not shown in FIG. 3). In this case, the same optical parameters were used as described in example 1 except that the fluorescence yield ημax→m for the objects 1 and 2 was chosen as 1×10⁻³ mm−1 and 2×10⁻³ mm−1 respectively and lifetime τ for the heterogeneities chosen as 1 ns and 2 ns, respectively. A 33×33 grid was employed instead of a 17×17 grid. An image corresponding to the mapping of yield is depicted in FIG. 14.


PUM


Abstract

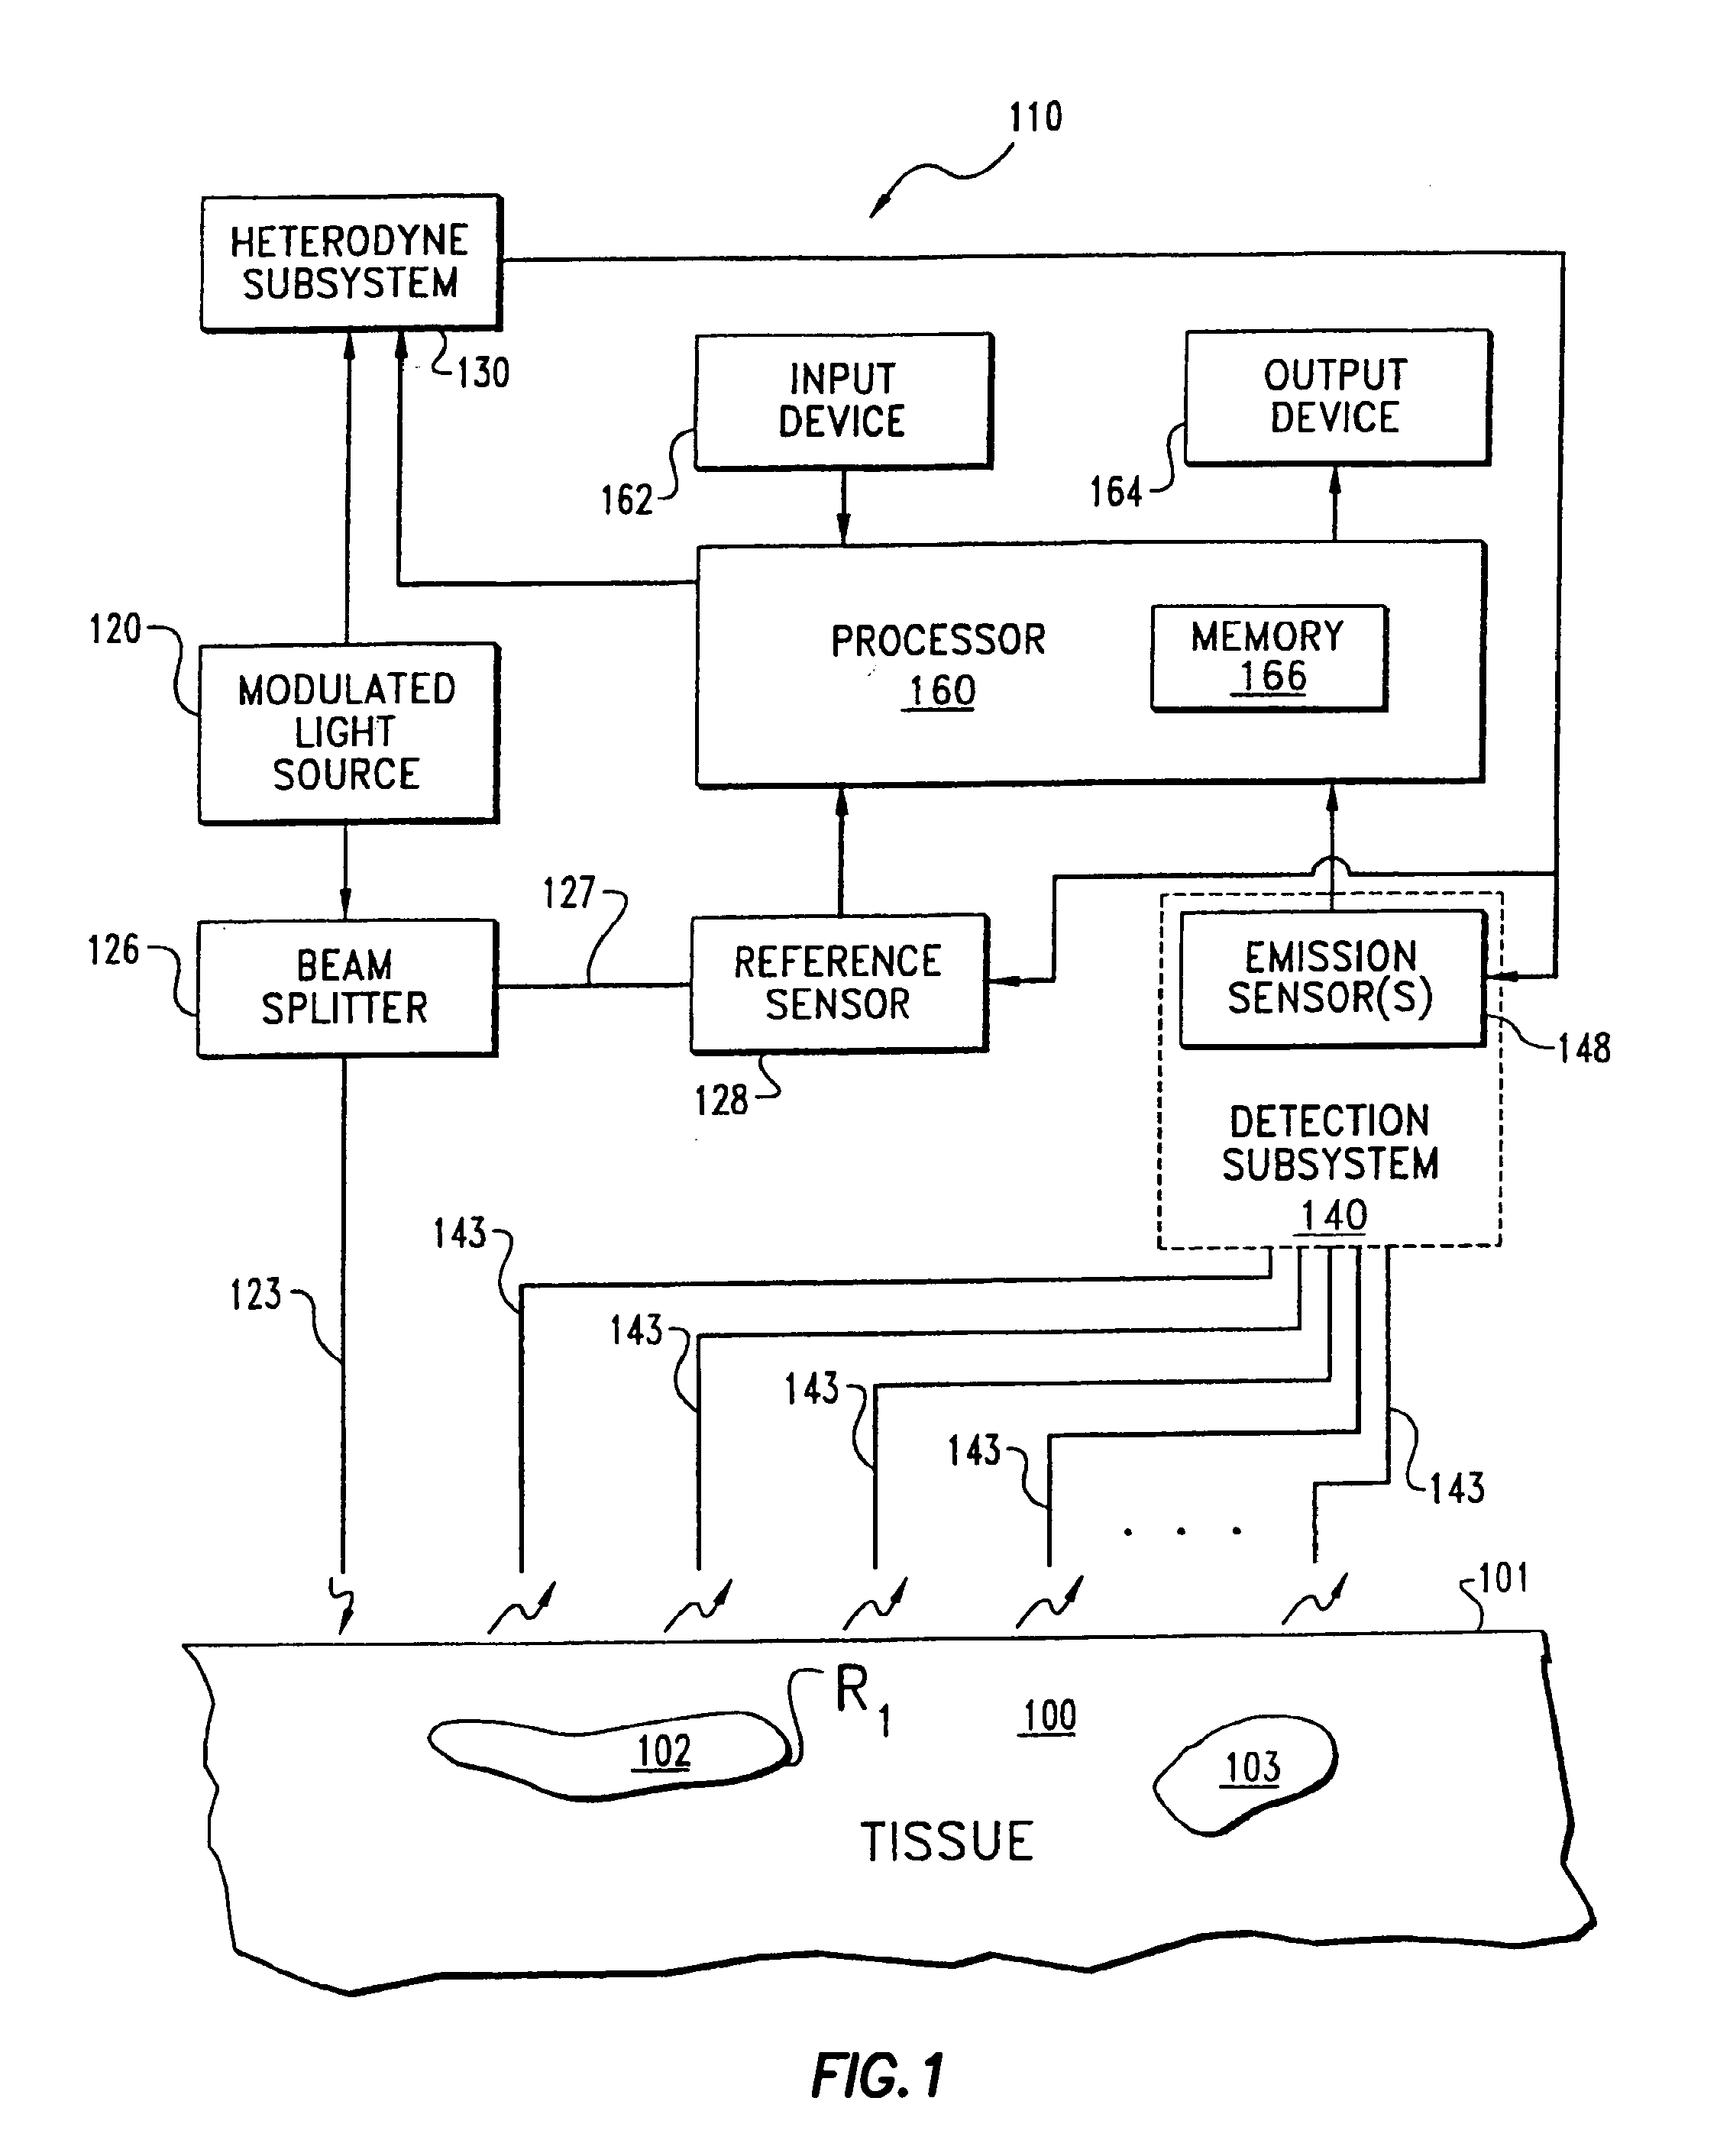
A system and method for non-invasive biomedical optical imaging and spectroscopy with low-level light is described. The technique includes a modulated light source coupled to tissue to introduce excitation light. Fluorescent light emitted in response to the excitation light is detected with a sensor. The AC intensity and phase of the excitation and detected fluorescent light is provided to a processor operatively coupled to the sensor. A processor employs the measured emission kinetics of excitation and fluorescent light to “map” the spatial variation of one or more fluorescence characteristics of the tissue and generate a corresponding image of the tissue via an output device. The fluorescence characteristic may be provided by exogenous contrast agents, endogenous fluorophores, or both. A technique to select or design an exogenous fluorescent contrast agent to improve image contrast is also disclosed.

Description

BACKGROUND OF THE INVENTION[0001]The present invention relates to spectroscopic imaging of heterogeneous light scattering tissue, and more particularly, but not exclusively, relates to in vivo imaging by mapping a fluorescence characteristic of the tissue.[0002]The early detection of disease promises a greater efficacy for therapeutic intervention. In recent years, noninvasive techniques have been developed which have improved the ability to provide a reliable and early diagnosis of various afflictions by detecting biochemical changes in the tissue of a patient. For example, Magnetic Resonance Imaging (MRI) has successfully monitored the relaxation of spin states of paramagnetic nuclei in order to provide biomedical imaging and biochemical spectroscopy of tissues. Unfortunately, the complexity and expense of MRI diagnostics limit its availability—especially as a means of routine monitoring for disease.[0003]Another powerful analytical technique with an increasing number of applicati...

Claims


Application Information

Patent Timeline
Patent Type & Authority Applications(United States)
IPC IPC(8): A61B6/00A61B5/00
CPCA61B5/0059A61B5/418A61B5/415
Inventor SEVICK-MURACA, EVA M.TROY, TAMARA L.REYNOLDS, JEFFERY S.
Owner SEVICK MURACA EVA M
Learn More