Mass spectrometer and mass spectrometry method
- Summary
- Abstract
- Description
- Claims
- Application Information
AI Technical Summary
Benefits of technology
Problems solved by technology
Method used
Image
Examples
first embodiment
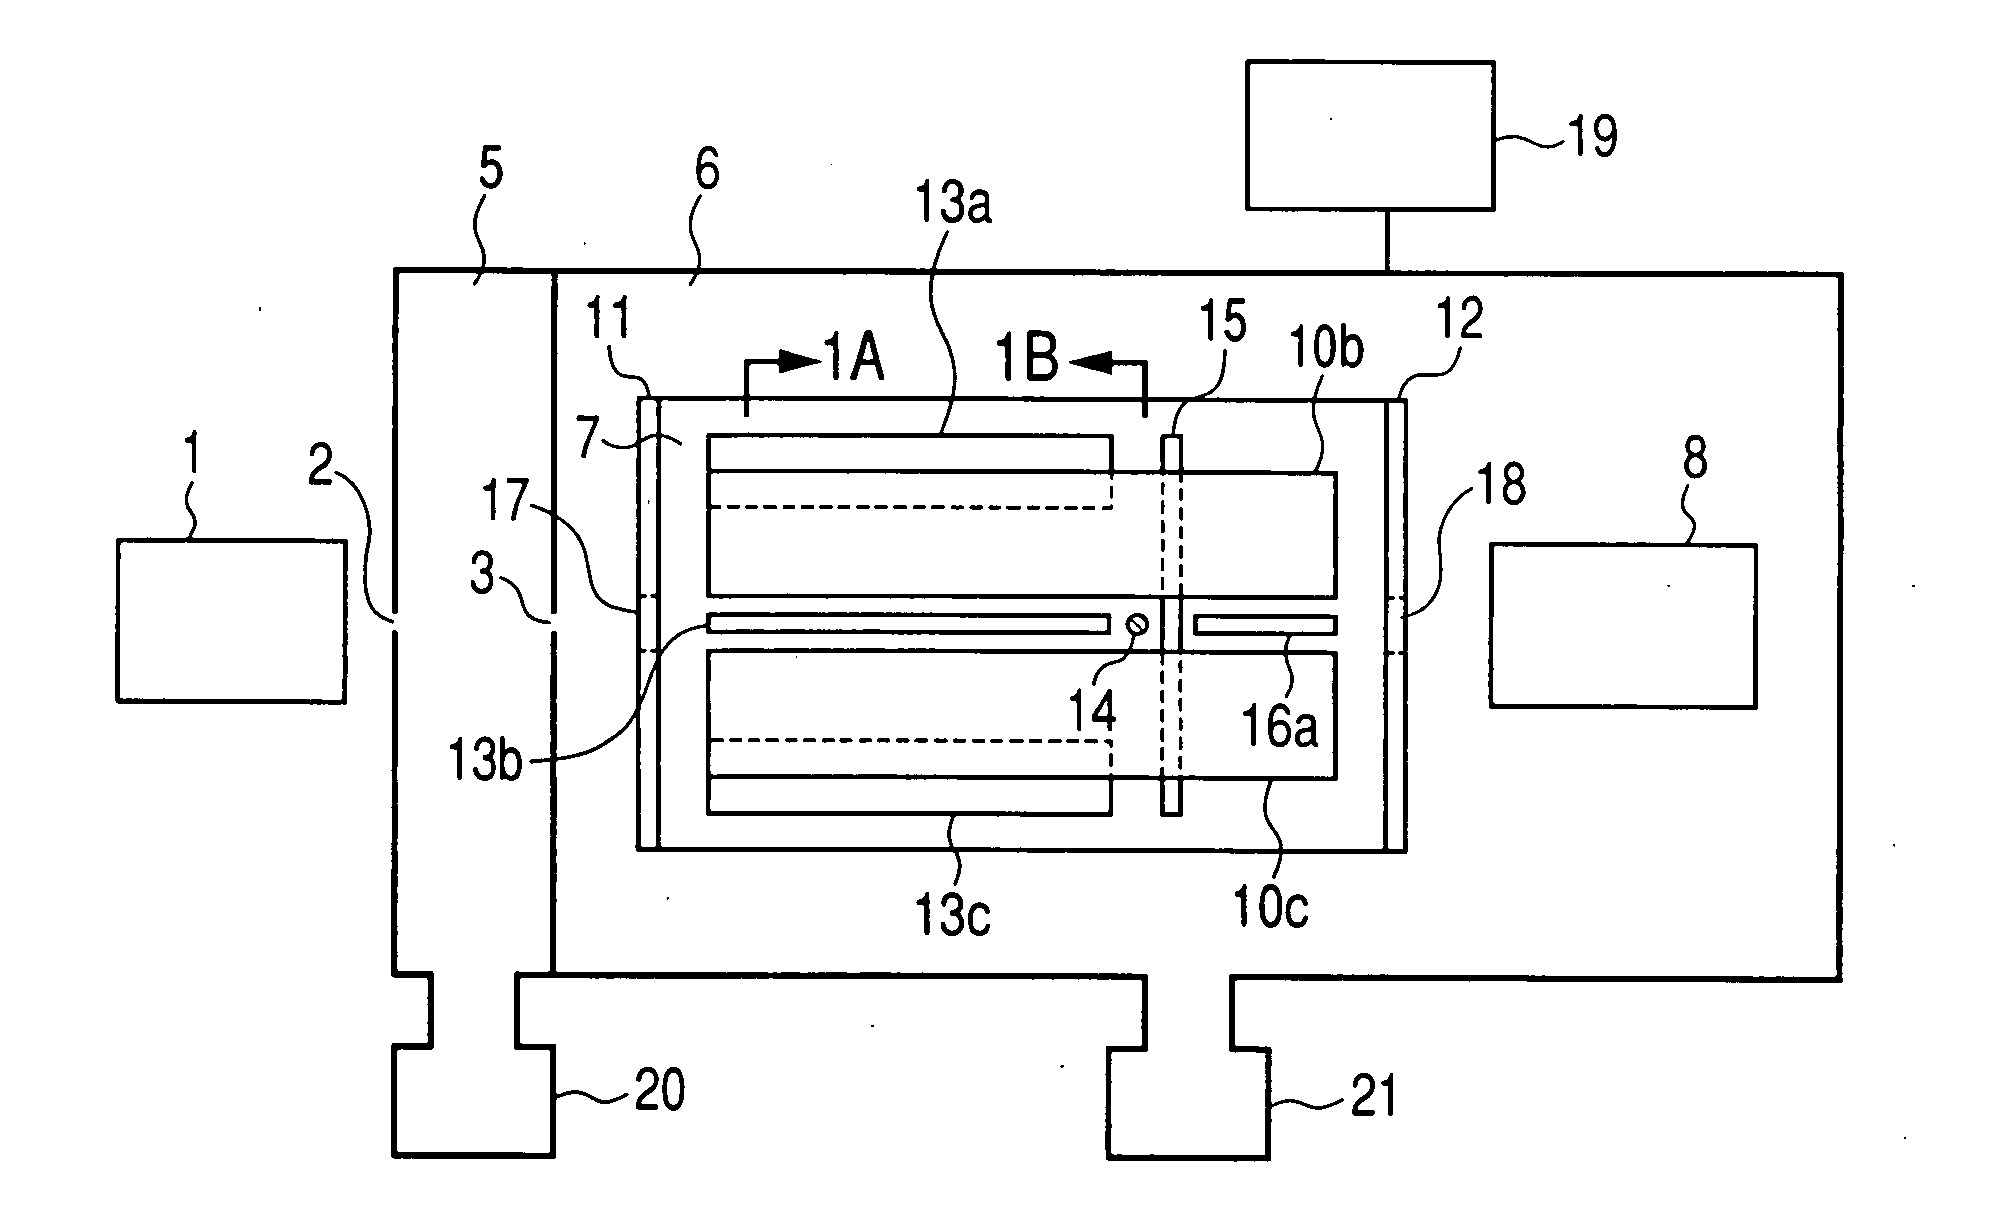
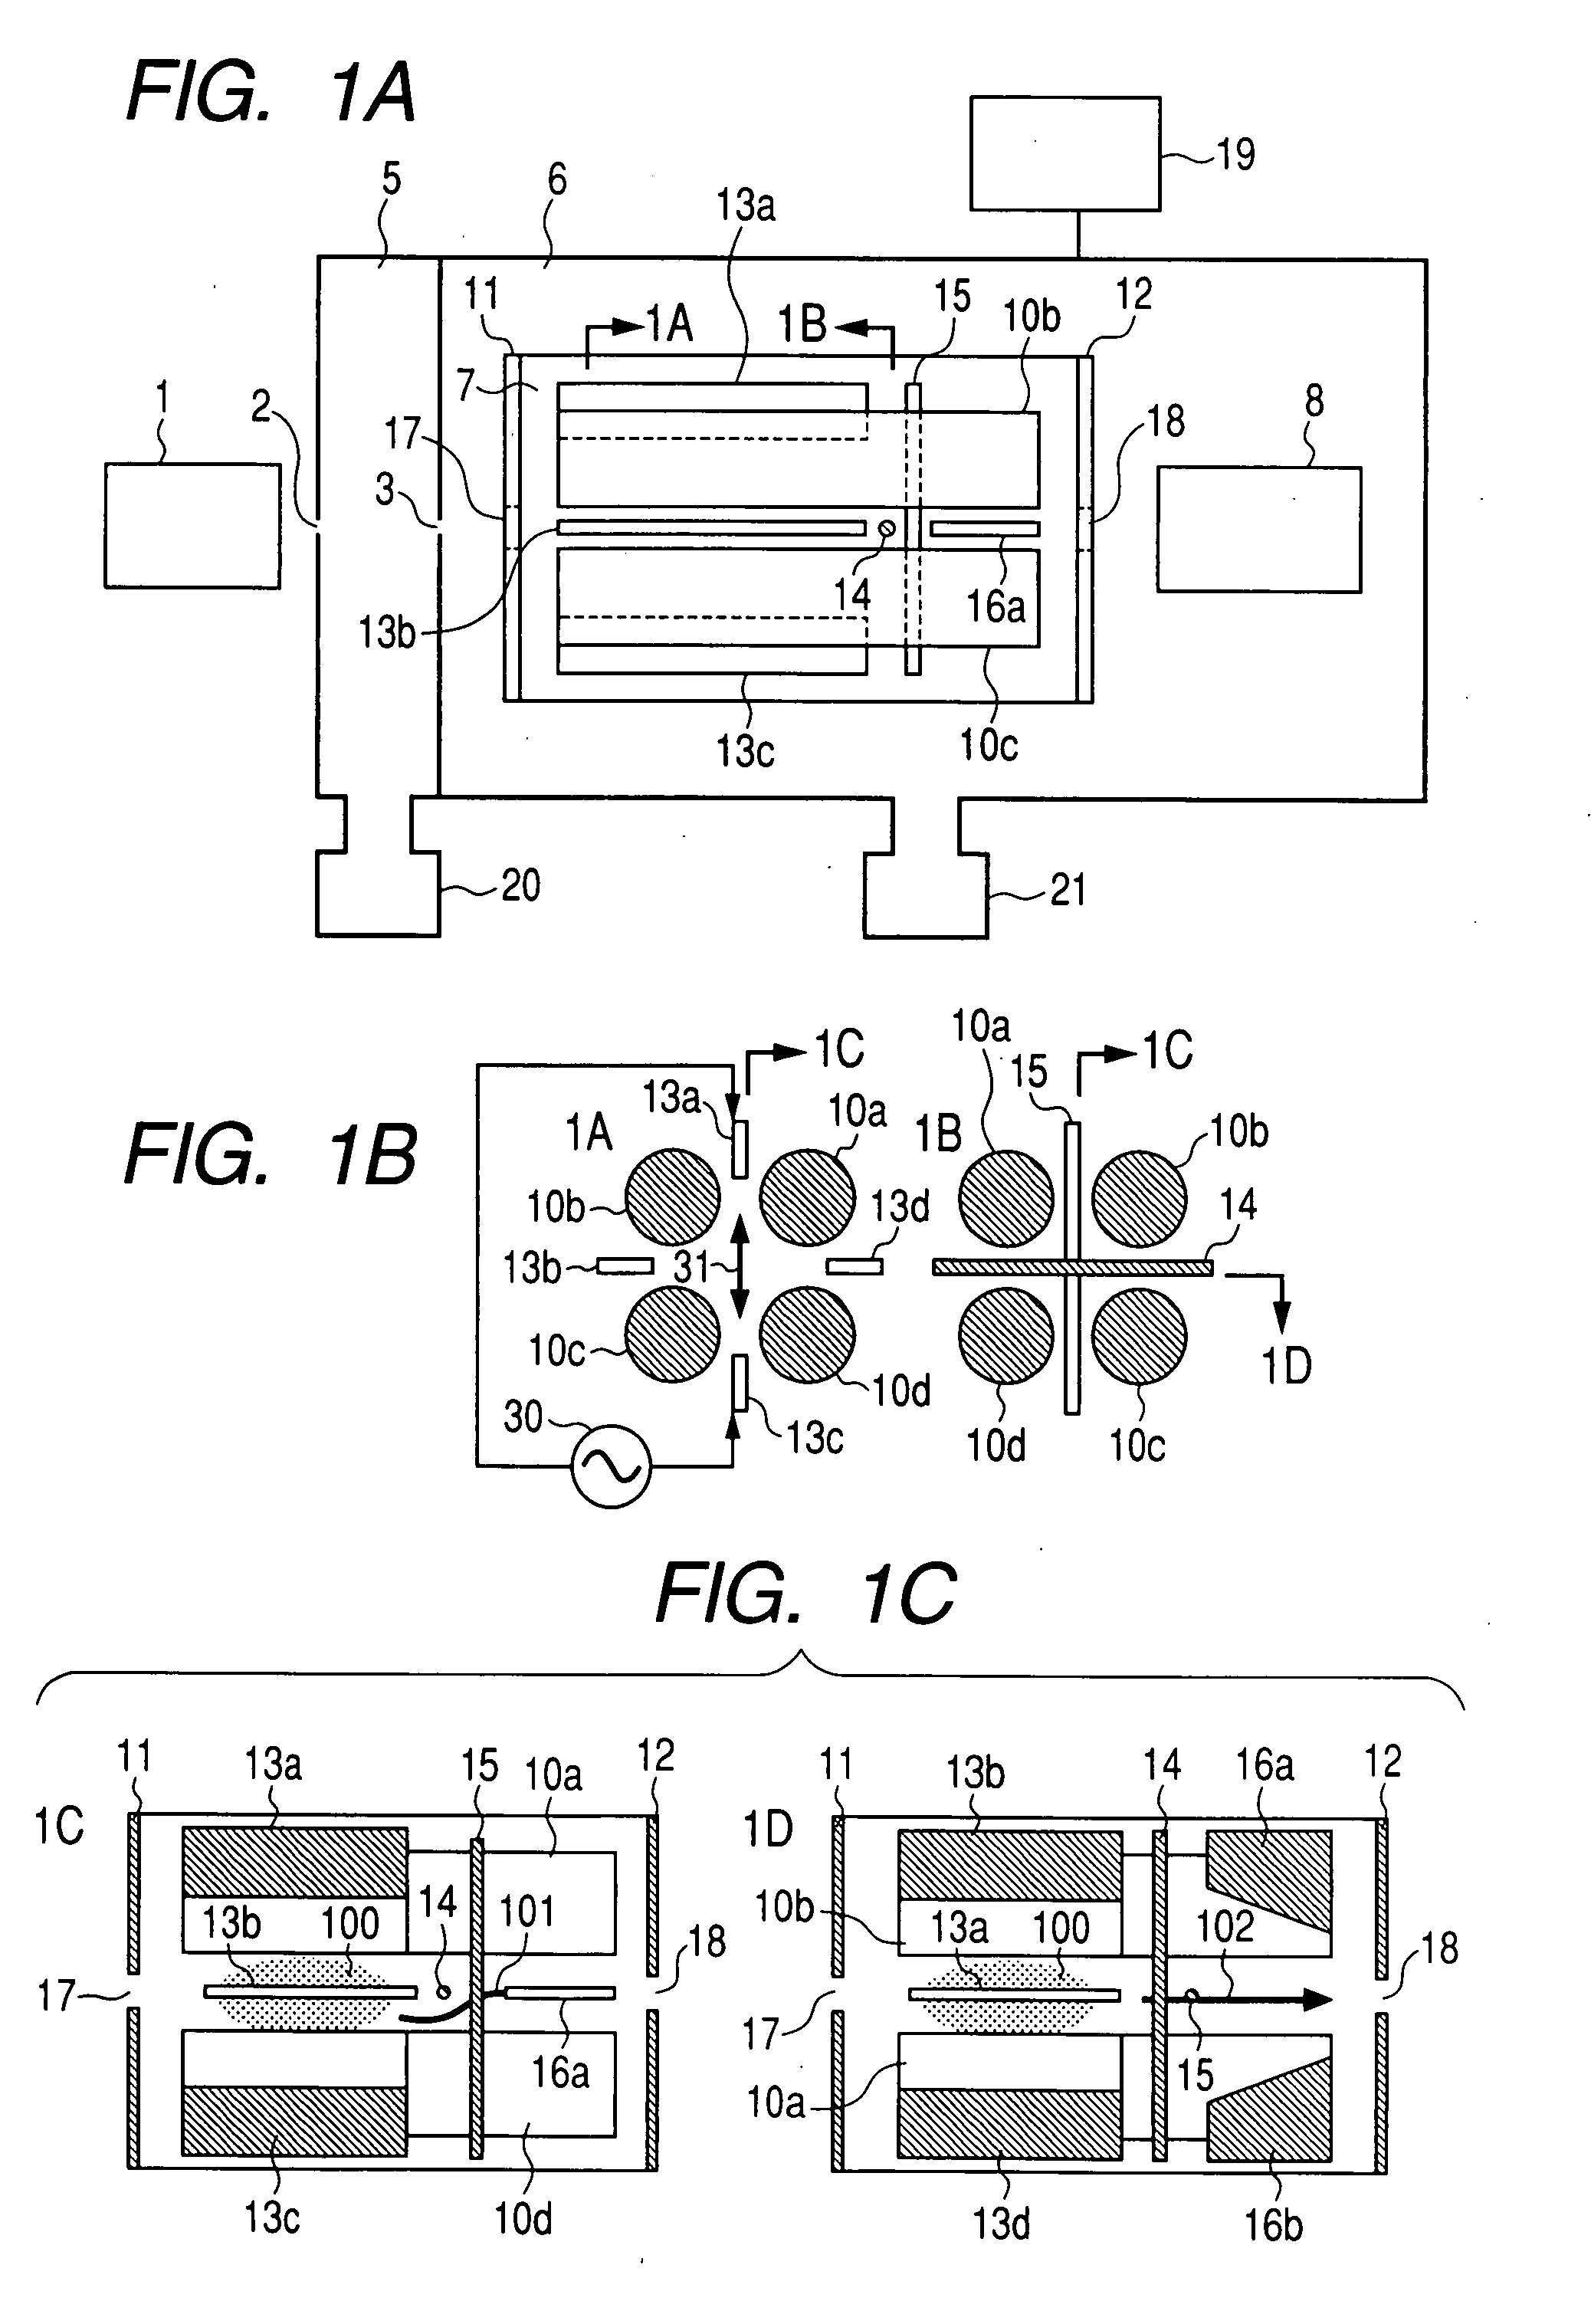
[0037]FIG. 1 is diagrams of the mass spectrometer of the method for this invention. FIG. 1A is a block diagram of the overall mass spectrometer. FIG. 1B is a cross sectional view of the device along the radial direction. FIG. 1C is a cross sectional view along the axis of the linear trap. FIGS. 1A, 1B, and 1C are cross sectional views as seen from the direction of the arrow. Ions generated in an ion source 1 such as an electro-spray ion source, atmospheric pressure chemical ionization source, atmospheric pressure photo-ionization source, atmospheric pressure matrix assisted laser desorption ionization source, matrix assisted laser desorption ionization source, are supplied via an aperture 2 into a differential exhaust portion 5. A pump 20 exhausts the differential exhaust portion. The ions from the differential exhaust portion pass through an aperture 3 and are supplied into an analyzer 6. The pump 21 exhausts the analyzer section to maintain it at a 10−4 Torr or lower (1.3×10⁻² Pa ...
second embodiment
[0051]FIG. 7 is diagrams of the mass spectrometer of this method. 7A in FIG. 7 shows a cross sectional view. The device structure up to the ions arriving at the mass analyzer unit and the structure from the mass analysis unit onward is the same as the first embodiment so a description is omitted here.
[0052]Linear trap operation is described first. During operation as a linear trap, buffer gas is supplied to the mass analyzer unit 7 and maintained at 10−4 Torr-10−2 Torr (1.3×10⁻² Pa−1.3 Pa). The trap lens 14 may utilize a thin-plated lens (electrode) or a wire-shaped lens (electrode). The wire-shaped lens possesses lower ion transmittance loss but the lens shape is more difficult to manufacture.
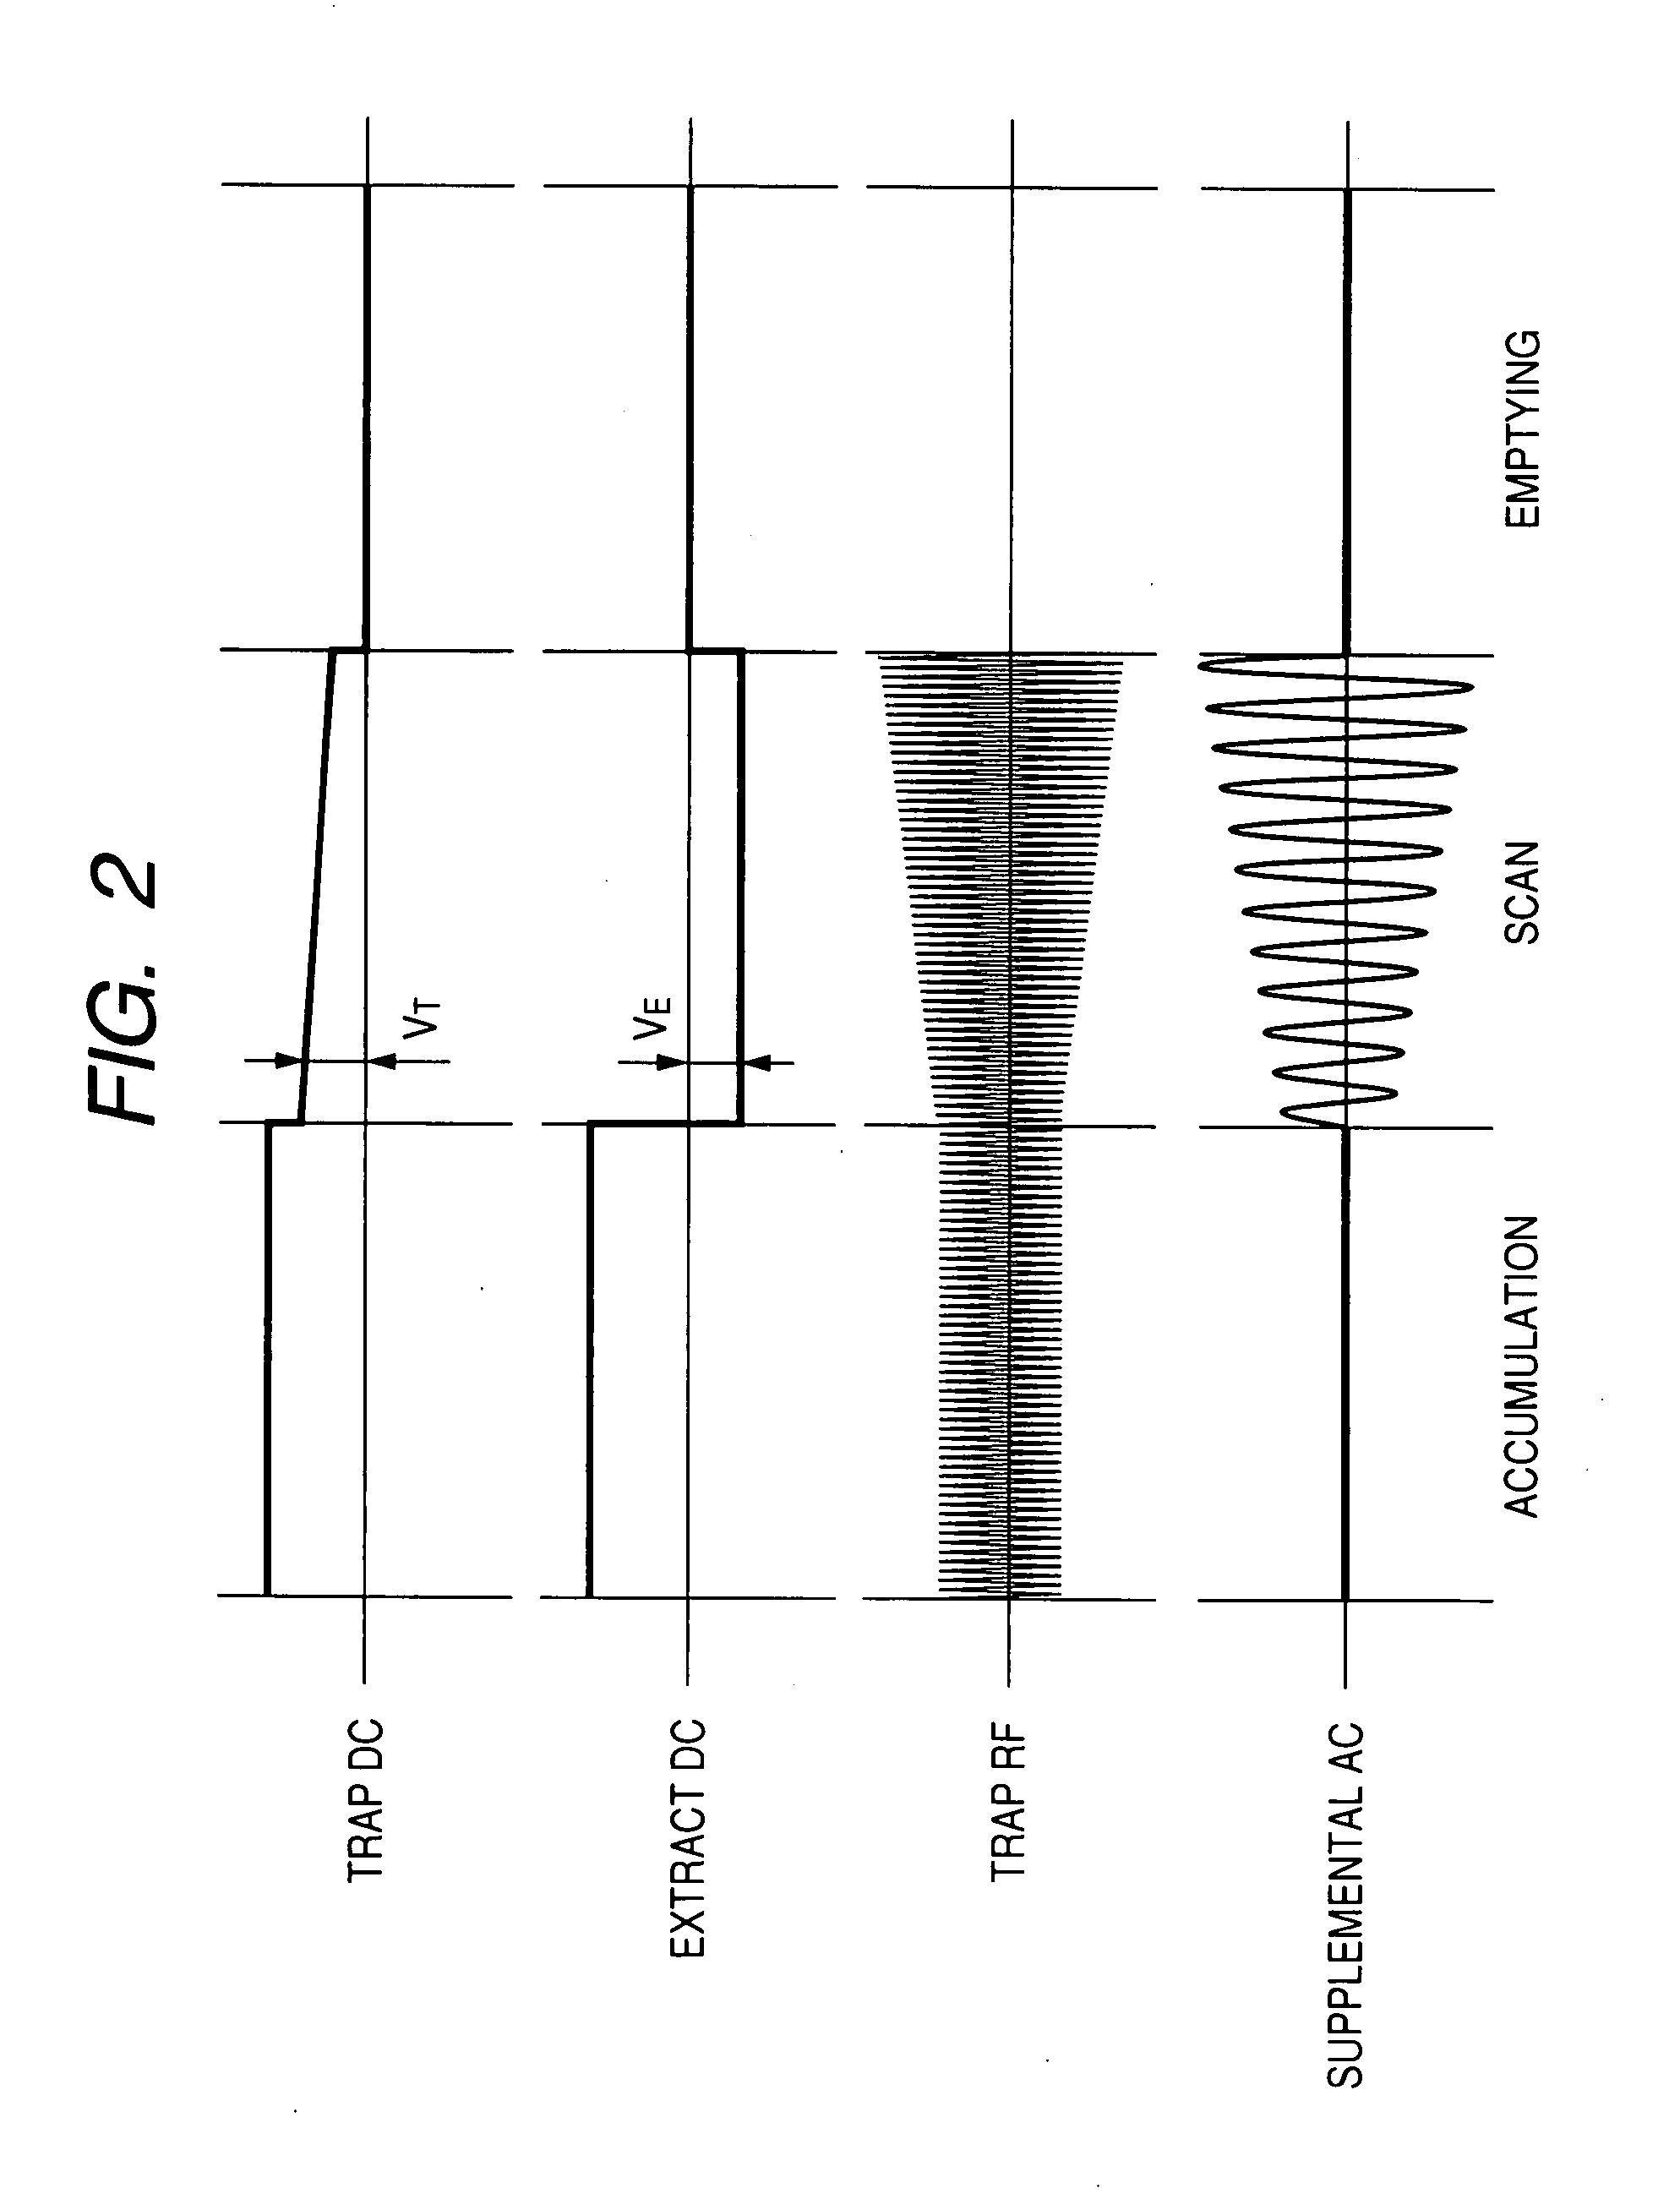
[0053]FIG. 8 shows the measurement sequence. Measurement was performed in three sequences. A trap RF voltage (amplitude 100 volts-5,000 volts, frequency 500 kHz-2 MHz) was applied to the quadrupole rod lens 10 during the trap period.
[0054]Typical voltages applied to the other lenses are; setti...
third embodiment
[0057]FIG. 9 is a structural diagram of the mass spectrometer of this method. 8A in FIG. 9 indicates a cross sectional view. The device structure up to the ions arriving at the mass analyzer unit and the device structure from the mass analysis unit onward is the same as the first embodiment so a description is omitted here.
[0058]Operating the spectrometer as a linear trap is described first. During operation as a linear trap, buffer gas is supplied to the mass analyzer unit 7 and maintained at 10−4 Torr-10−2 Torr (1.3×10⁻² Pa-1.3 Pa. The trap lens 14 may utilize a thin-plated lens (electrode) or a wire-shaped lens (electrode). The wire-shaped lens possesses lower ion transmittance loss but the lens shape is more difficult to manufacture. Except for the fact that the supplemental AC voltage is applied to the vane lens 13 and not the quadrupole rod lens 10, the measurement sequence of the third embodiment is identical to the measurement sequence of the second embodiment. Measurement i...
PUM
 Abstract
Description
Claims
Application Information
 - R&D
- Intellectual Property
- Life Sciences
- Materials
- Tech Scout
- Unparalleled Data Quality
- Higher Quality Content
- 60% Fewer Hallucinations
Browse by: Latest US Patents, China's latest patents, Technical Efficacy Thesaurus, Application Domain, Technology Topic, Popular Technical Reports.
© 2025 PatSnap. All rights reserved.Legal|Privacy policy|Modern Slavery Act Transparency Statement|Sitemap|About US| Contact US: help@patsnap.com


