
Apparatus and Method For Identifying Peaks In Liquid Chromatography/Mass Spectrometry And For Forming Spectra And Chromatograms

Active Publication Date: 2007-12-06
WATERS TECH CORP
View PDF3 Cites 55 Cited by
  • Summary
  • Abstract
  • Description
  • Claims
  • Application Information

AI Technical Summary

Benefits of technology

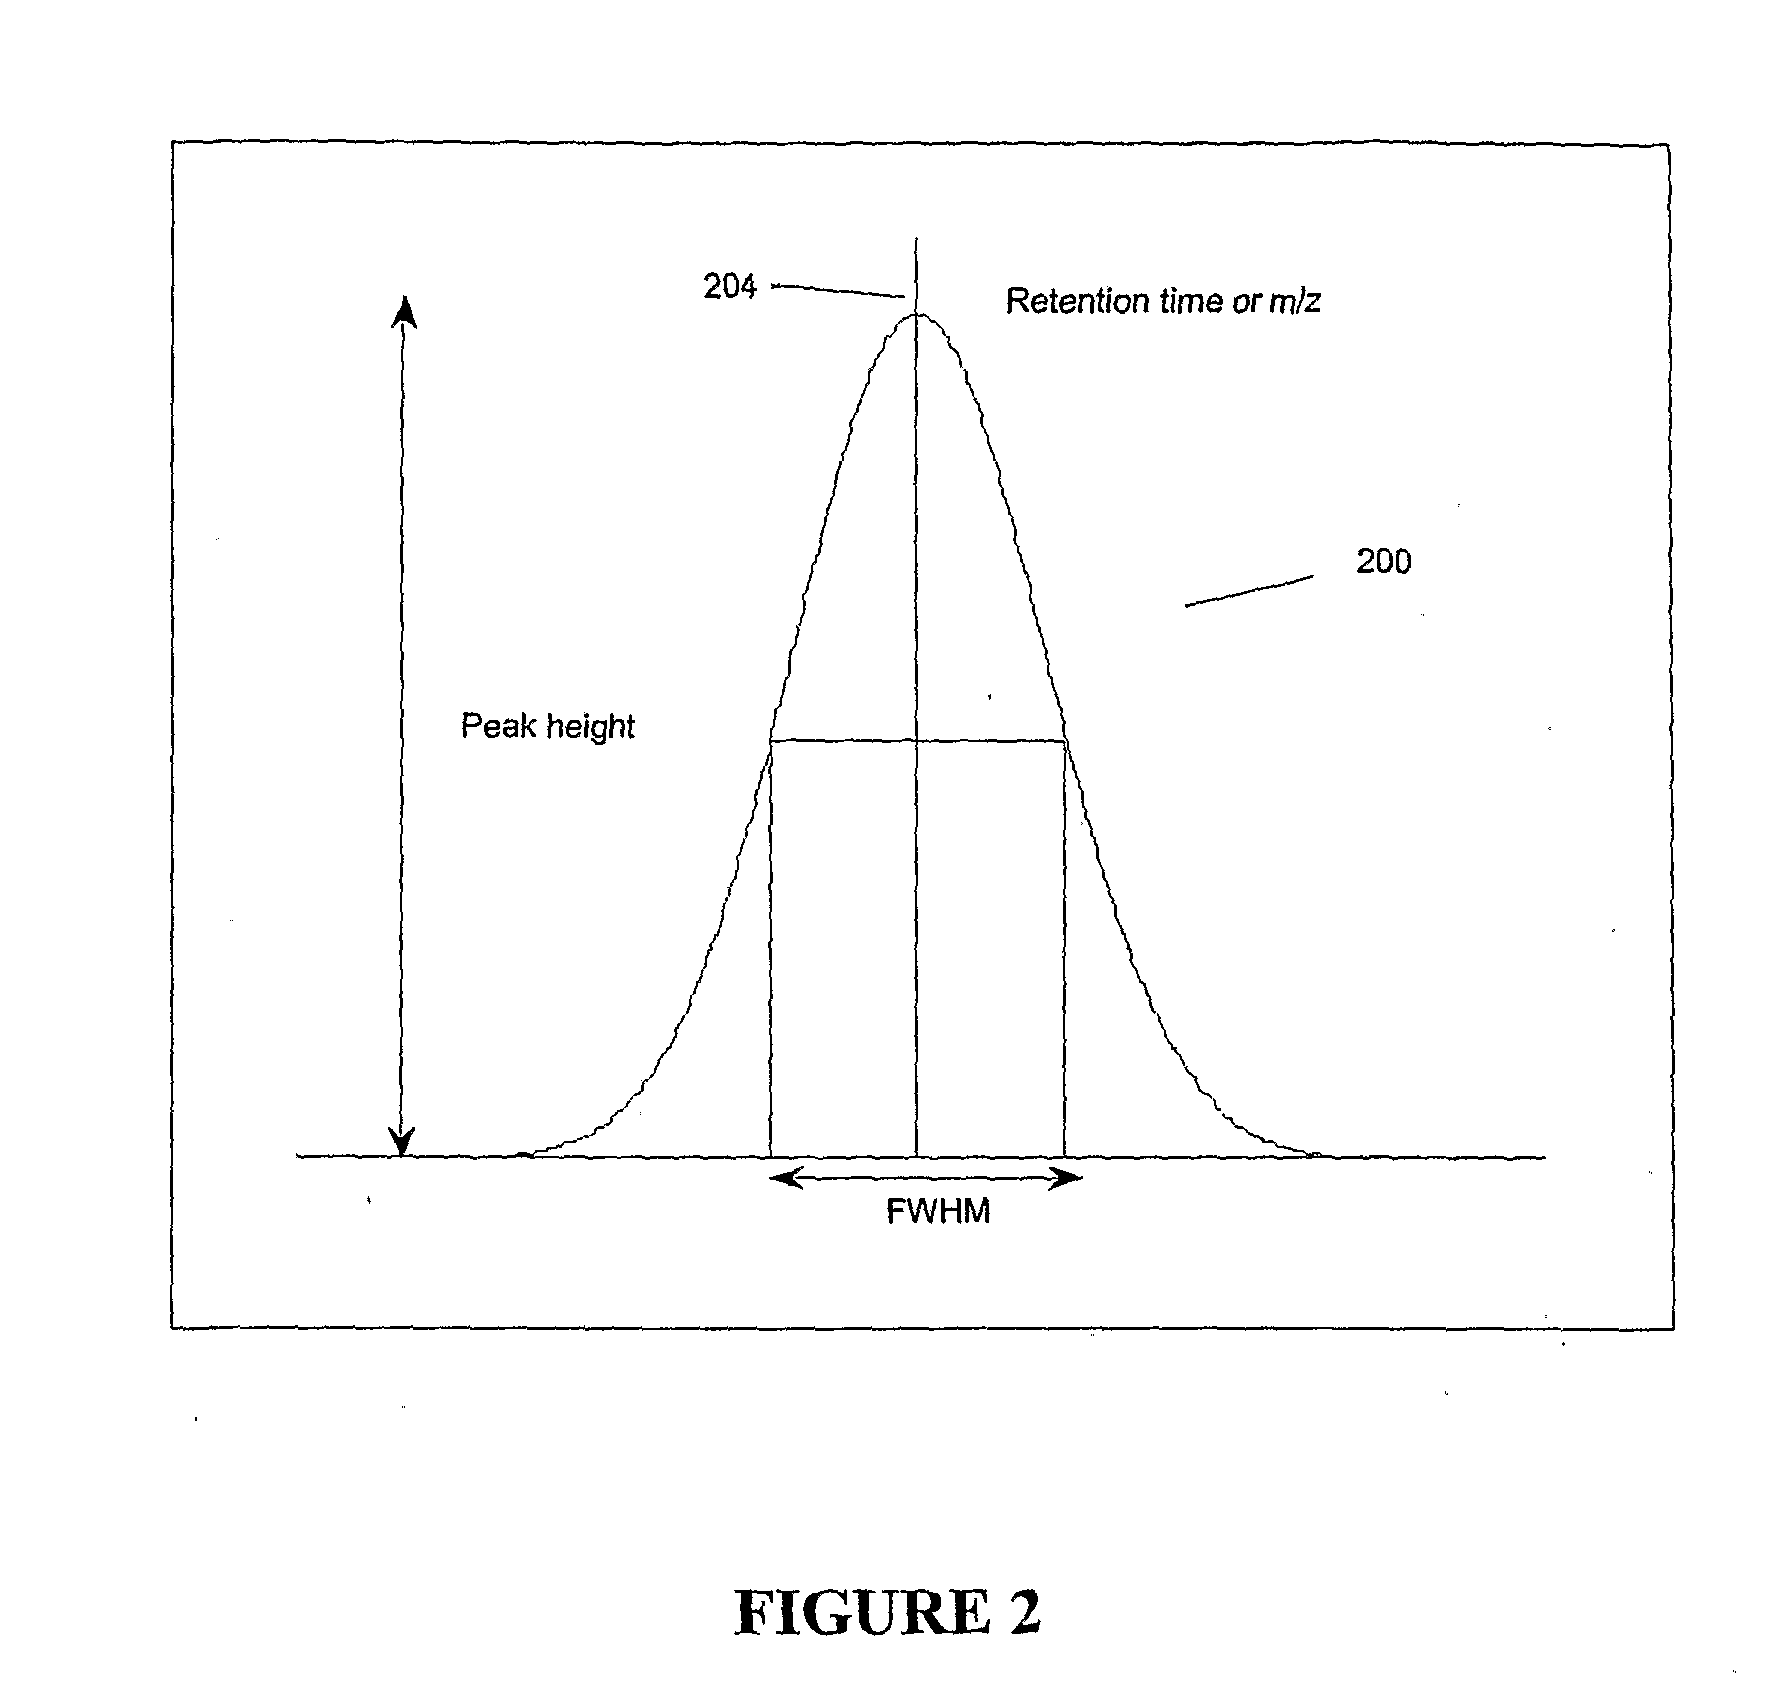
[0020] One aspect of embodiments of the present invention is to detect the ions measured in the spectral scans collected in an LC / MS system and to determine from these scans the retention time, mass-to-charge ratio, and intensity of each ion. Ion parameters, such as mass-to-charge ratio (m / z), retention time and intensity are accurately and optimally estimated by creating a data matrix and convolving the data matrix with a fast, linear, two-dimensional finite impulse response (FIR) filter to generate an output convolved matrix. A peak detection algorithm is applied to the output convolved matrix to identify peaks corresponding to ions in the sample. By analyzing the peaks detected in the filtered matrix, ion parameters such as retention time, mass-to-charge ratio (m / z) and intensity can be estimated and recorded. In addition, other peak parameters such as full width at half maximum (FWHM) in both the spectral and chromatographic directions can be estimated and stored.
[0022] Spectral and chromatographic complexity can be significantly reduced using embodiments of the present invention. For example, in embodiments of the present invention, a list or table of parameters associated with each detected ion is created and stored, rather than storing entire data sets associated with collected spectra or chromatographs.
[0026] Use of the present invention provides enhanced completeness, accuracy, and reproducibility of LC / MS experimental results by improving completeness, accuracy, and reproducibility of results obtained from a single injection. In addition, reduction in complexity further simplifies the interpretation of spectra and chromatograms due to the presence of fewer ions, reduction in noise background, and partial resolution of co-eluted compounds and interfering ions.

Problems solved by technology

Mass spectrometers are limited in terms of the number of ions they can reliably detect and quantify within a single spectrum.
As a result, samples containing many molecular species may produce spectra that are too complex for interpretation or analysis using conventional mass spectrometers.
Moreover, at low concentration, ion detection also suffers from the presence of background noise and / or the presence of interfering background molecules.
One problem with this method of detecting peaks in a TIC is possible co-elution of peaks from multiple molecules.
Another difficulty encountered with peak detection is detector noise.
Aside from these problems, additional difficulties are encountered when conventional peak detection algorithms are used to detect chromatographic or spectral peaks.
If performed manually, such conventional methods are not only subjective, but are also quite tedious.
Even when performed automatically, such methods can be subjective due to, for example, the subjective choices for thresholds to use to identify peaks.
Further, these conventional methods tend to be inaccurate because they analyze data using only a single extracted spectrum or chromatogram, and do not provide ion parameter estimates having the highest statistical precision or lowest statistical variance.
Finally, conventional peak-detection techniques do not necessarily provide uniform, reproducible results for ions at low concentration, or for complex chromatograms, where co-elution and ion interference tend to be common problems.

Method used


Image

  • Apparatus and Method For Identifying Peaks In Liquid Chromatography/Mass Spectrometry And For Forming Spectra And Chromatograms
  • Apparatus and Method For Identifying Peaks In Liquid Chromatography/Mass Spectrometry And For Forming Spectra And Chromatograms
  • Apparatus and Method For Identifying Peaks In Liquid Chromatography/Mass Spectrometry And For Forming Spectra And Chromatograms

Examples


Embodiment Construction

[0068] Embodiments of the present invention can be applied to a variety of applications including large-molecule, non-volatile analytes that can be dissolved in a solvent. Although embodiments of the present invention are described hereinafter with respect to LC or LC / MS systems, embodiments of the present invention can be configured for operation with other analysis techniques, including GC and GC / MS systems.

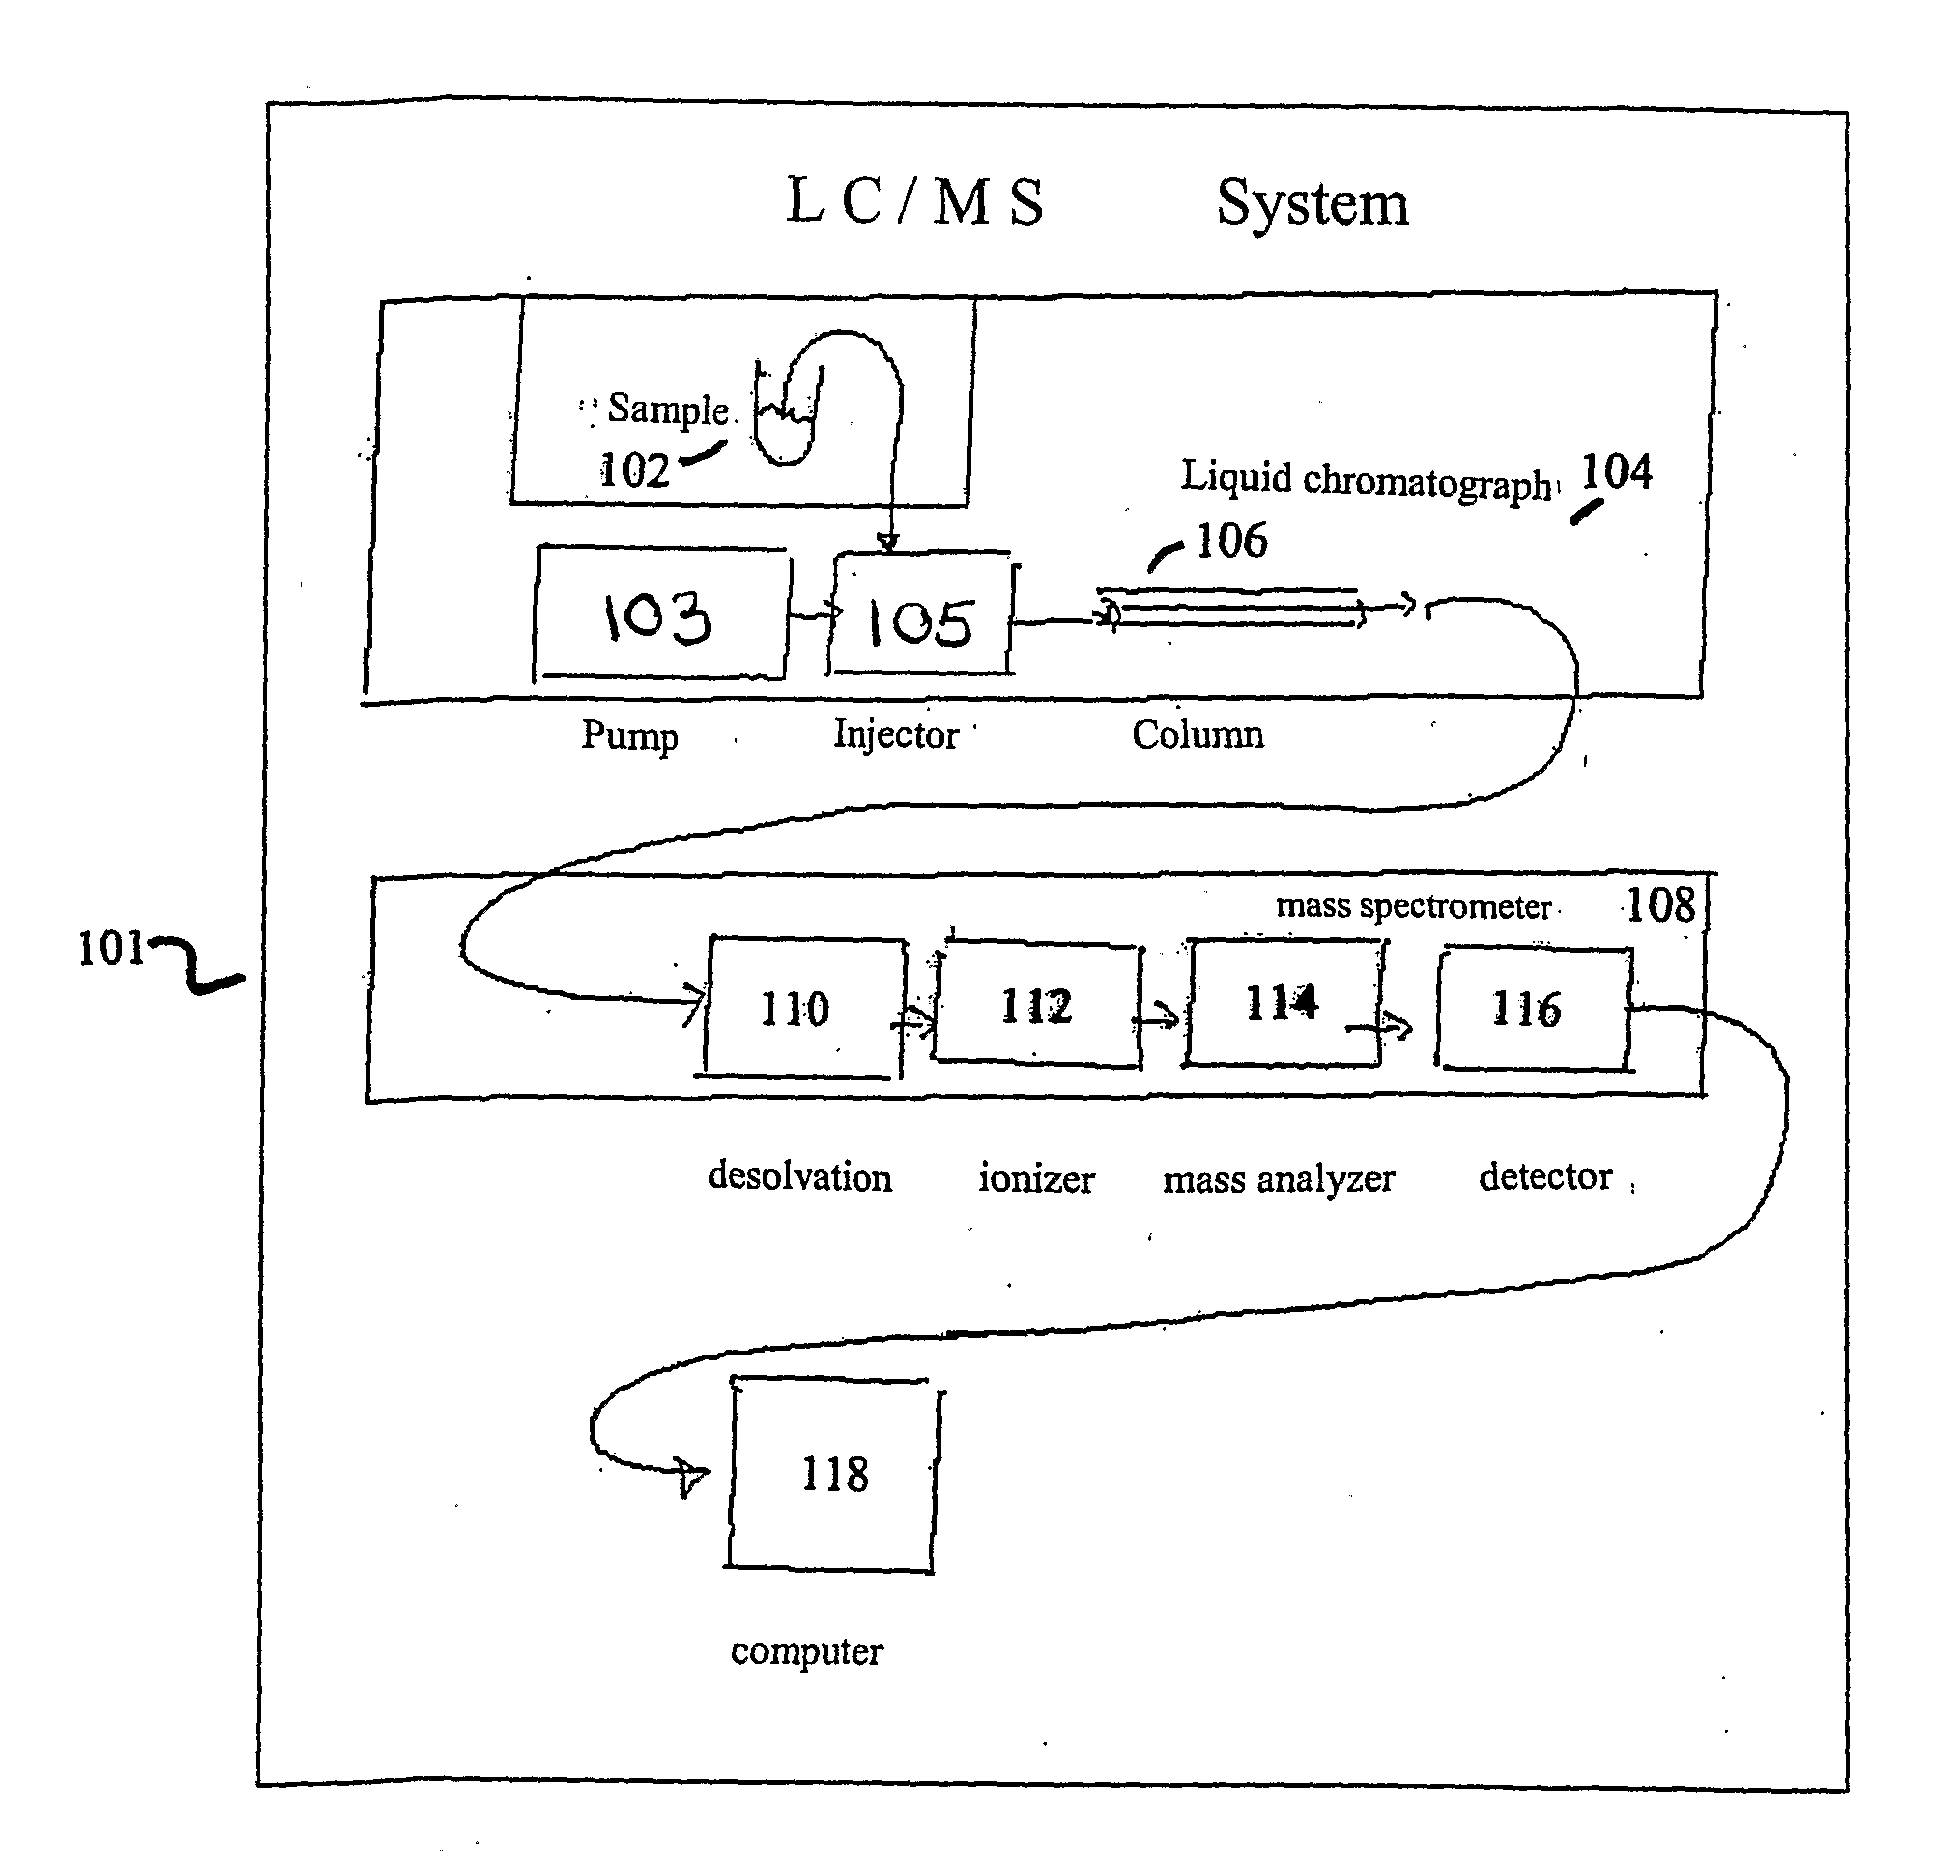
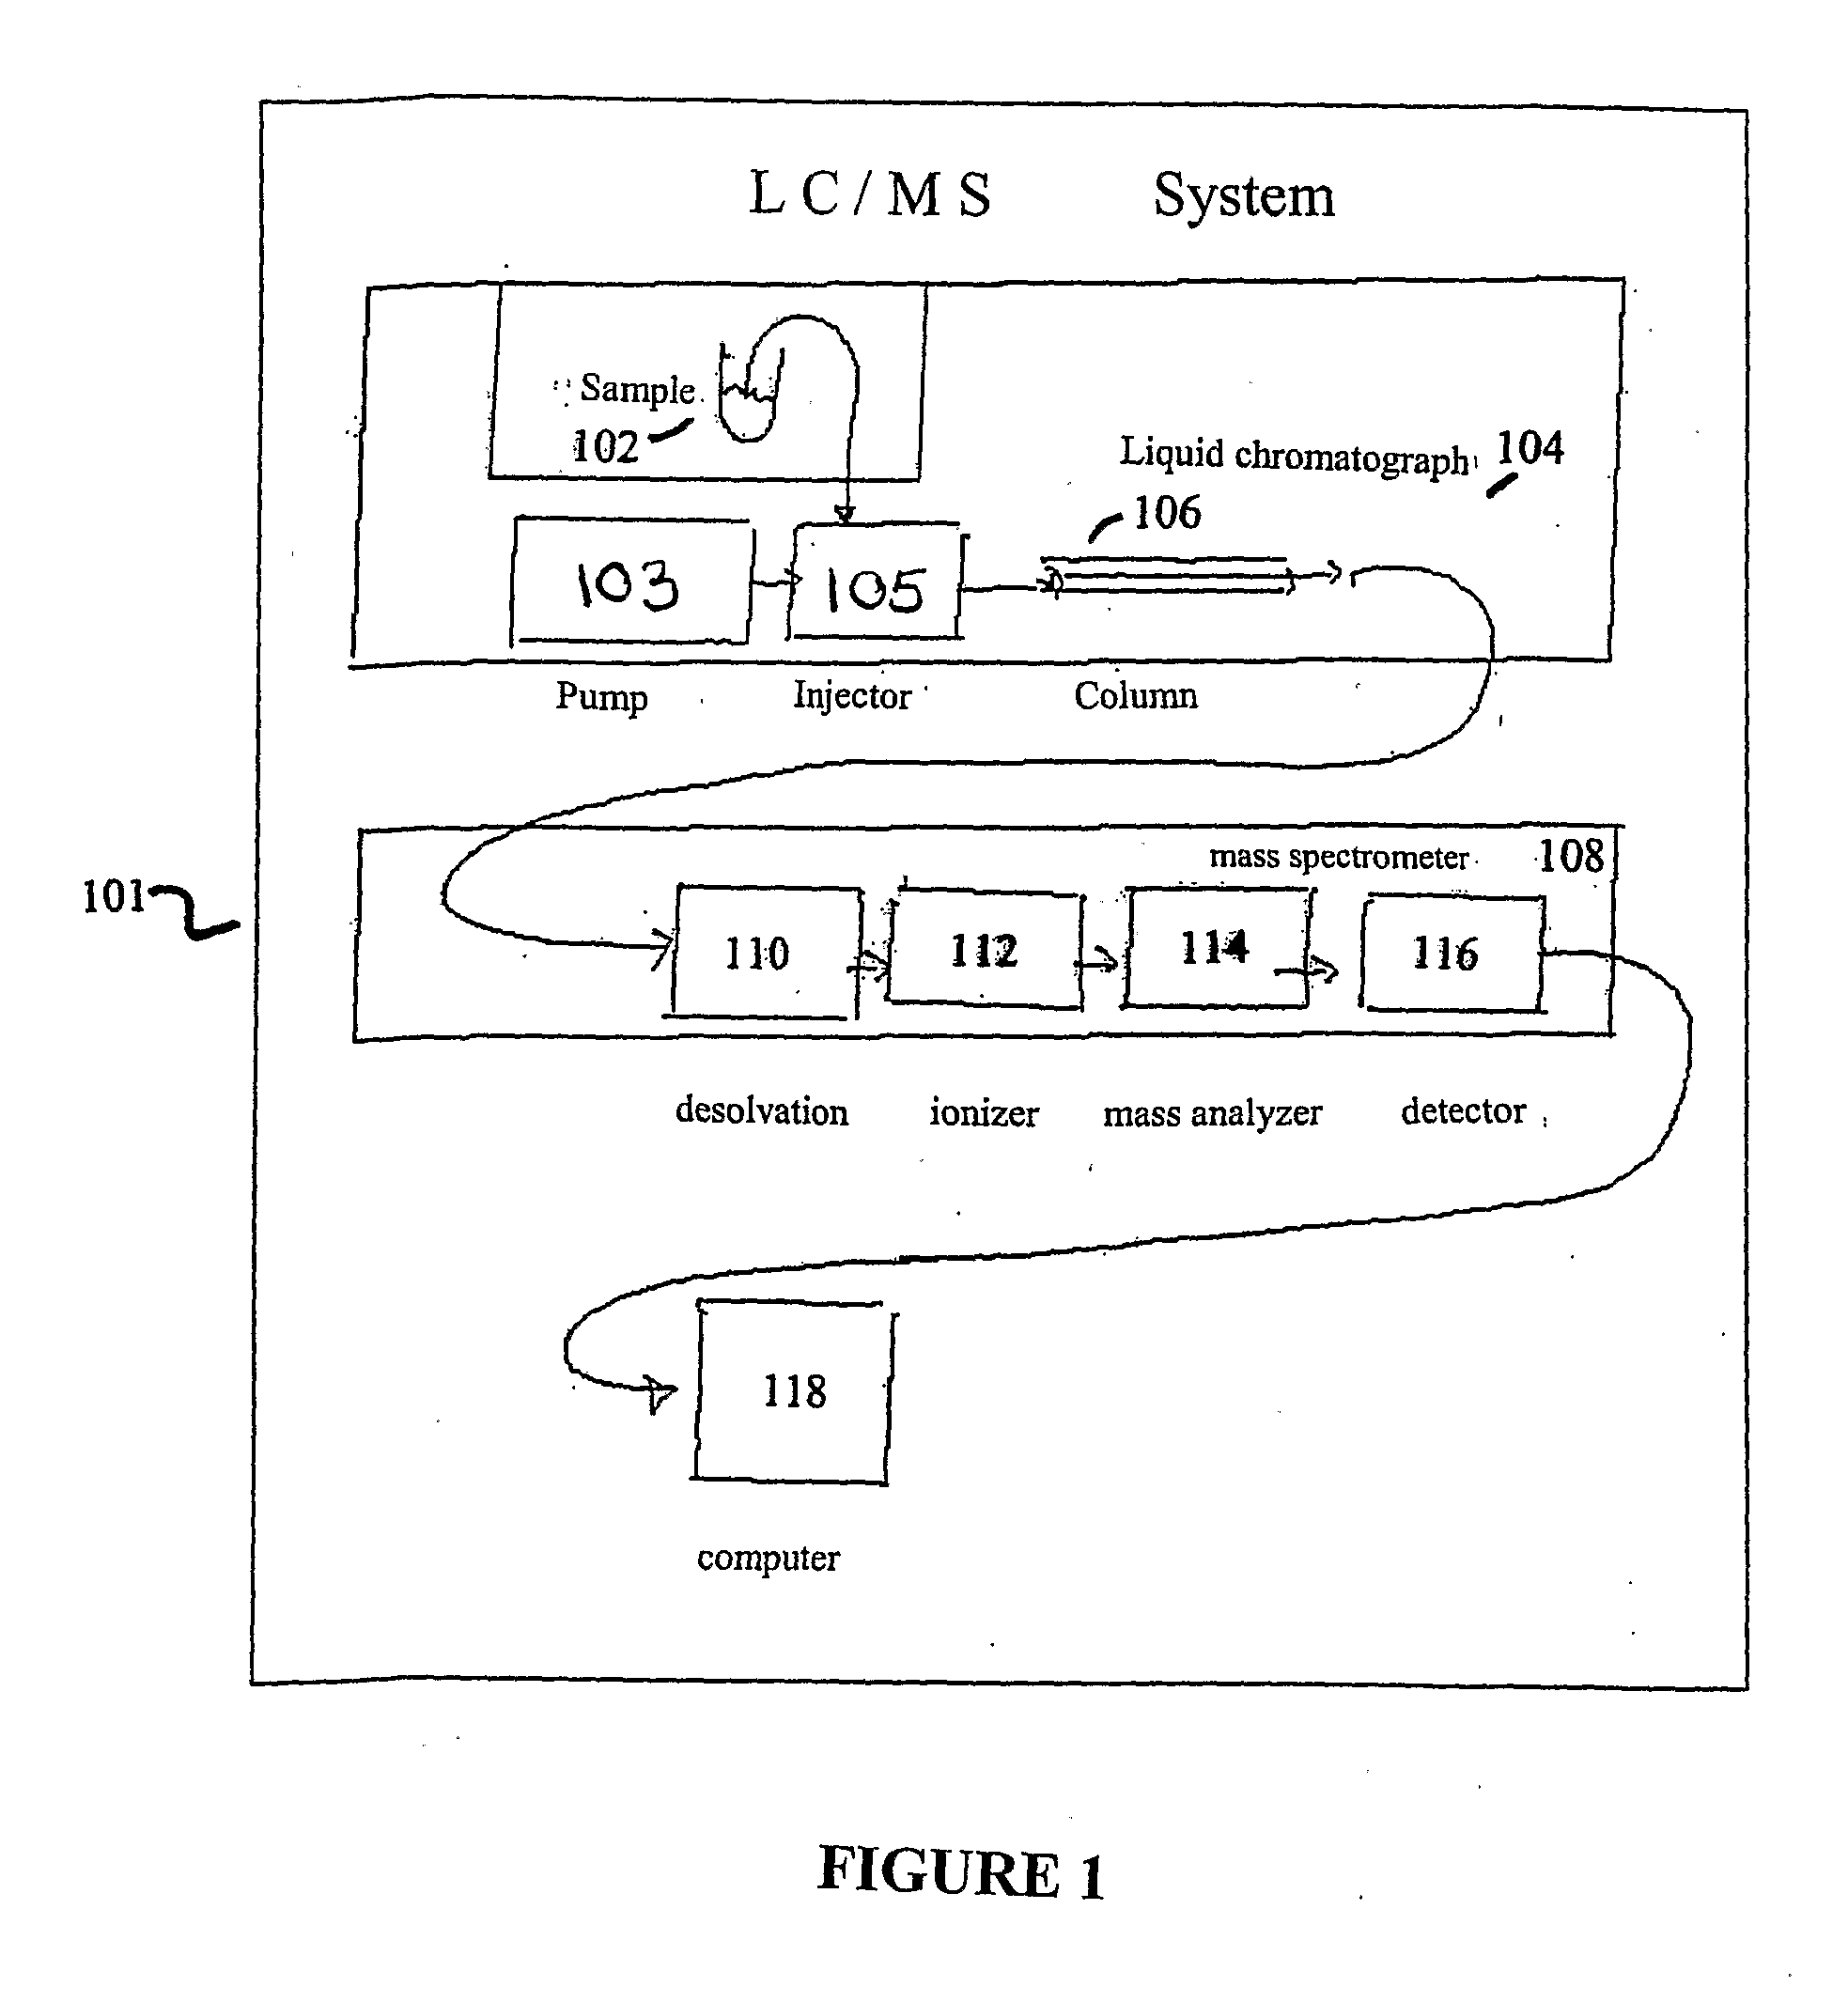
[0069]FIG. 1 is a schematic diagram of an exemplary LC / MS system 101 according to an embodiment of the present invention. LC / MS analysis is performed by automatically or manually injecting a sample 102 into a liquid chromatograph 104. A high pressure stream of chromatographic solvent provided by pump 103 and injector 105 forces sample 102 to migrate through a chromatographic column 106 in liquid chromatograph 104. Column 106 typically comprises a packed column of silica beads whose surface comprises bonded molecules. Competitive interactions between the molecular species in th...


PUM


Abstract

Chromatograms and mass spectra produced by an LC / MS system are analyzed by creating a two-dimensional data matrix of the spectral and chromatographic data. The two-dimensional matrix can be created by placing the spectra generated by the mass spectrometer portion of the LC / MS system in successive columns of the data matrix. In this way, the rows of the data matrix correspond to chromatographic data and the columns of the data matrix correspond to the spectra. A two-dimensional filter is specified and applied to the data matrix to enhance the ability of the system to detect peaks associated with ions. The two-dimensional filter is specified according to desired criteria. Rank-1 and rank-2 filters can be specified to improve computational efficiency. One method of applying the two-dimensional filter is through convolution of the data matrix with the two-dimensional filter to produce an output data matrix. Peaks corresponding to detected ions are identified in the output data matrix. Parameters of the peaks are determined and stored for later processing including quantitation, or simplification of chromatograms or spectra by, for example, identifying peaks associating with ions having retention times falling within a specified retention time window or having mass-to charge ratios falling within a specified mass-to-charge ratio window.

Description

[0001] The present invention claims the benefit of priority of U.S. Provisional Application 60 / 543,940, filed Feb. 13, 2004, which is hereby incorporated by reference in its entirety.[0002] A portion of the disclosure of this patent document contains material which is subject to copyright protection. The copyright owner has no objection to the facsimile reproduction by anyone of the patent document or patent disclosure, as it appears in the Patent and Trademark Office patent file or records, but otherwise reserves all copyright rights whatsoever. BACKGROUND [0003] 1. Field of the Invention [0004] The present invention relates generally to liquid chromatography and mass spectrometry. More particularly, the present invention relates to detection and quantification of ions from data collected by an LC / MS system and subsequent or real-time analysis of such data. [0005] 2. Background of the Invention [0006] Mass spectrometers (MS) are well-known scientific instruments used widely for ide...

Claims


Application Information

Patent Timeline
IPC IPC(8): B01D59/44G01N30/72G01N30/86G06K9/00
CPCG01N30/7233G01N30/8617H01J49/022G01N30/8689G06K9/00523G01N30/8675G06F2218/08
Inventor GORENSTEIN, MARC V.PLUMB, ROBERT S.STUMPF, CHRIS L.
Owner WATERS TECH CORP
Learn More