Waveform compression and display

a waveform and display technology, applied in the field of waveform compression and display, can solve the problems of loss of low frequency information, excessive data quantity, and limited usable compression schemes

Active Publication Date: 2007-09-20
TEKTRONIX INC
View PDF15 Cites 32 Cited by
  • Summary
  • Abstract
  • Description
  • Claims
  • Application Information

AI Technical Summary

Benefits of technology

[0018] Accordingly the present invention provides a waveform compression and display technique that saves both a peak detected version (“background” version) and a decimated and/or lowpass filtered version (“foreground” version) of a sampled electrical signal. The two versions are displayed simultaneously in such a contrasting manner so as not to obscure information contained in either of them. The foreground version may use just decimation or may use a series of simple lowpass filters with decimation to produce a single data stream from a plurality of data streams derived from the sampled electrical signal, the amount of lowpass filtering being adjustable from none to a maximum desired level. The single data stream may then be subjected to additional filtering to obtain a desired frequency bandwidth. When displayed simultaneously as overlaid...

Problems solved by technology

When observing long periods of time, the quantity of data may exceed the memory available.
Usable compression schemes are limited because the data arrives at a very high rate.
In the presence of high frequency signals the low frequency information is lost.
Each of these schemes has serious drawbacks, as described in more detail below.
A very high sample rate is achieved, but this creates the problem of how to manage the vast amount of data that is generated in very short periods of time.
However oscilloscope users want to examine electrical signals over long periods of time and, no matter how large the memory depth, the amount of data vastly exceeds the memory depth.
However decimation is not a very good compression scheme since, for example, narrow pulses that may be very important are often discarded.
It also makes this form of compression “dishonest” because the low frequency signals seen may not really be there.
However this ...

Method used


Image

  • Waveform compression and display
  • Waveform compression and display
  • Waveform compression and display

Examples


Embodiment Construction

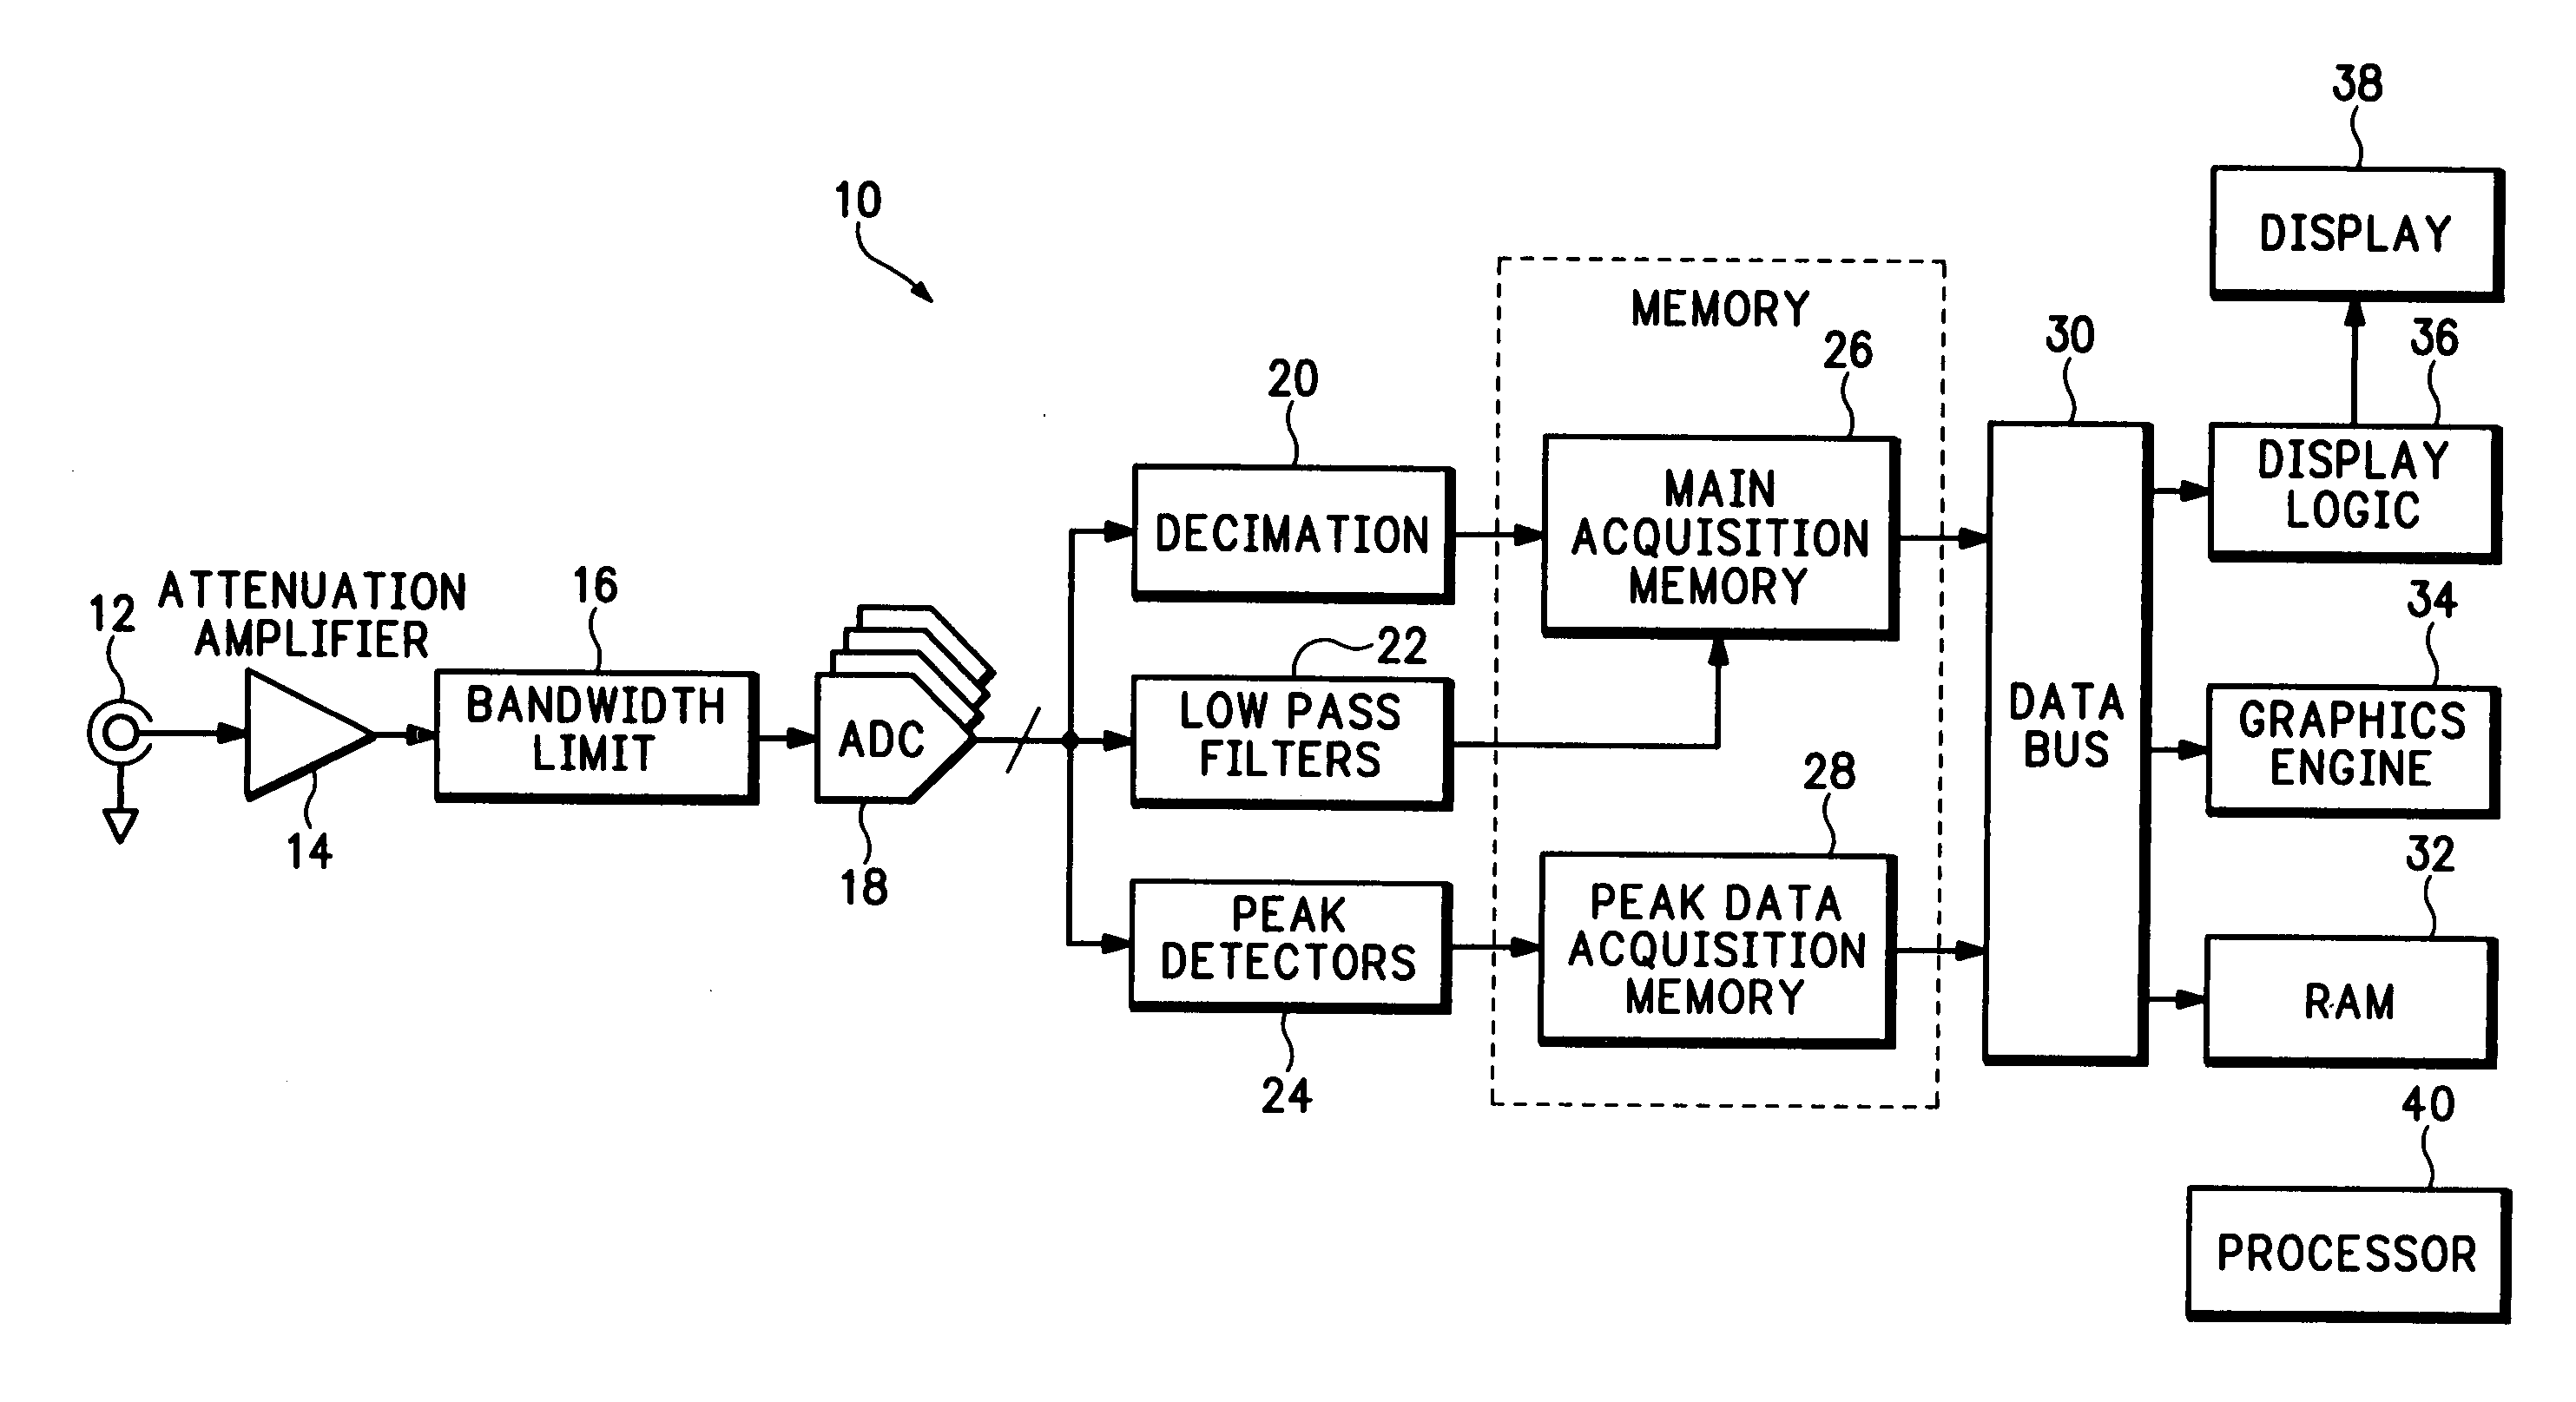
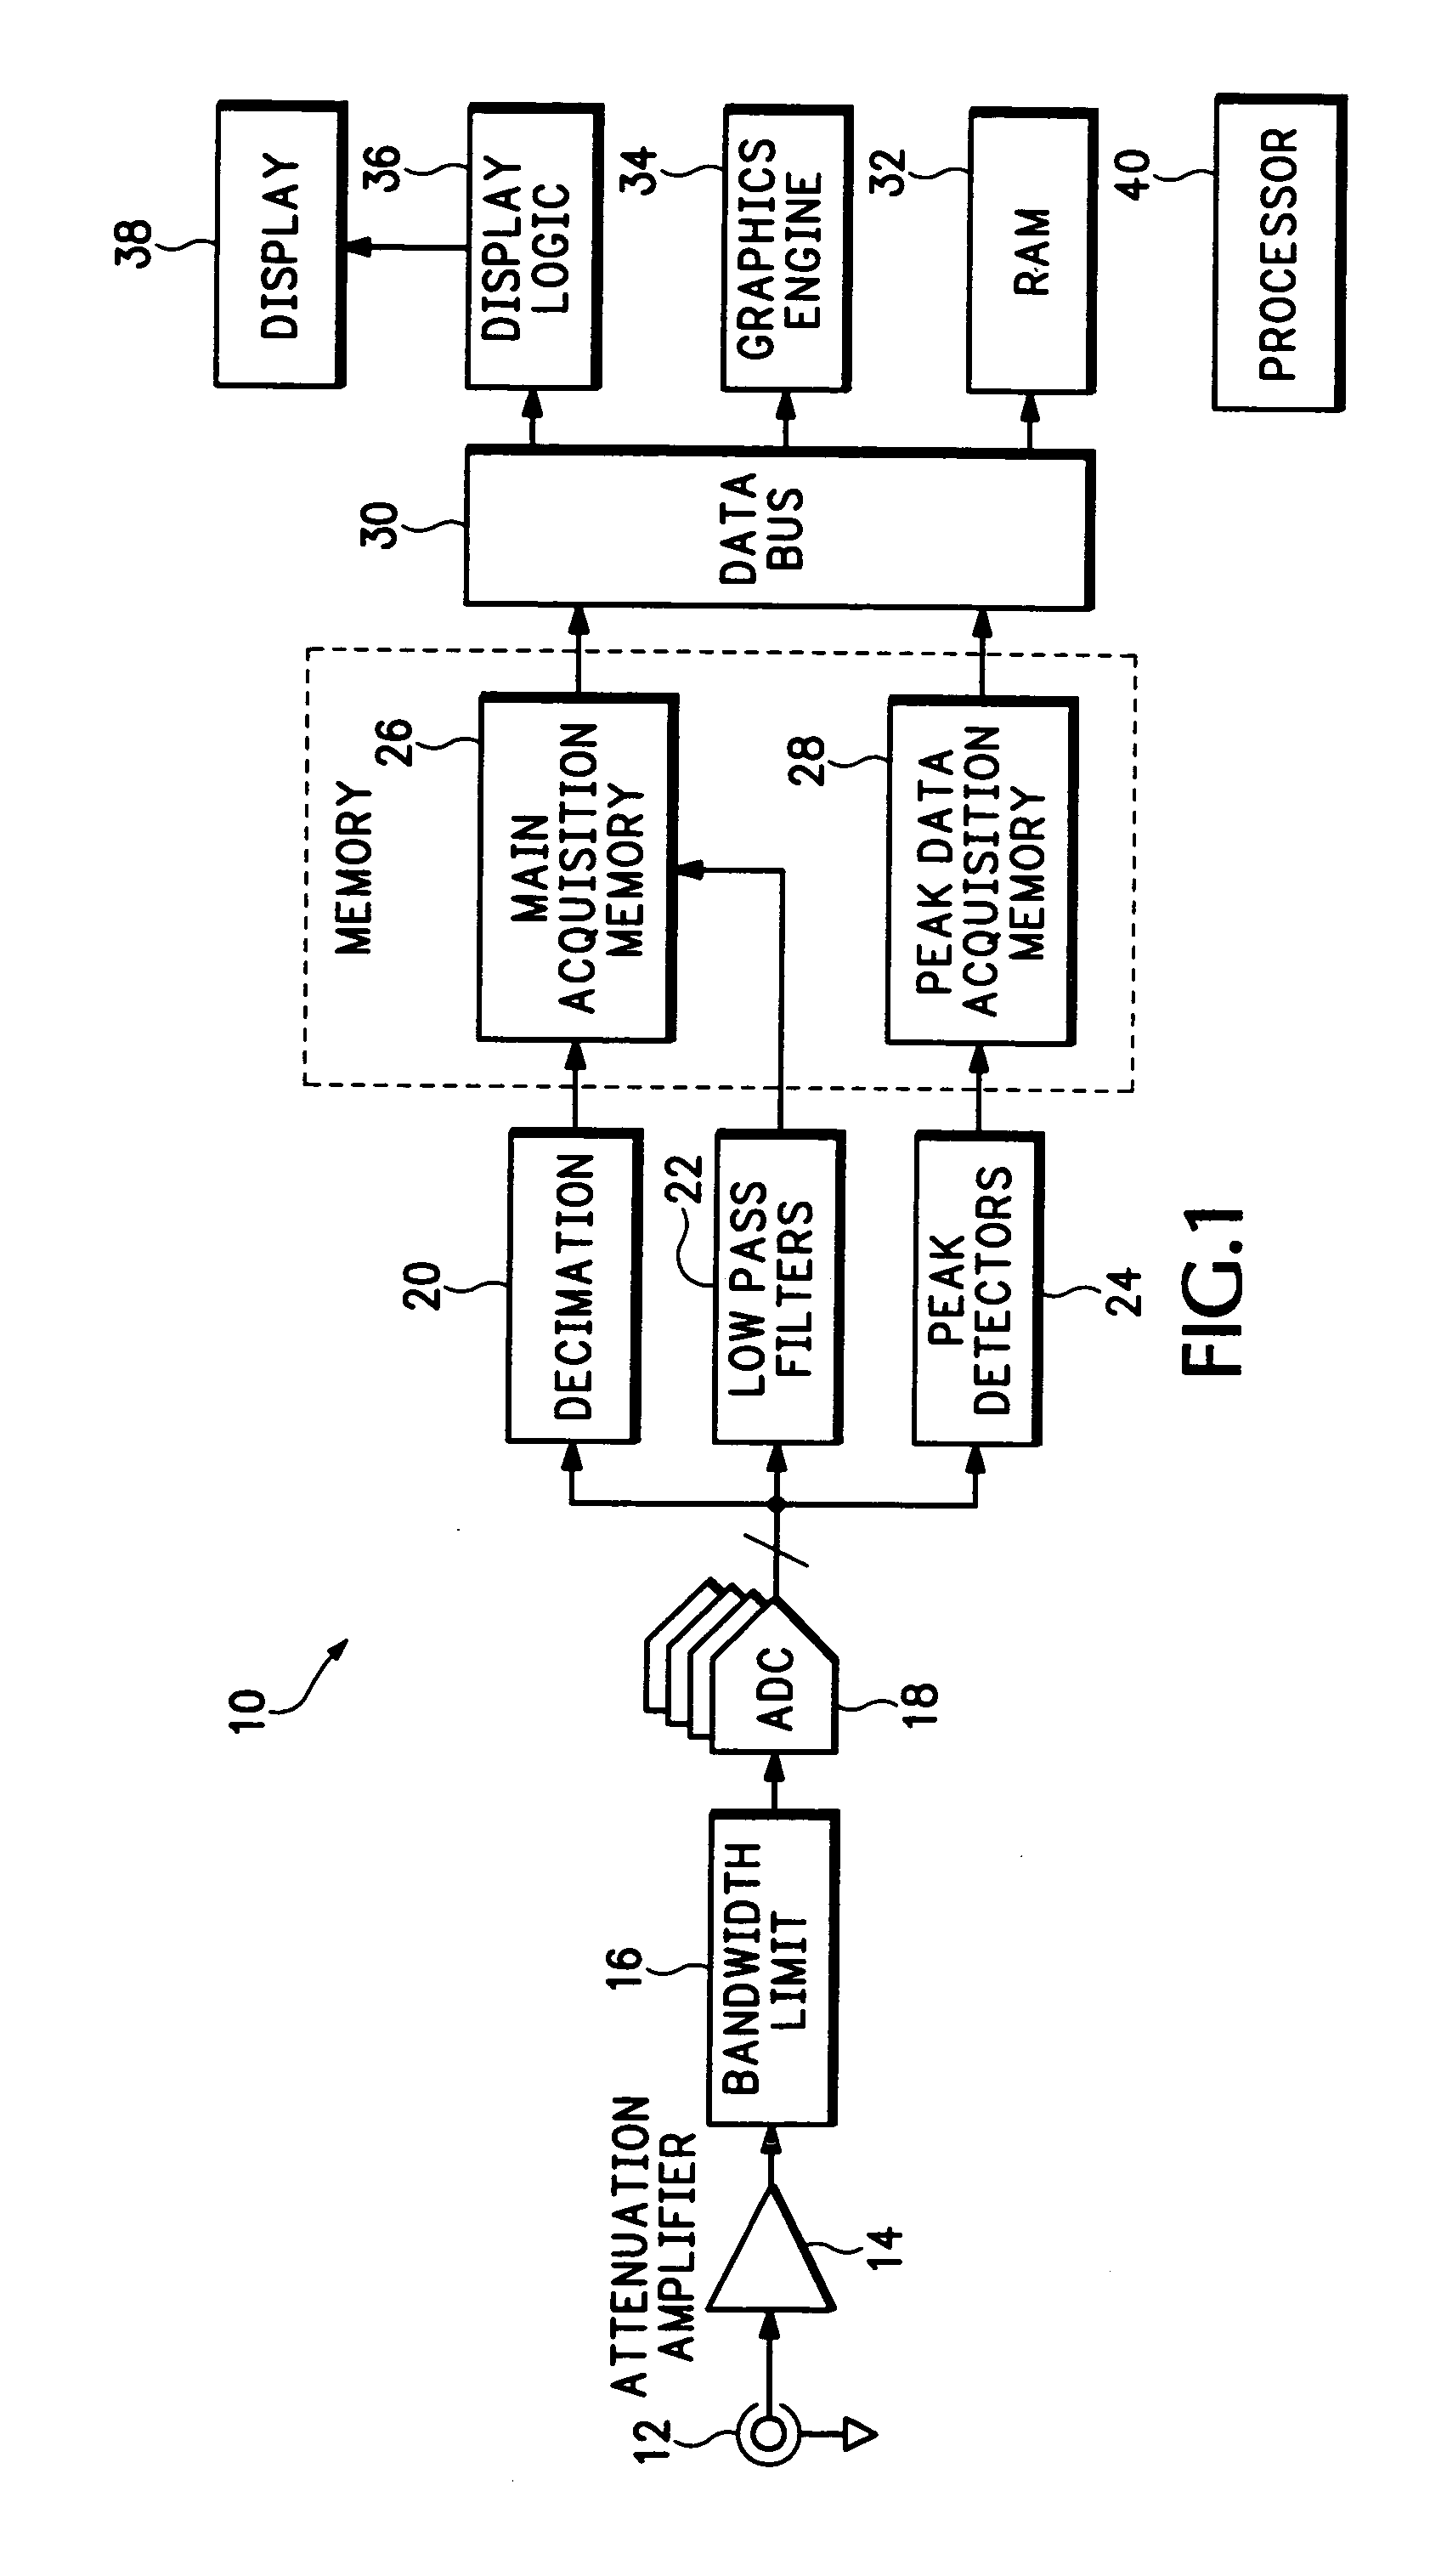
[0031] Referring now to FIG. 1 a digital oscilloscope 10 is shown having an input port 12 for receiving an electrical signal. The electrical signal from the input port 12 is input to an attenuator amplifier 14, a bandwidth limiter 16 and one or more analog-to-digital converters (ADCs) 18. The resulting digitized electrical signal in the form of data samples is input to three different compression modules in parallel —a conventional decimator 20, lowpass filters 22 and a peak detector 24. The decimated and lowpass filtered data samples from the decimator 20 and lowpass filters 22 are stored in a main acquisition memory 26, and the peak detect data samples from the peak detector 24 are stored in a peak data acquisition memory 28. The main acquisition memory 26 and the peak data acquisition memory 28 physically may be part of the same memory, as is well known in the art. Also the peak data acquisition memory 28 may be shorter in length than the main acquisition memory 26. The data samp...


PUM


Abstract

A waveform compression and display technique saves both a peak detected version (background version) and a decimated/lowpass filtered version (foreground version) of a sampled electrical signal. The two versions are displayed simultaneously overlaid together in a contrasting manner so as not to obscure information contained in either of them. The lowpass filtered version uses a series of simple lowpass filters with decimation to produce a single data stream from a plurality of data streams derived from the sampled electrical signal. The single data stream may then be subjected to additional filtering, such as a cascaded integrator-comb filter, to obtain a desired frequency bandwidth. When displayed, the peak detect pixels adjacent the decimated/lowpass filtered pixels may be adjusted in intensity so that the low frequency information of the lowpass filtered waveform is not lost, while the peak detect pixels further from the lowpass filtered pixels are intensified to highlight the high frequency information. Alternatively the background version intensity may be controlled by a user control over a first range from zero to a predetermined maximum, and the foreground version may be controlled over a second range from a default intensity to a maximum, saturated intensity.

Description

BACKGROUND OF THE INVENTION [0001] The present invention relates to electrical signal waveform measurement and display, and more particularly to a method of waveform compression and display. [0002] In digital oscilloscopes waveform data is sampled rapidly and stored in a memory. When observing long periods of time, the quantity of data may exceed the memory available. When this happens some information needs to be discarded. Therefore the sampled data needs to be compressed before being stored in the memory. Usable compression schemes are limited because the data arrives at a very high rate. The most common compression schemes are: [0003] Decimation. This compression scheme aliases high frequency information and misses narrow pulses. [0004] Peak Detection. In the presence of high frequency signals the low frequency information is lost. [0005] HiRes Filtering. Some high frequency information is aliased and narrow pulses are filtered out. Each of these schemes has serious drawbacks, ...

Claims


Application Information

Patent Timeline
IPC IPC(8): G06K9/36
CPCG01R13/0272
Inventor SULLIVAN, STEVEN K.GERLACH, PAUL M.VEITH, KRISTIEDOBYNS, KENNETH P.
Owner TEKTRONIX INC
Why Eureka
Try Eureka