Analysis of signal oscillation patterns

a signal oscillation pattern and analysis technology, applied in the field of analysis of signal oscillation patterns, to achieve the effect of facilitating the differentiation of segments of original fringe pattern data

Inactive Publication Date: 2007-03-01
TSI INC
View PDF2 Cites 8 Cited by
  • Summary
  • Abstract
  • Description
  • Claims
  • Application Information

AI Technical Summary

Benefits of technology

[0013] Based on the sensed peak frequencies, fringe patterns are located by generating a plot or profile of the peak frequencies in a frequency-space or frequency-time domain. Rejected points are assigned a frequency of zero. Because the frequency of fringe patterns is substantially uniform, each fringe pattern appears on the plot or profile as a horizontal (zero slope) line, corresponding in length to the location or duration of the associated fringe pattern. This accurately positions the fringes along the space (or time) axis, and facilitates distinguishing segments of the original fringe pattern data, one segment associated with each fringe pattern, to be extracted from the original data.

Problems solved by technology

A problem arises with the aforementioned sizing and velocity techniques when the population density of a particle or droplet field is high enough to cause frequent overlapping of corresponding fringe patterns.
An error results in the fringe count (and therefore the size determination) as well as in the frequency and position determination of the corresponding particles.

Method used


Image

  • Analysis of signal oscillation patterns
  • Analysis of signal oscillation patterns
  • Analysis of signal oscillation patterns

Examples


Embodiment Construction

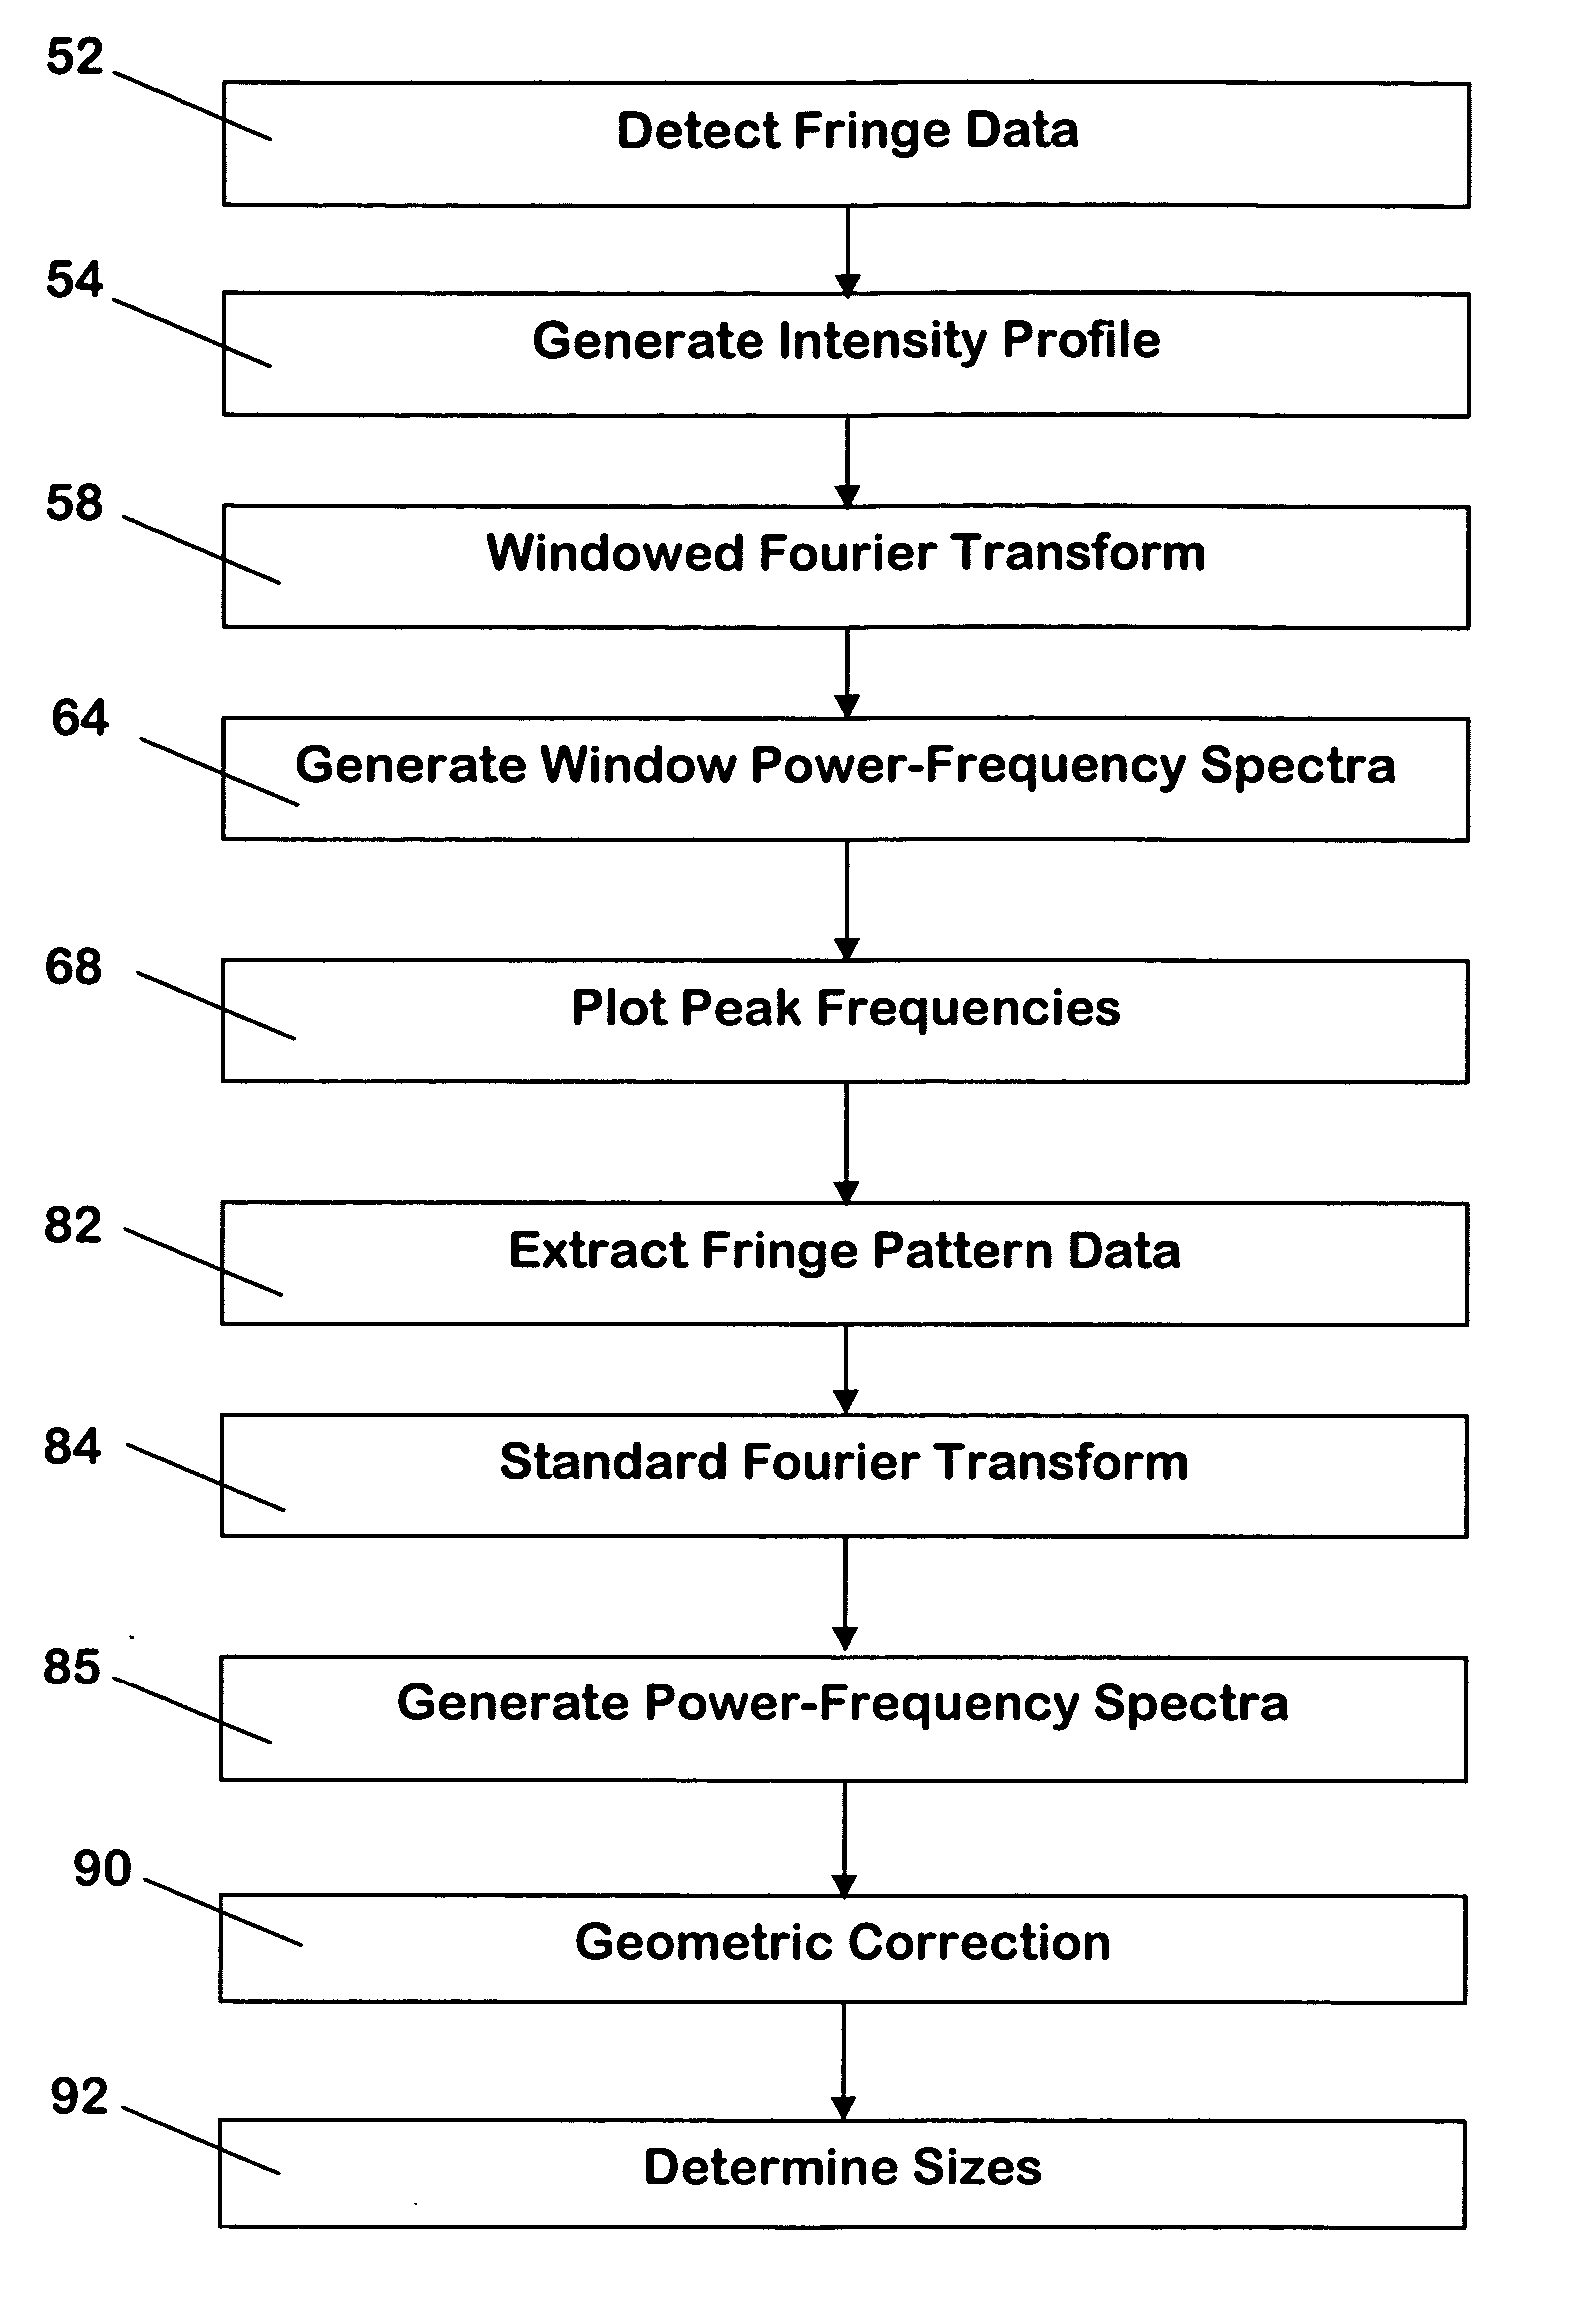
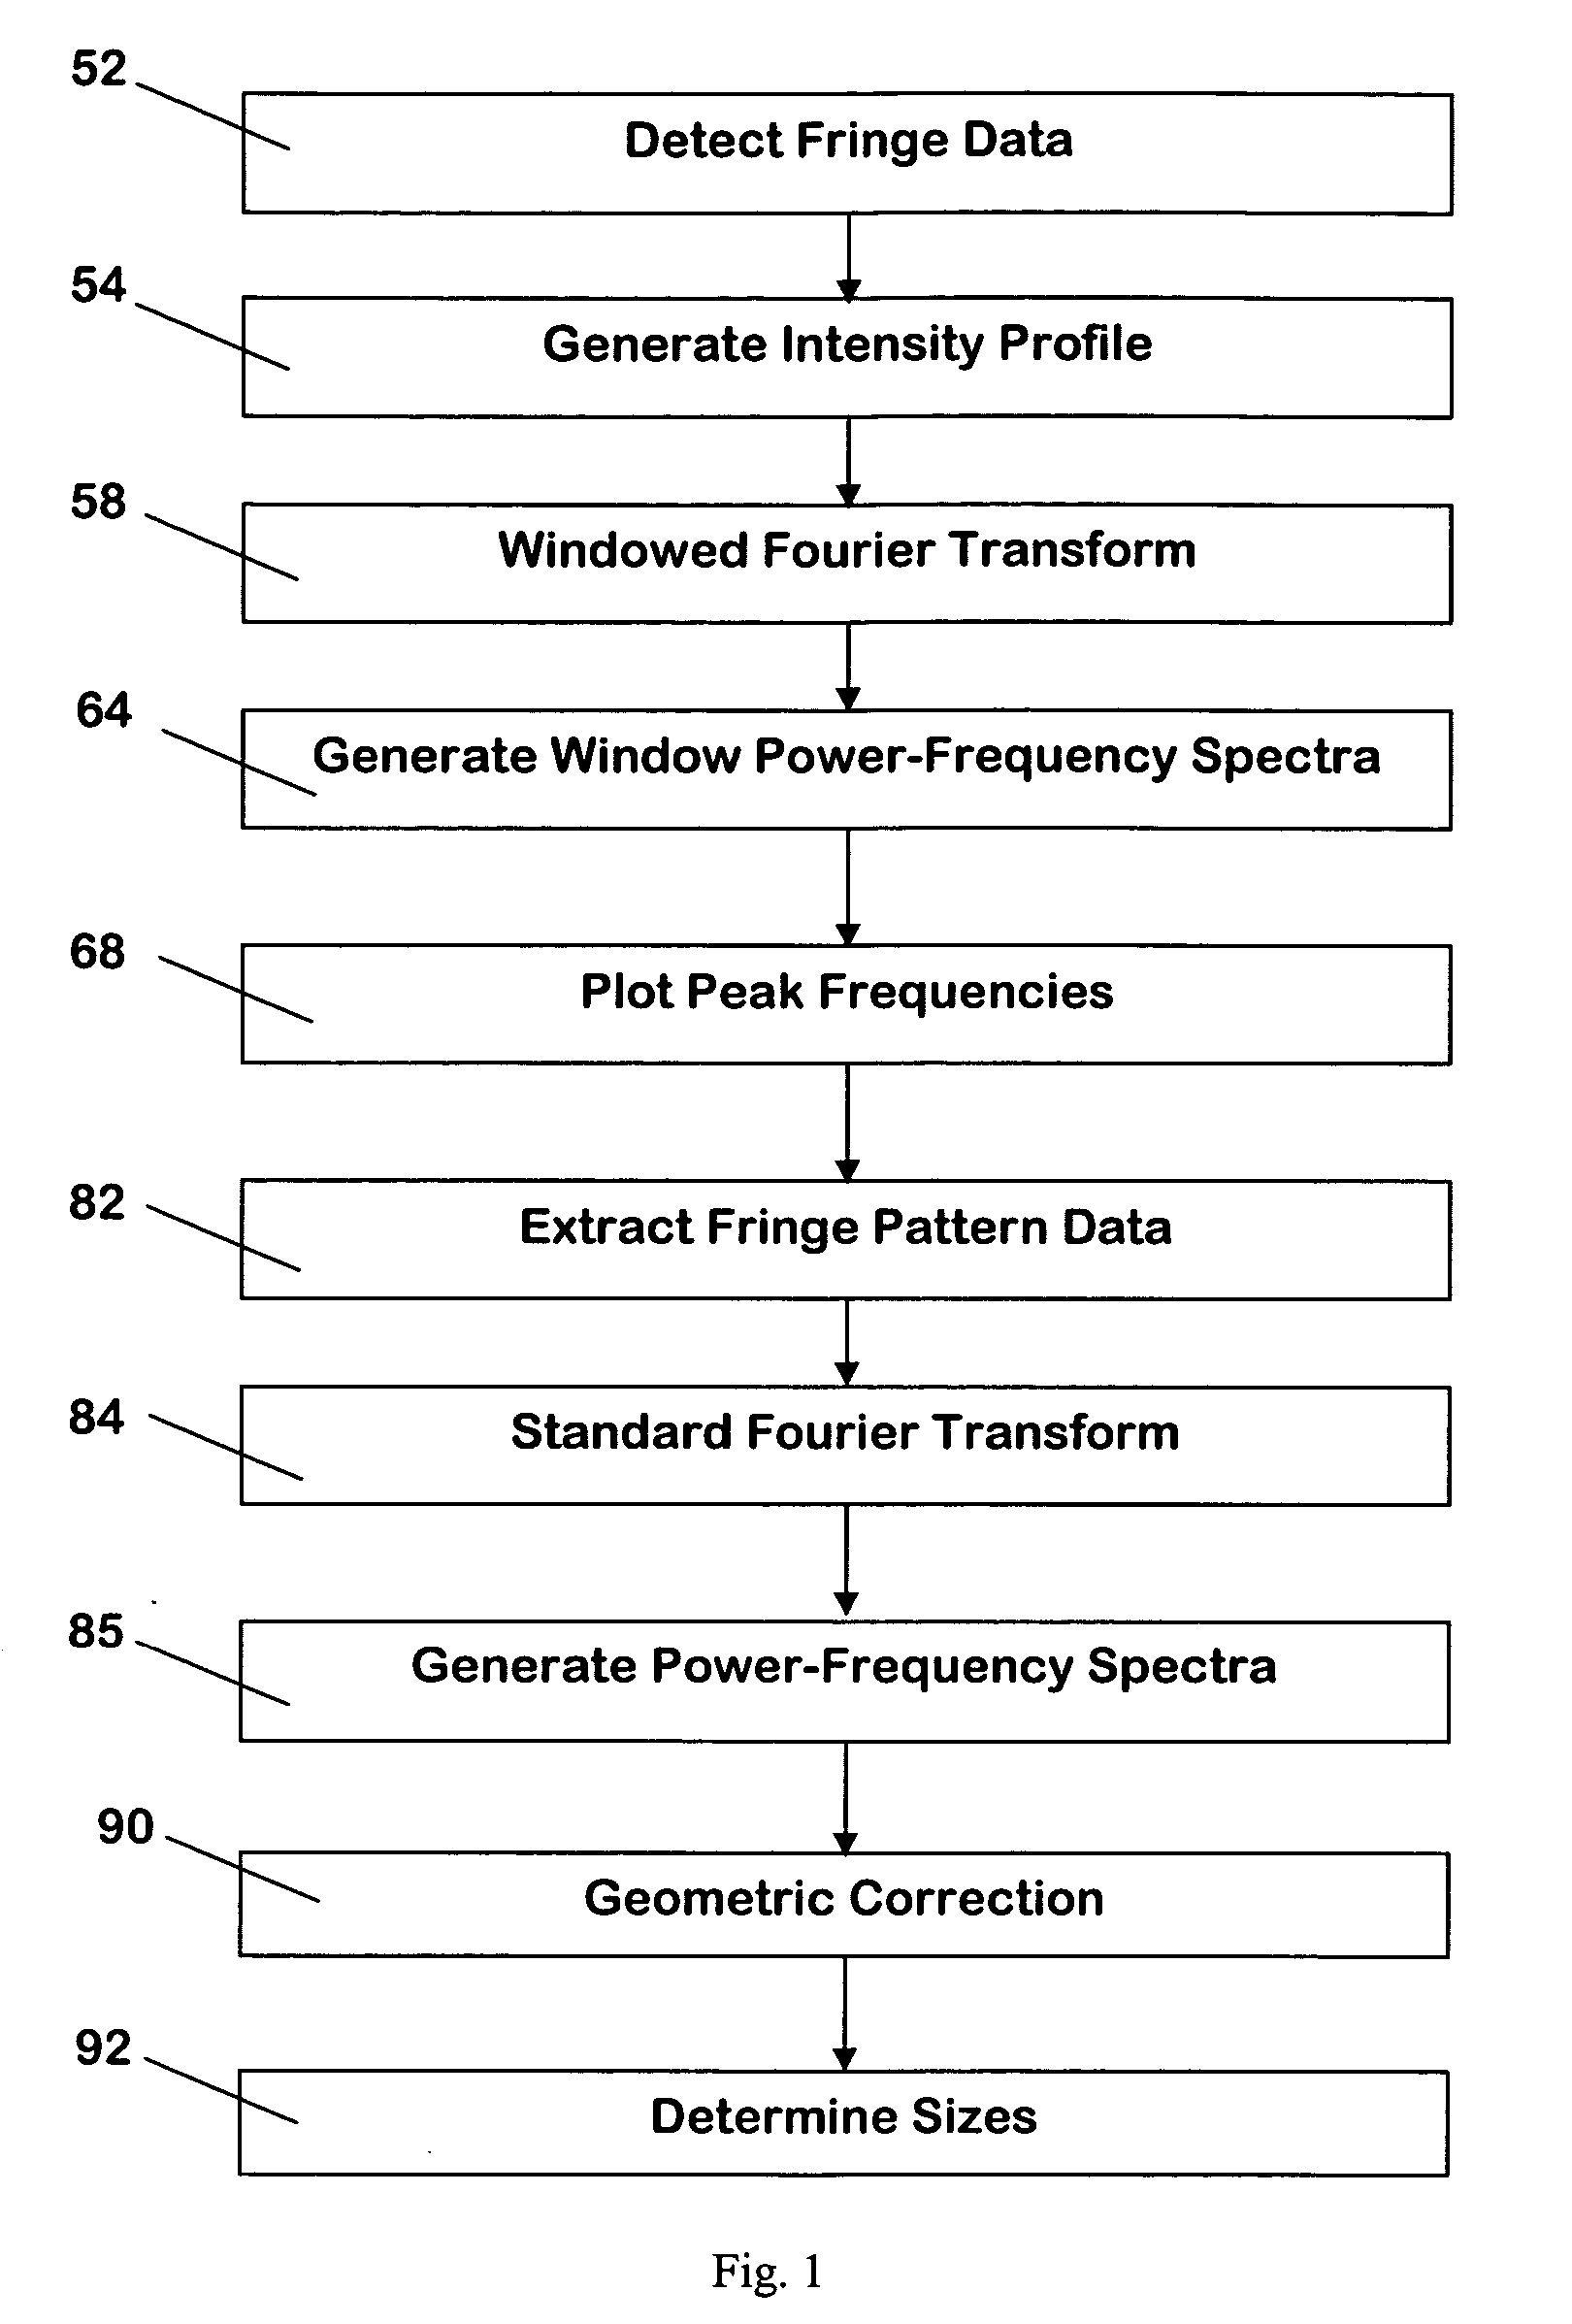
[0028] Turning now to the drawings, FIG. 1 is a flowchart illustrating a preferred process for analyzing fringe pattern data to obtain the desired physical information, for example particle sizes in the interferometric particle sizing application. The original fringe pattern data are largely associated directly with particle size or velocity or other physical information depending on the application, and therefore are useful. However, the fringe pattern data also include extraneous data associated with noise, non-spherical particles, and multi-particle effects. Most extraneous data are of limited or no utility and complicates the analysis of fringe pattern data. According to an embodiment of the present invention, windowed Fourier transforms and peak frequencies are employed to distinguish the useful data from the extraneous data and extract the useful data. Subsequent processing steps are performed only on the extracted data, resulting in more reliable particle and droplet characte...


PUM


Abstract

A method for identifying and determining the frequency of scattered radiation fringe patterns for applications such as particle or droplet sizing and laser Doppler velocimetery. The method utilizes a series of windowed Fourier transforms performed on an intensity profile of the scattered radiation to locate a segment where a fringe pattern is located on the intensity profile. A standard Fourier transform is then performed on the segment to determine a dominant frequency of the fringe pattern, from which a physical quantity such as diameter or velocity of the particle or droplet may be derived. The method may be utilized with a line or an array sensor to measure the fringe patterns in a spatial domain, or with a point detector to measure the fringe patterns in the time domain.

Description

RELATED APPLICATION [0001] This application claims benefit of U.S. Provisional Application Ser. No. 60 / 713,790, filed Sep. 1, 2005, which is hereby fully incorporated herein by reference.FIELD OF THE INVENTION [0002] The present invention relates to systems and processes for analyzing fringe patterns or oscillation patterns derived from scattered coherent energy, and more particularly to an apparatus and method for analyzing the fringe patterns presented by moderate to high density target population fields. The apparatus and method hereof are particularly well suited for measuring the physical characteristics of airborne particles and droplets based on the frequency or spacing of interference fringes. BACKGROUND OF THE INVENTION [0003] A variety of particle and droplet characterizing techniques involve the analysis of fringe patterns or oscillation patterns scattered by an irradiated particle or droplet. For example, interferometric particle sizing is based on the interference of la...

Claims


Application Information

Patent Timeline
IPC IPC(8): G06K9/36
CPCG01N2015/1075G01N2015/145G06K9/522G01P5/26G01N2015/1493G06V10/431G01N2015/1027
Inventor PAN, GANG
Owner TSI INC
Why Eureka
Try Eureka