Device and method for analytical cell imaging

Inactive Publication Date: 2006-05-04
IMMUNIVEST
View PDF5 Cites 52 Cited by
  • Summary
  • Abstract
  • Description
  • Claims
  • Application Information

AI Technical Summary

Benefits of technology

[0006] The present invention is a cell analyzer that differentiates immunomagnetically cells that are aligned on Nickel lines while passing through a focused laser beam. In one preferred embodiment, a conventional CD player objective was used to focus a laser-diode onto the magnetically aligned cells. An optical focus and tracking system

Problems solved by technology

Automated image analysis systems have been used to reduce subjective errors in cell classification between different operators in manual methods, but such prior art systems without preliminary cell enrichment steps still inherently lack sensitivity.
However, these and other currently available methodologies are not sufficiently sensitive for accurate classification and typing of rare events such as circulating tumor cells in blood.
Although fluorescence activated cell sorting (FACS) can be used to sort immunophenotypically identified cells it is quite a challenge to sort the rare events and preserve them for cytological evaluation.
In addition, the skill level needed for the latter is prohibitive for a clinical assay.
Fluorescence microscopy has the disadvantage that considerable and variable cell losses are associated with the preparation of the sample slides for microscopic analysis.
The detection of these circulating tumor cells (CTC) is further complicated by their heterogeneity, not only in size and shape, but also in their antigen expression profile such as cytoskeletal proteins that can be present at extremely low or high copy numbers.

Method used


Image

  • Device and method for analytical cell imaging
  • Device and method for analytical cell imaging
  • Device and method for analytical cell imaging

Examples


example 1

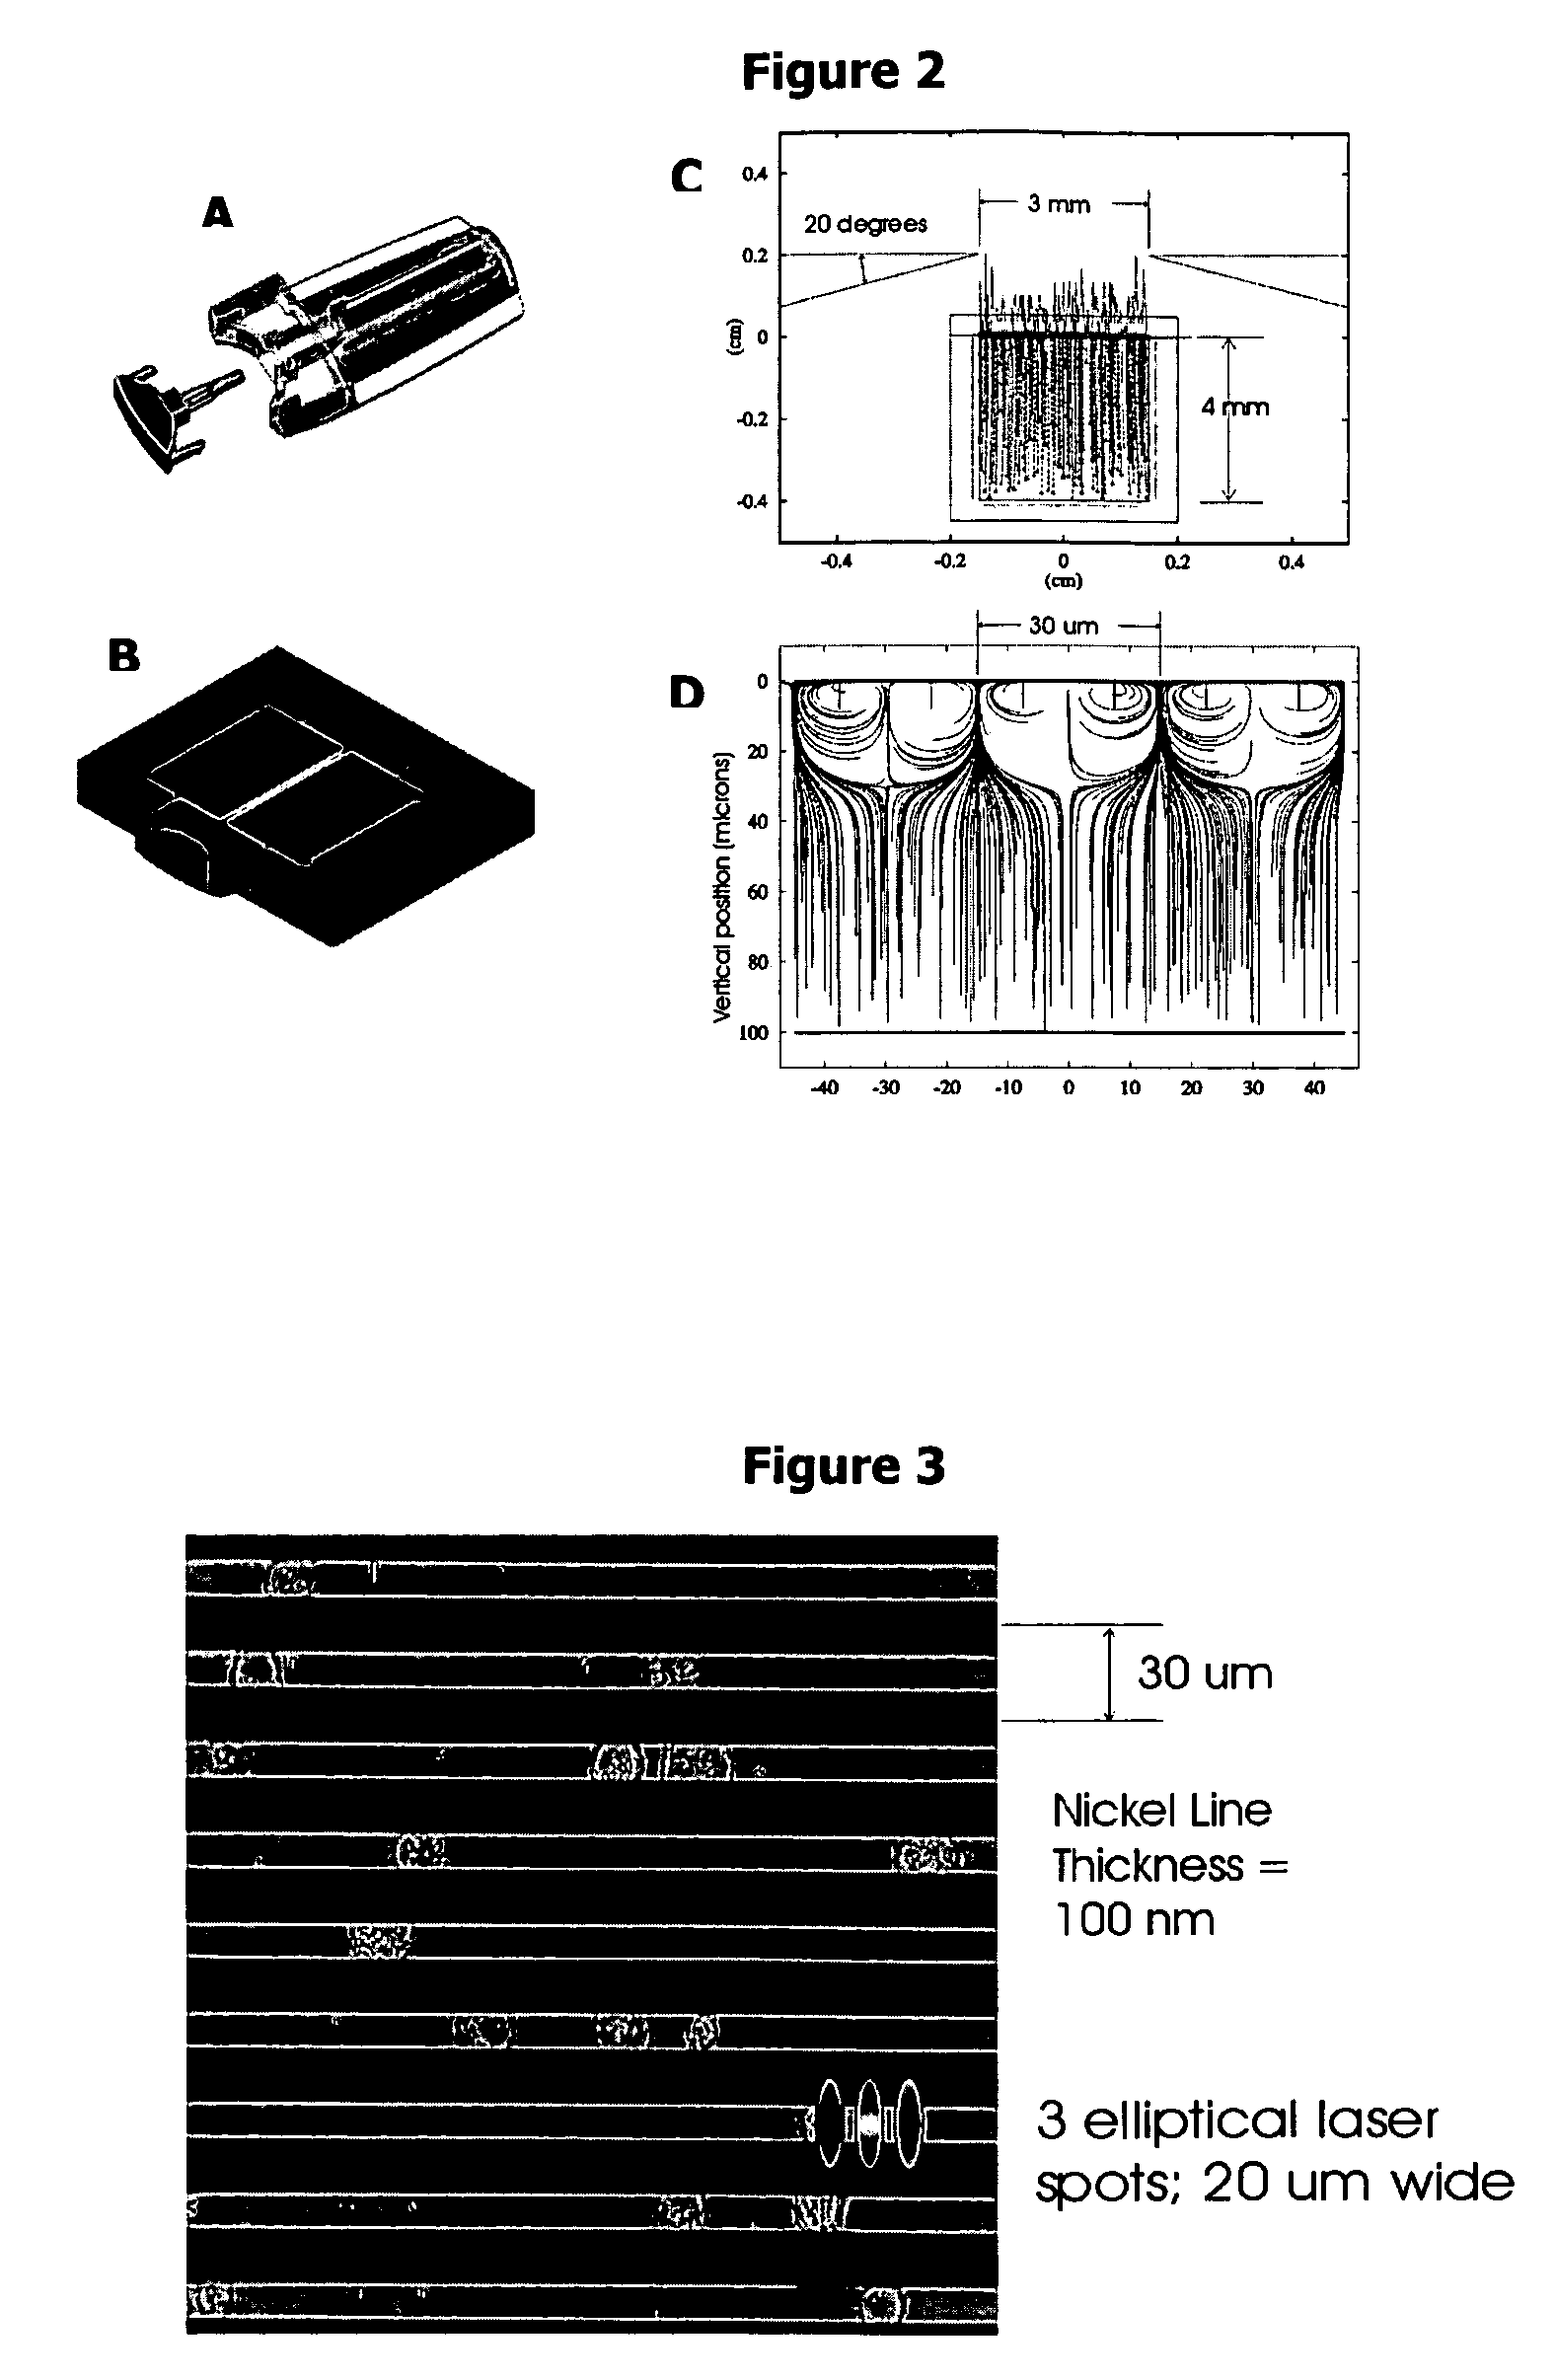
Determining the Nickel Line Spacing

[0055] To assess the size and shape of circulating tumor cells, blood samples of cancer patients were prepared with CellPrep™ and analyzed by a fluorescence microscope system. More than 1000 circulating epithelial cells from 8 patients with a variety of cancers were obtained and cell diameters were measured. Circulating epithelial cells within and between patients were heterogeneous in size and shape. FIG. 5 shows the cell size distribution ranging from approximately 5-30 μm with a mean diameter of 11.3 μm. This posed a problem of selecting a standard line spacing that could accommodate this variation in diameter. If the Nickel lines are spaced to accommodate the larger cells, then there is the risk that smaller cells will occupy the same lateral space or form clusters and be seen as a single event when scanned in the y-direction. If too narrow a space, then the Nickel lines will obscure a large percentage of the cells and compromise imaging of th...

example 2

Tumor Cell Analysis by the System

[0058] Cells from the prostate carcinoma tissue culture cell line, PC3, were used at a concentration of 5,000 PC3 cells / mL. Aliquots (10-100 □L) of this cell suspension were spiked into 7.5 mL whole blood samples of normal donors to obtain blood samples with low tumor cell numbers.

[0059] Approximately 300 PC3 cells were spiked into 7.5 mL of blood and processed with CellPrep™ as described above. When the sample is dispensed into the sample chamber while being held in the magnetic field, the immunomagnetically labeled cells are drawn to the upper inside surface of the chamber by magnetic forces from the permanent magnets. A bright field image of the aligned PC3 cells is shown in FIG. 3.

[0060]FIG. 6 shows the analysis of the sample. The 2-dimensional dot plot in FIG. 6A shows the fluorescence signals of CK-PE and CD45-APC. The tumor cell candidates (PC3-cells) staining with CK-PE and lacking CD45-APC can be clearly discriminated from the leukocytes ...

example 3

Scanning Methods

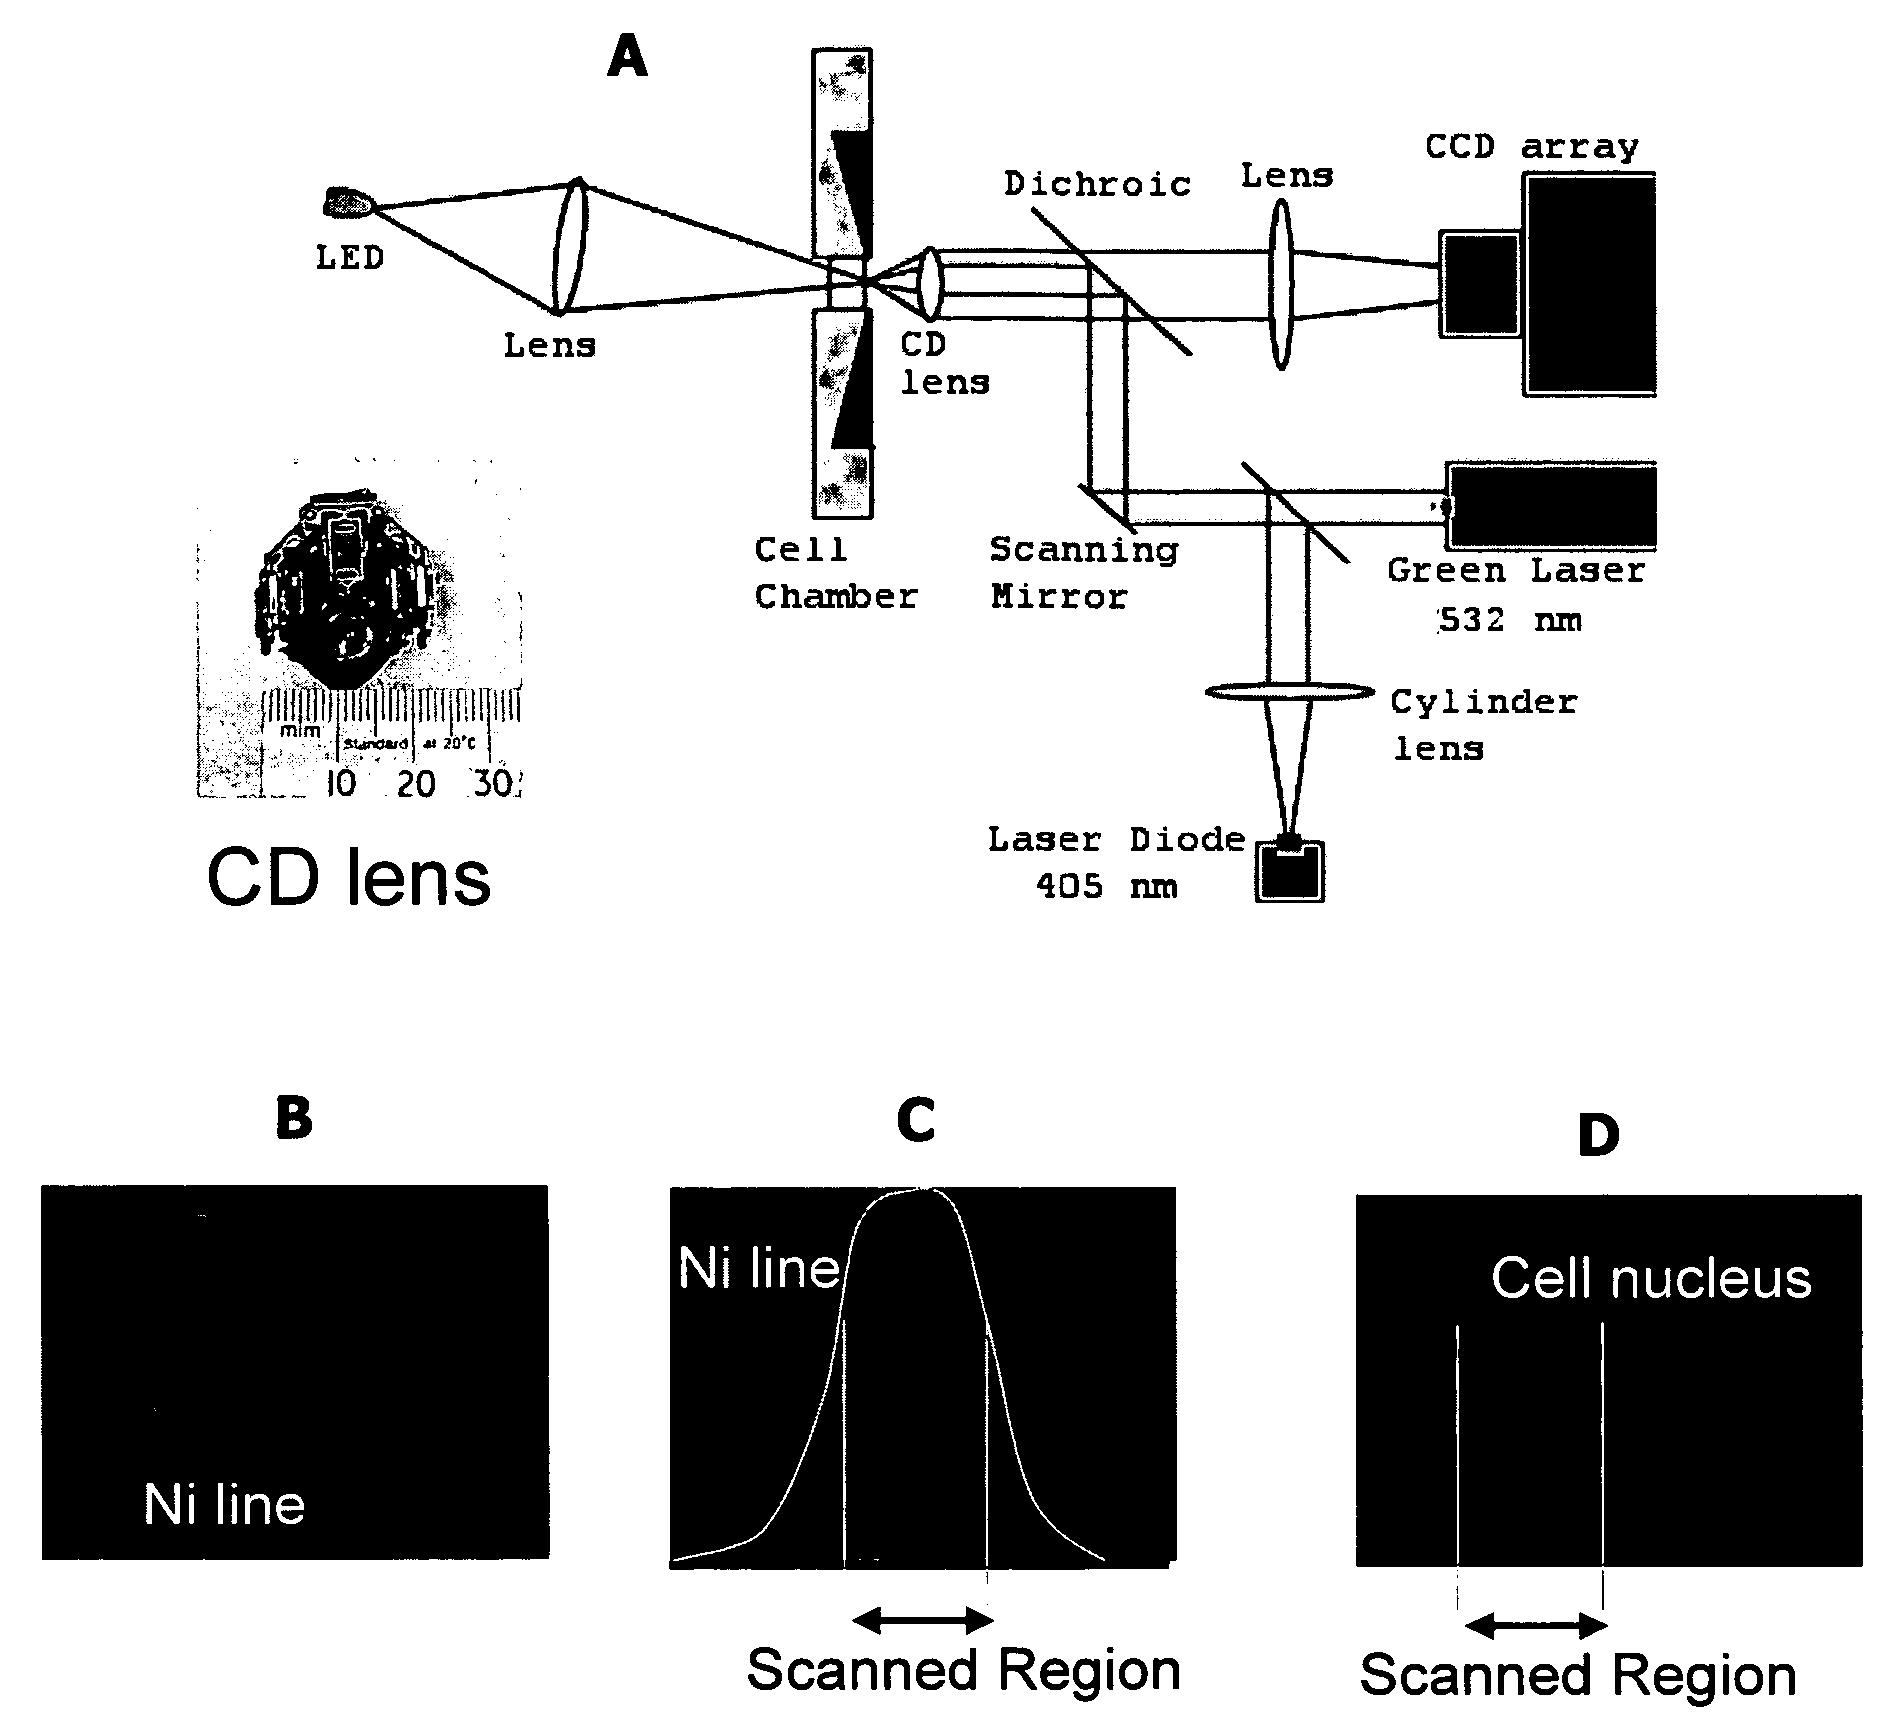
[0061] In the present instrument system, cells are imaged with laser illumination to avoid the additional cost, low intensity, and short lifetime of broadband light sources. However, the long coherence length of lasers and light reflections in the imaging system contribute coherent noise and speckle in the image. Also, the Gaussian intensity profile of the laser beam does not provide uniform illumination of the object. Both of these problems with coherent illumination are overcome by moving the laser spot across the object as the CCD array integrates the light. Movement of the source during exposure washes out the coherent noise in the image. Any angular scanning means, such as a scanning mirror, rotating mirror, electro-optic or acousto-optic deflector, or electro-refractive device could be used to deflect the beam by a small angle, providing motion of the focused laser spot at the object plane. By driving this device with a periodic signal, the spot is scanned bac...


PUM


Abstract

In patients with carcinomas tumor cells are shed into the blood, enumeration and characterization of these cells offers the opportunity to obtain a “real time” biopsy of the tumor and may improve the management of the disease. The frequency of circulating tumor cells is rare (<1 cell / ml) and technology is needed that has sufficient sensitivity and specificity to enumerate and characterize these cells. The present system was developed to provide an immunophenotype, fluorescence wave forms as well as images of immunomagnetically enriched cells. Blood volumes ranging from 7.5-30 ml are immunomagnetically enriched for epithelial cells. The sample volume is reduced to 320 μl and inserted into an analysis chamber. Upon introduction of the chamber in a magnetic field, the immunomagnetically tagged cells rise out of the sample and align between nickel lines (period 30 μm, space 15 μm) that are present on the viewing surface of the chamber. A multi laser system is used to detect the fluorescence emitted by DAPI, Phycoerythrin and Allophycocyan labeled and magnetically aligned cells. Compact disk optics are used to maintain alignment and focus of the laser beams onto nickel lines while moving the chamber. The chamber is scanned with a speed of 10 mm / sec and the entire chamber is analyzed in approximately 5 minutes. The fluorescent signals obtained from the events provide an immunophenotype similar to that of a flow cytometer. The fluorescence waveforms improve the characterization of the events and add to the classification as background, cellular debris and cells. Since the cell locations are preserved, objects that immunophenotypically classify as epithelial cells can be revisited for further analysis. Bright field and fluorescent images of the selected objects are captured to confirm that the identified objects are tumor cells.

Description

PRIORITY INFORMATION [0001] This application is U.S. National Stage of PCT / US03 / 13842, which claims the benefit of U.S. Provisional Application No. 60 / 377,868 filed 3 May 2002. That application is incorporated by reference herein.BACKGROUND OF THE INVENTION [0002] Automated image analysis systems have been used to reduce subjective errors in cell classification between different operators in manual methods, but such prior art systems without preliminary cell enrichment steps still inherently lack sensitivity. Several automated cell-imaging systems have been described or are commercially available for cell analysis. The system developed by Chromavision, ACIS™ or Automated Cellular Imaging System (Douglass et al., U.S. Pat. No. 6,151,405) uses calorimetric pattern recognition by microscopic examination of prepared cells by size, shape, hue and staining intensity as observed by an automated computer controlled microscope and / or by visual examination by a health care professional. The s...

Claims


Application Information

Patent Timeline
IPC IPC(8): C12M1/34C12Q1/04
CPCG01N15/1456G01N21/6458G01N35/0098G01N2015/1006
Inventor TRAINER, MICHAEL NORMAN
Owner IMMUNIVEST
Why Eureka
Try Eureka