Prediction by collective likelihood from emerging patterns
- Summary
- Abstract
- Description
- Claims
- Application Information
AI Technical Summary
Benefits of technology
Problems solved by technology
Method used
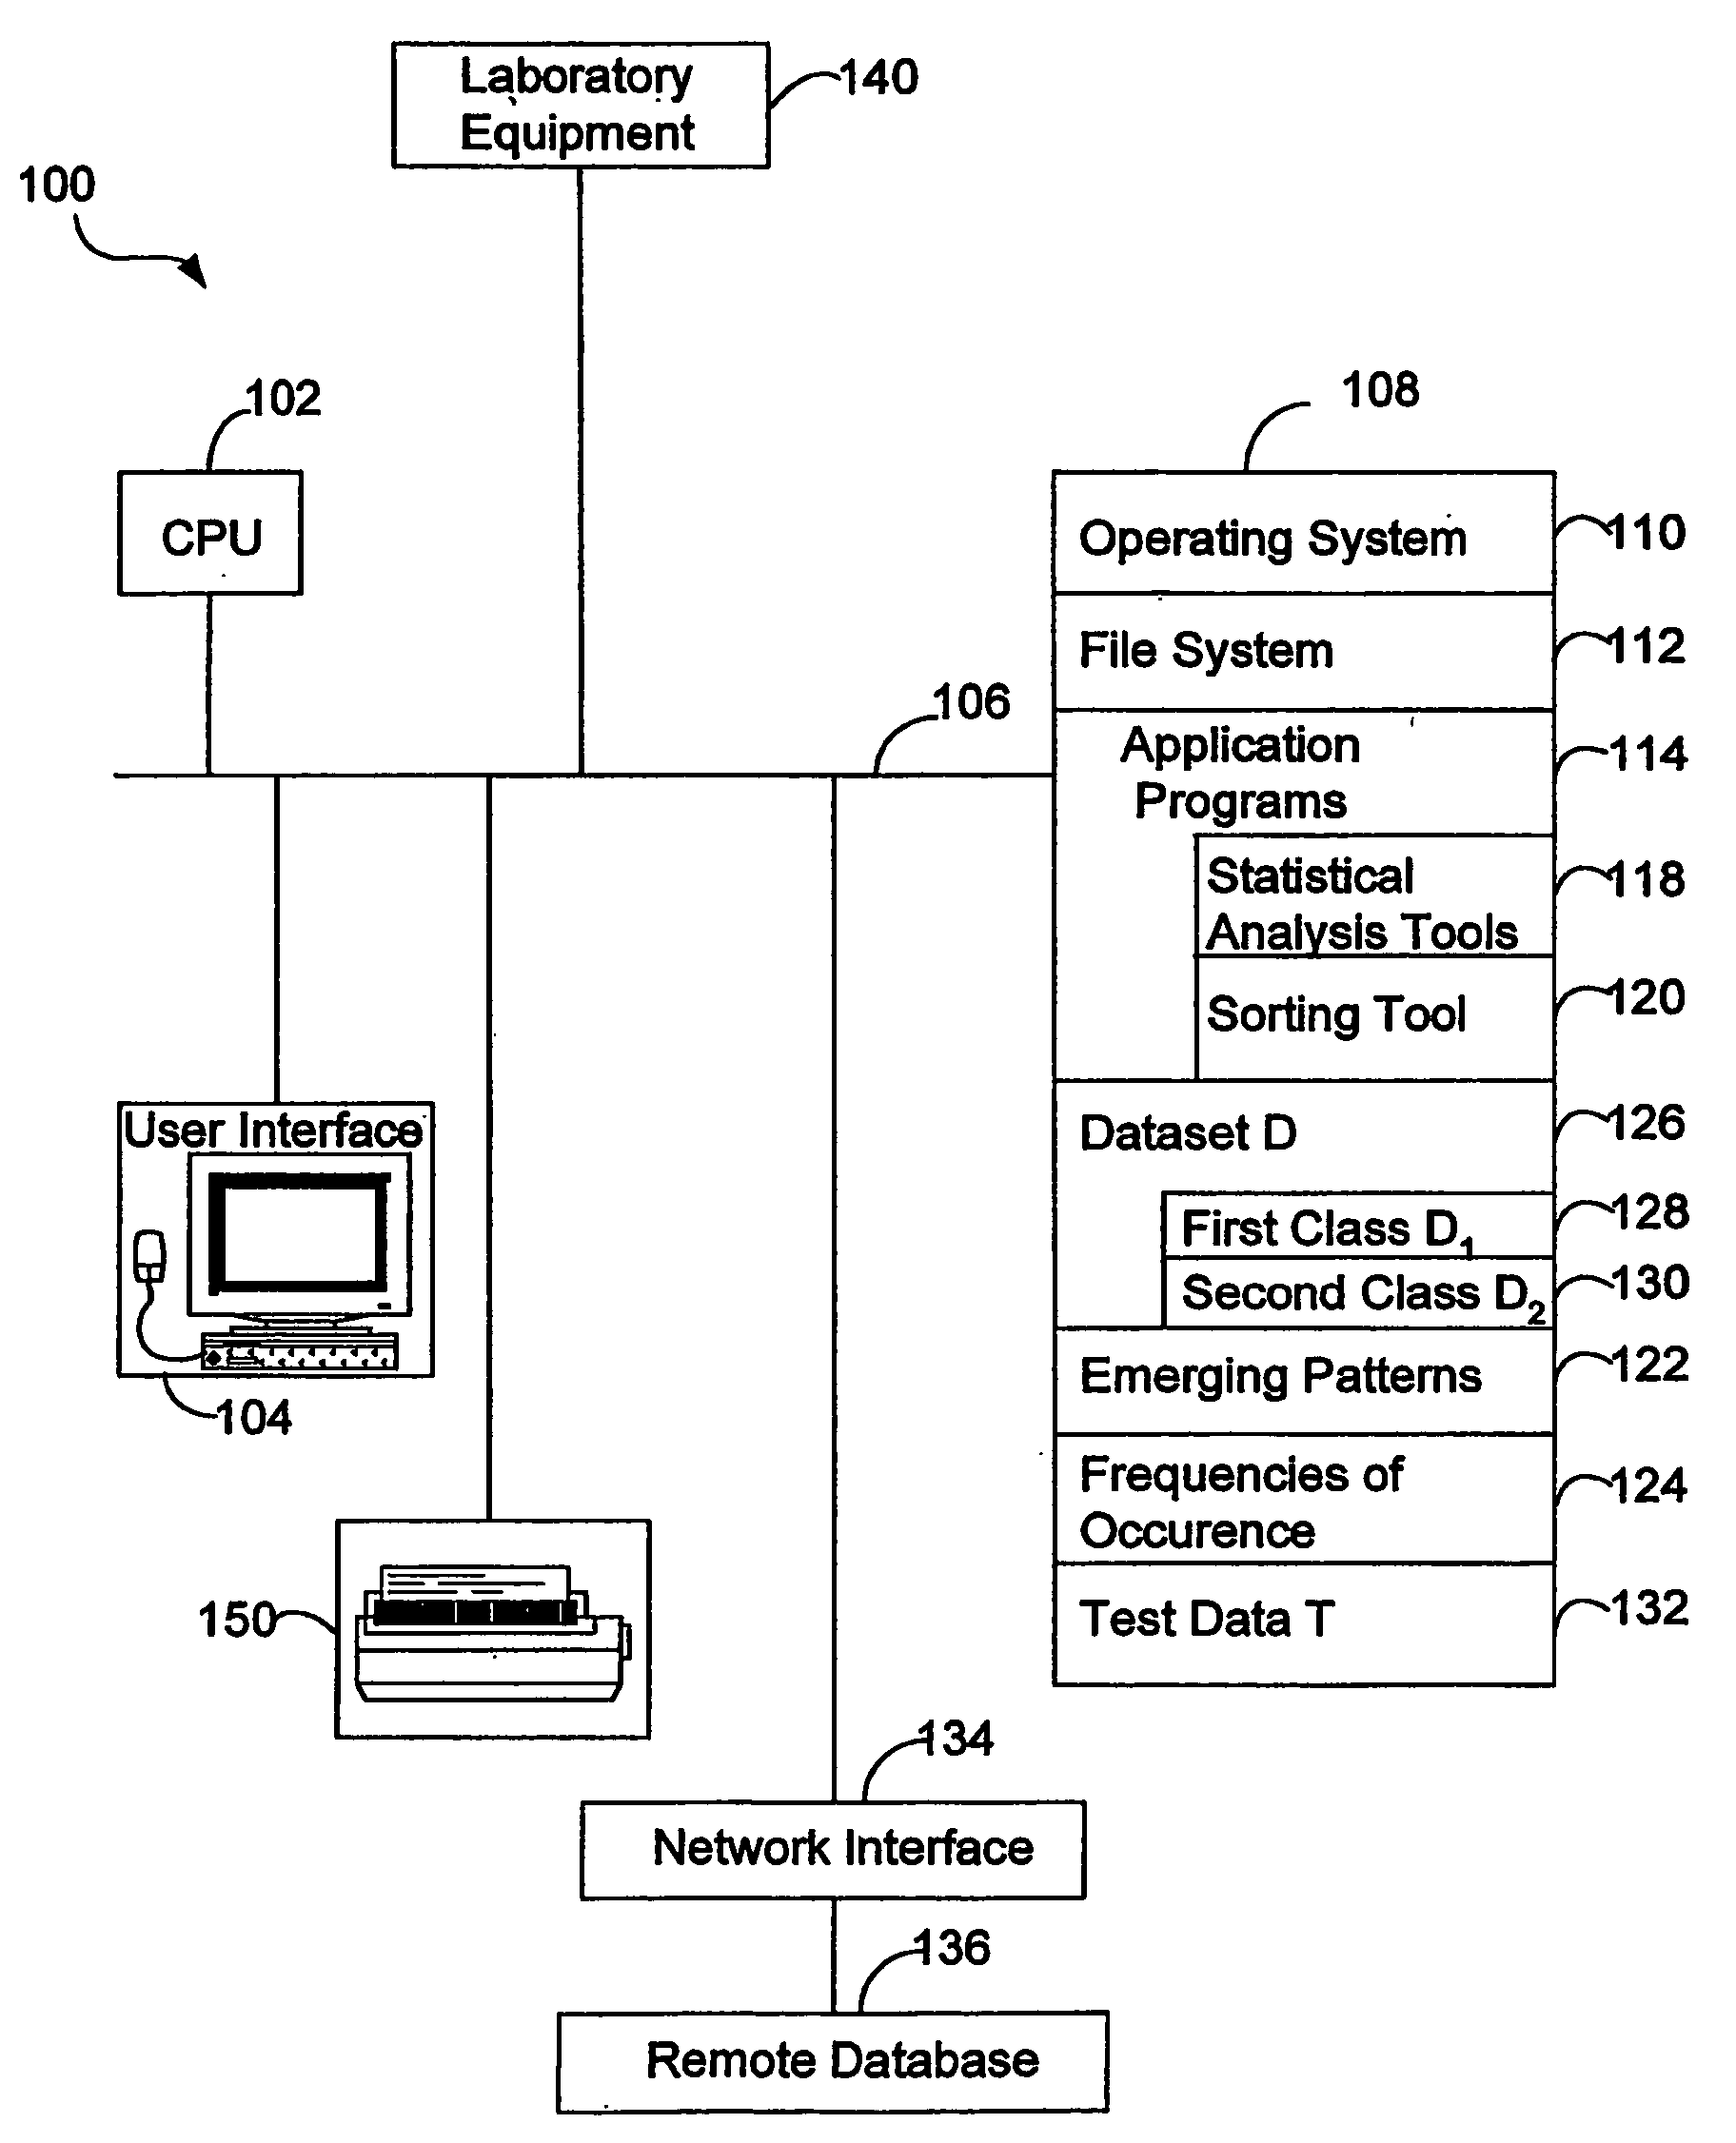
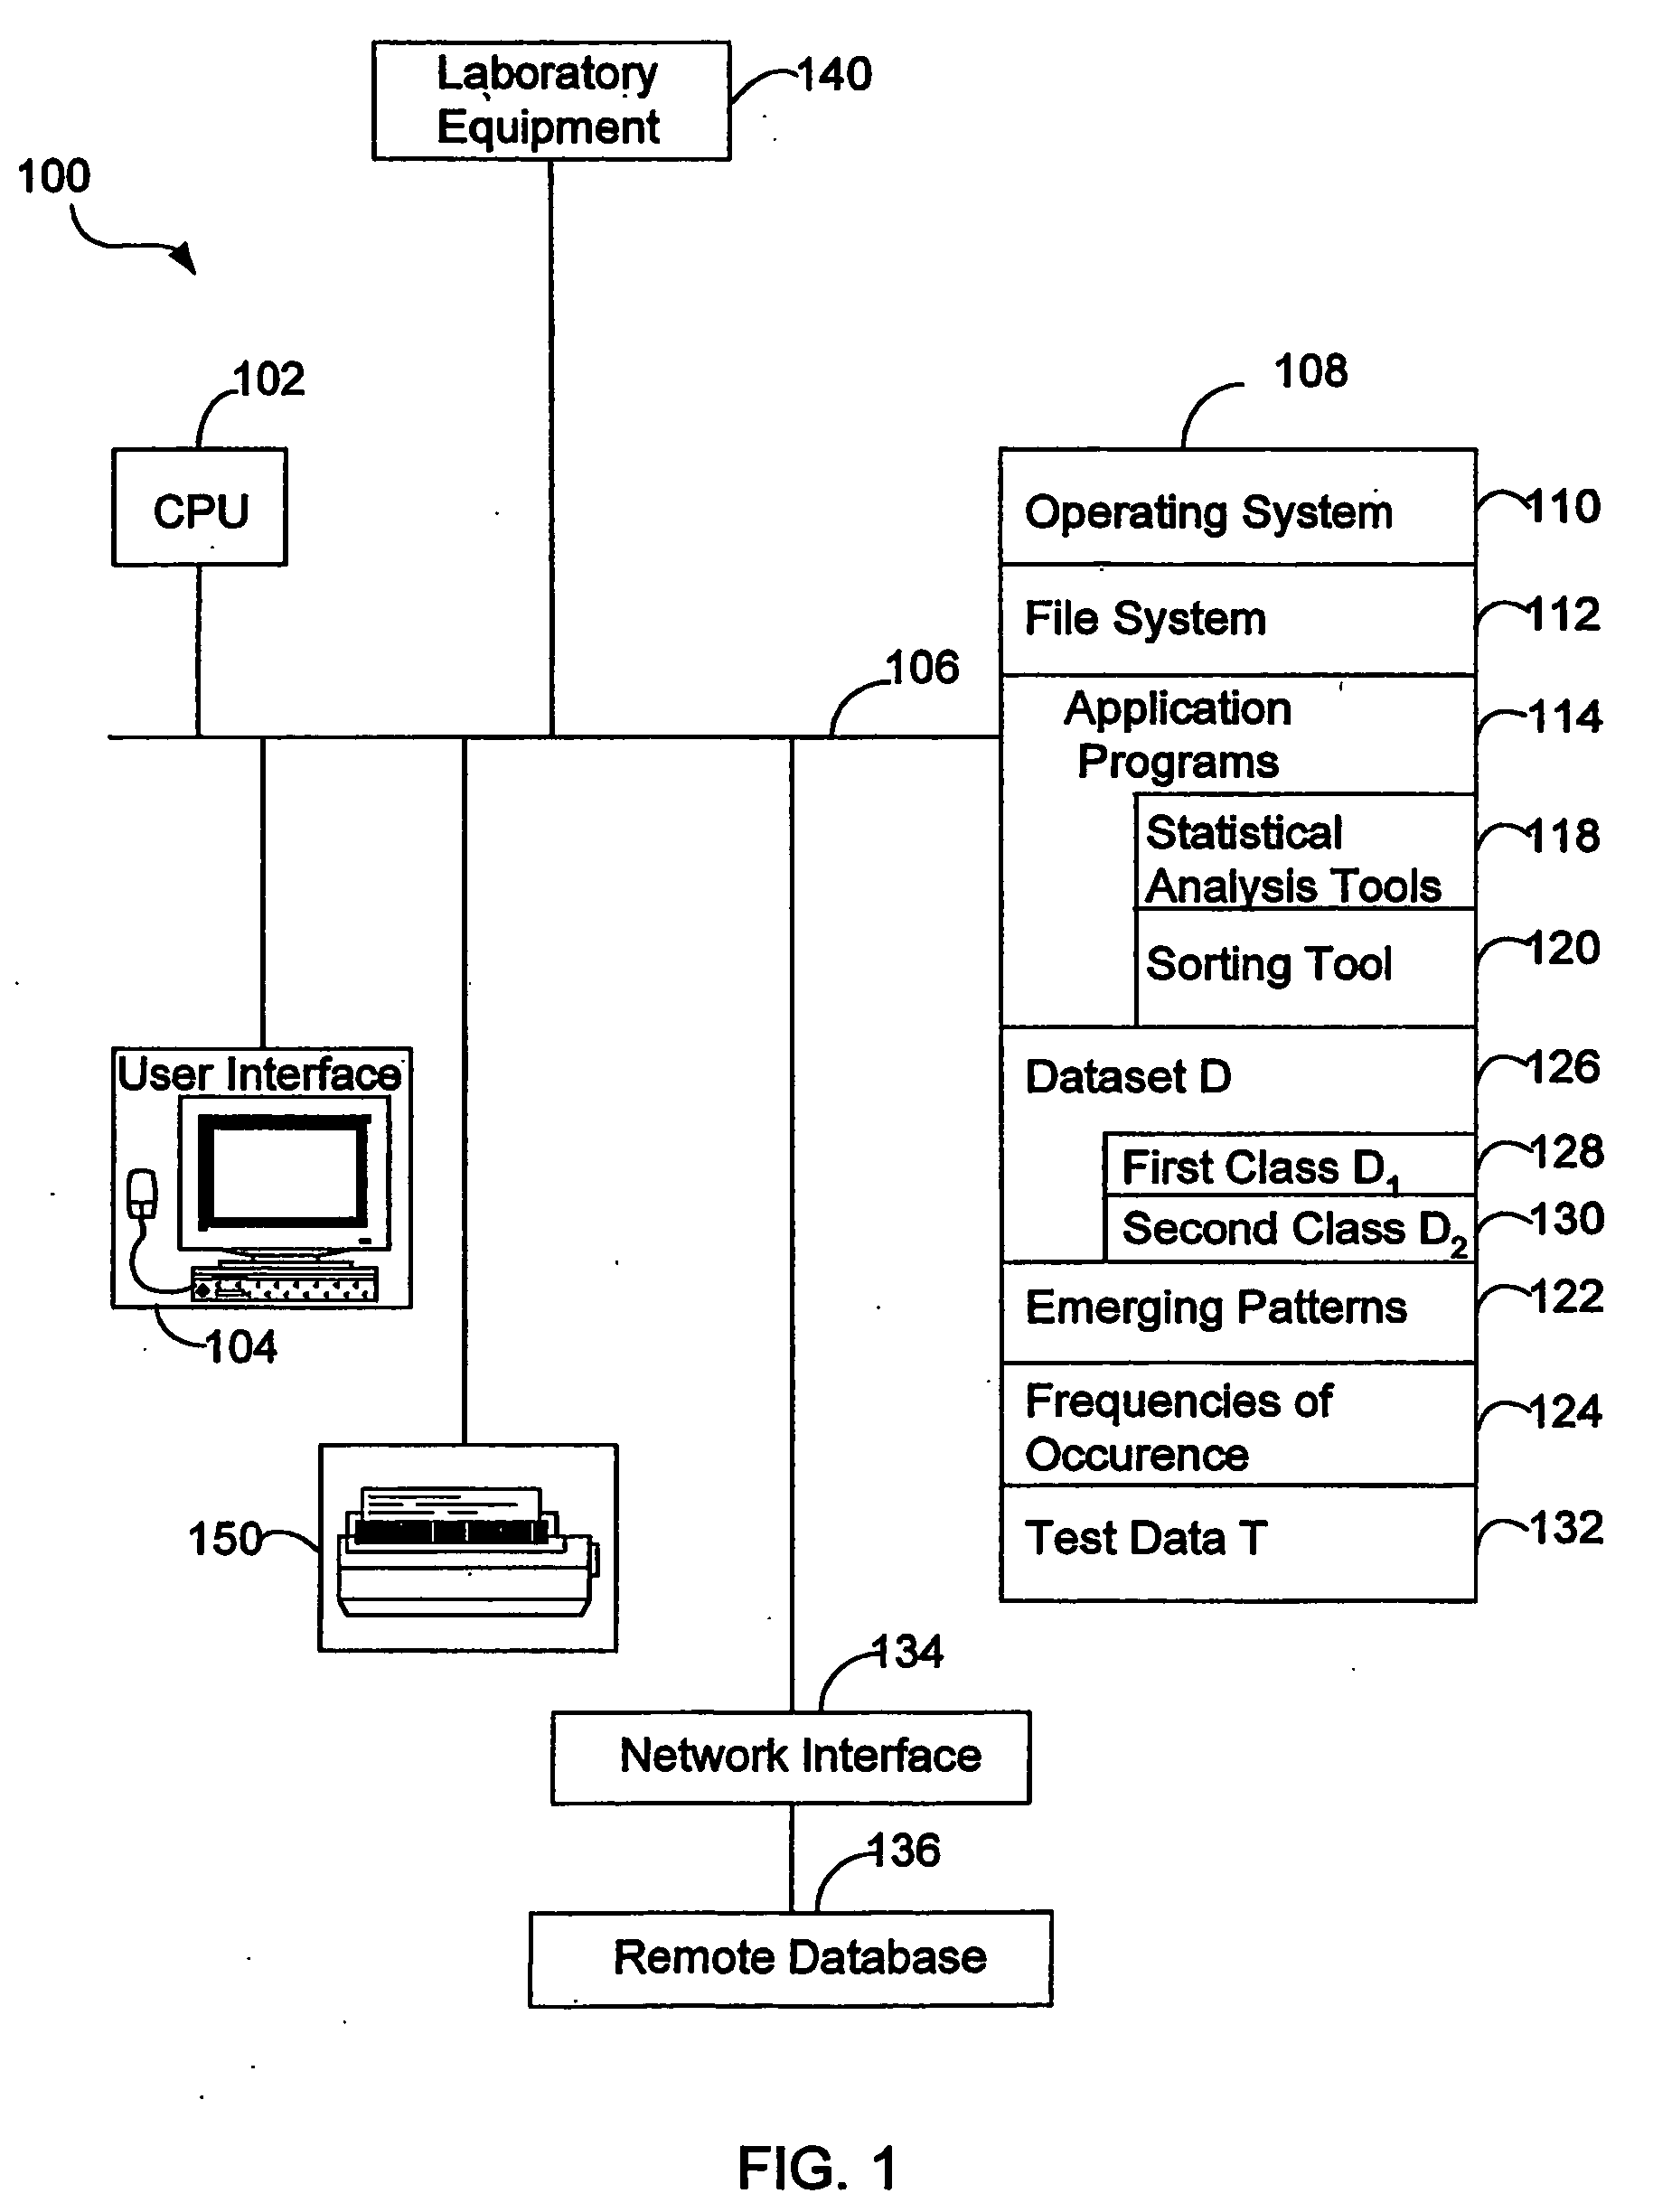
Image

Examples
example 1
Emerging Patterns
Example 1.1
[0152] Many EP's can be found in a Mushroom Data set from the UCI repository, (Blake, C., & Murphy, P., “The UCI machine learning repository,”
[0153] http: / / www.cs.uci.edu / ˜mlearn / MLRepository.html, also available from Department of Information and Computer Science, University of California, Irvine, USA) for a growth rate threshold of 2.5. The following are two typical EP's, each consisting of 3 items:
X={(ODOR none), (GILL_SIZE=broad), (RING_NUMBER=one)}
Y={(BRUISEs=no), (GILL_SPACING=close), (VEIL_COLOR=white)}
[0154] Their supports in two classes of mushrooms, poisonous and edible, are as follows.
EPsupp_in_poisonoussupp_in_ediblegrowth_rateX 0%63.9%∞Y81.4%3.8%21.4
[0155] Those EP's with very large growth rates reveal notable differentiating characteristics between the classes of edible and poisonous Mushrooms, and they have been useful for building powerful classifiers (see, e.g., J. Li, G. Dong, and K. Ramamohanarao, Making use of th...
example 1.2
[0156] About 120 collections of EP's containing up to 13 items have been discovered in the U.S. census data set, “PUMS” (available from www.census.gov). These EP's are derived by comparing the population of Texas to that of Michigan using the growth rate threshold 1.2. One such EP is:
}Disabl 1:2. Langl:2, Means:l, Mobili:2, Perscar:2, Rlabor:1, Travtim:[1.59], Work89:1}.
[0157] The items describe, respectively: disability, language at home, means of transport, personal care, employment status, travel time to work, and working or not in 1989 where the value of each attribute corresponds to an item in an enumerated list of domain values. Such EP's can describe differences of population characteristics between different social and geographic groups.
example 1.3
Trends in Purchasing Data
[0158] Suppose that in 1985 there were 1,000 purchases of the pattern (COMPUTER, MODEMS, EDU-SOFTWARES) out of 20 million recorded transactions, and in 1986 there were 2,100 such purchases out of 21 million transactions. This purchase pattern is an EP with a growth rate of 2 from 1985 to 1986 and thus would be identified in any analysis for which the growth rate threshold was set to a number less than 2. In this case, the support for the itemset is very small even in 1986. Thus, there is even merit in appreciating the significance of patterns that have low supports.
PUM
| Property | Measurement | Unit |
|---|---|---|
| Fraction | aaaaa | aaaaa |
| Fraction | aaaaa | aaaaa |
| Fraction | aaaaa | aaaaa |
Abstract
Description
Claims
Application Information
 - R&D
- Intellectual Property
- Life Sciences
- Materials
- Tech Scout
- Unparalleled Data Quality
- Higher Quality Content
- 60% Fewer Hallucinations
Browse by: Latest US Patents, China's latest patents, Technical Efficacy Thesaurus, Application Domain, Technology Topic, Popular Technical Reports.
© 2025 PatSnap. All rights reserved.Legal|Privacy policy|Modern Slavery Act Transparency Statement|Sitemap|About US| Contact US: help@patsnap.com