
System and method for providing optimization of a financial portfolio using a parametric leptokurtic distribution

a financial portfolio and distribution technology, applied in the field of financial portfolio optimization, can solve the problems of skewed distribution of returns of many financial assets, inability to account for normal distributions, poor risk adjusted return optimization of normal distributions, etc., and achieve the effect of accurately determining etls

Active Publication Date: 2005-02-10
FINANALYTICA
View PDF7 Cites 40 Cited by
  • Summary
  • Abstract
  • Description
  • Claims
  • Application Information

AI Technical Summary

Benefits of technology

The present system and method automatically determines risk measures of financial assets and financial portfolios and optimizes risk-adjusted returns of financial portfolios, while avoiding the common assumption in which returns are modeled using a Normal probability or empirical distribution. Parametric distributions are used to model both leptokurtic and asymmetry effects in financial returns and risk factors for the optimization of portfolios of financial assets. In addition, ETLs are measured from these distribution models. These parametric distributions allow for the modeling of multivariate effects, such as the dependency between the returns or risk factors, while accounting for the “heavy tails” of leptokurtic and asymmetric returns distributions. Further, the use of parametric distributions allows the use of various methods to model the clustering of volatility effect to more accurately determine ETLs.
In one embodiment, the system and method uses an ETL determined from parametric leptokurtic distributions to optimize the risk adjusted return of a given portfolio using well known LP methods. As required, constraints are used in the formulation of the LP problem. Risk or return estimates form one set of constraints and additional constraints can be specified to restrict the feasible set of portfolio weights to achieve desirable portfolio properties. Transaction cost functions and liquidity risk, or “market friction,” functions are added to the estimates of returns or the constraints as penalty terms in the LP problem, as required, which allow the model to account for real-world penalties that restrict a portfolio manager's trading strategies. Using the ETL as the risk measure for portfolio optimization has several advantages. ETL is an asymmetric measure of “down side” risk, that is, the risk of a loss, and is more realistic than traditional symmetric measures of risk, such as volatility. Moreover, using ETL as the risk constraint allows the optimization to be formulated as an LP problem, thereby allowing the use of well known and stable computational methods for large scale portfolios. Finally, using parametric distributions that allow for leptokurtic and asymmetric behavior allows for the determination of more accurate estimates of portfolio risk producing optimized portfolios with better risk adjusted returns.

Problems solved by technology

Although parametric Normal distributions allow for portfolio optimization over one or more time horizons, the returns for most financial asset classes and risk factors are leptokurtic and skewed and Normal distributions cannot account for such heavy tailed and asymmetric behavior.
Normal distributions fare poorly in risk adjusted return optimization for several reasons.
As well, the returns of many financial assets exhibit skewed distributions.
Moreover, the risk adjusted returns and risk factors for many types of financial assets remain leptokurtic and skewed even after removal of clustering of volatility effects through parametric Normal distributions.
As a result, Normal distributions inaccurately measure risk adjusted returns and risk factors during financial portfolio optimization.
However, empirical distributions can only model actual historical events and are inherently limited by the historical record.
The Sortino-Stachel ratio attempts to use a measure of down side risk, but fails to address leptokurtic behavior.
Although addressing leptokurtic behavior, the stable ratio fails to address asymmetric behavior.
Further, this ratio uses only an empirical measure of risk, rather than an actual measure of the probability of loss or tail risk, as could be achieved with a parametric distribution, diminishing the potential accuracy.
This ratio uses only an empirical measure of risk, rather than an actual measure of the probability of loss or tail risk, as could be achieved with a parametric distribution, diminishing the potential accuracy.

Method used


Image

  • System and method for providing optimization of a financial portfolio using a parametric leptokurtic distribution
  • System and method for providing optimization of a financial portfolio using a parametric leptokurtic distribution
  • System and method for providing optimization of a financial portfolio using a parametric leptokurtic distribution

Examples


Embodiment Construction

System Overview

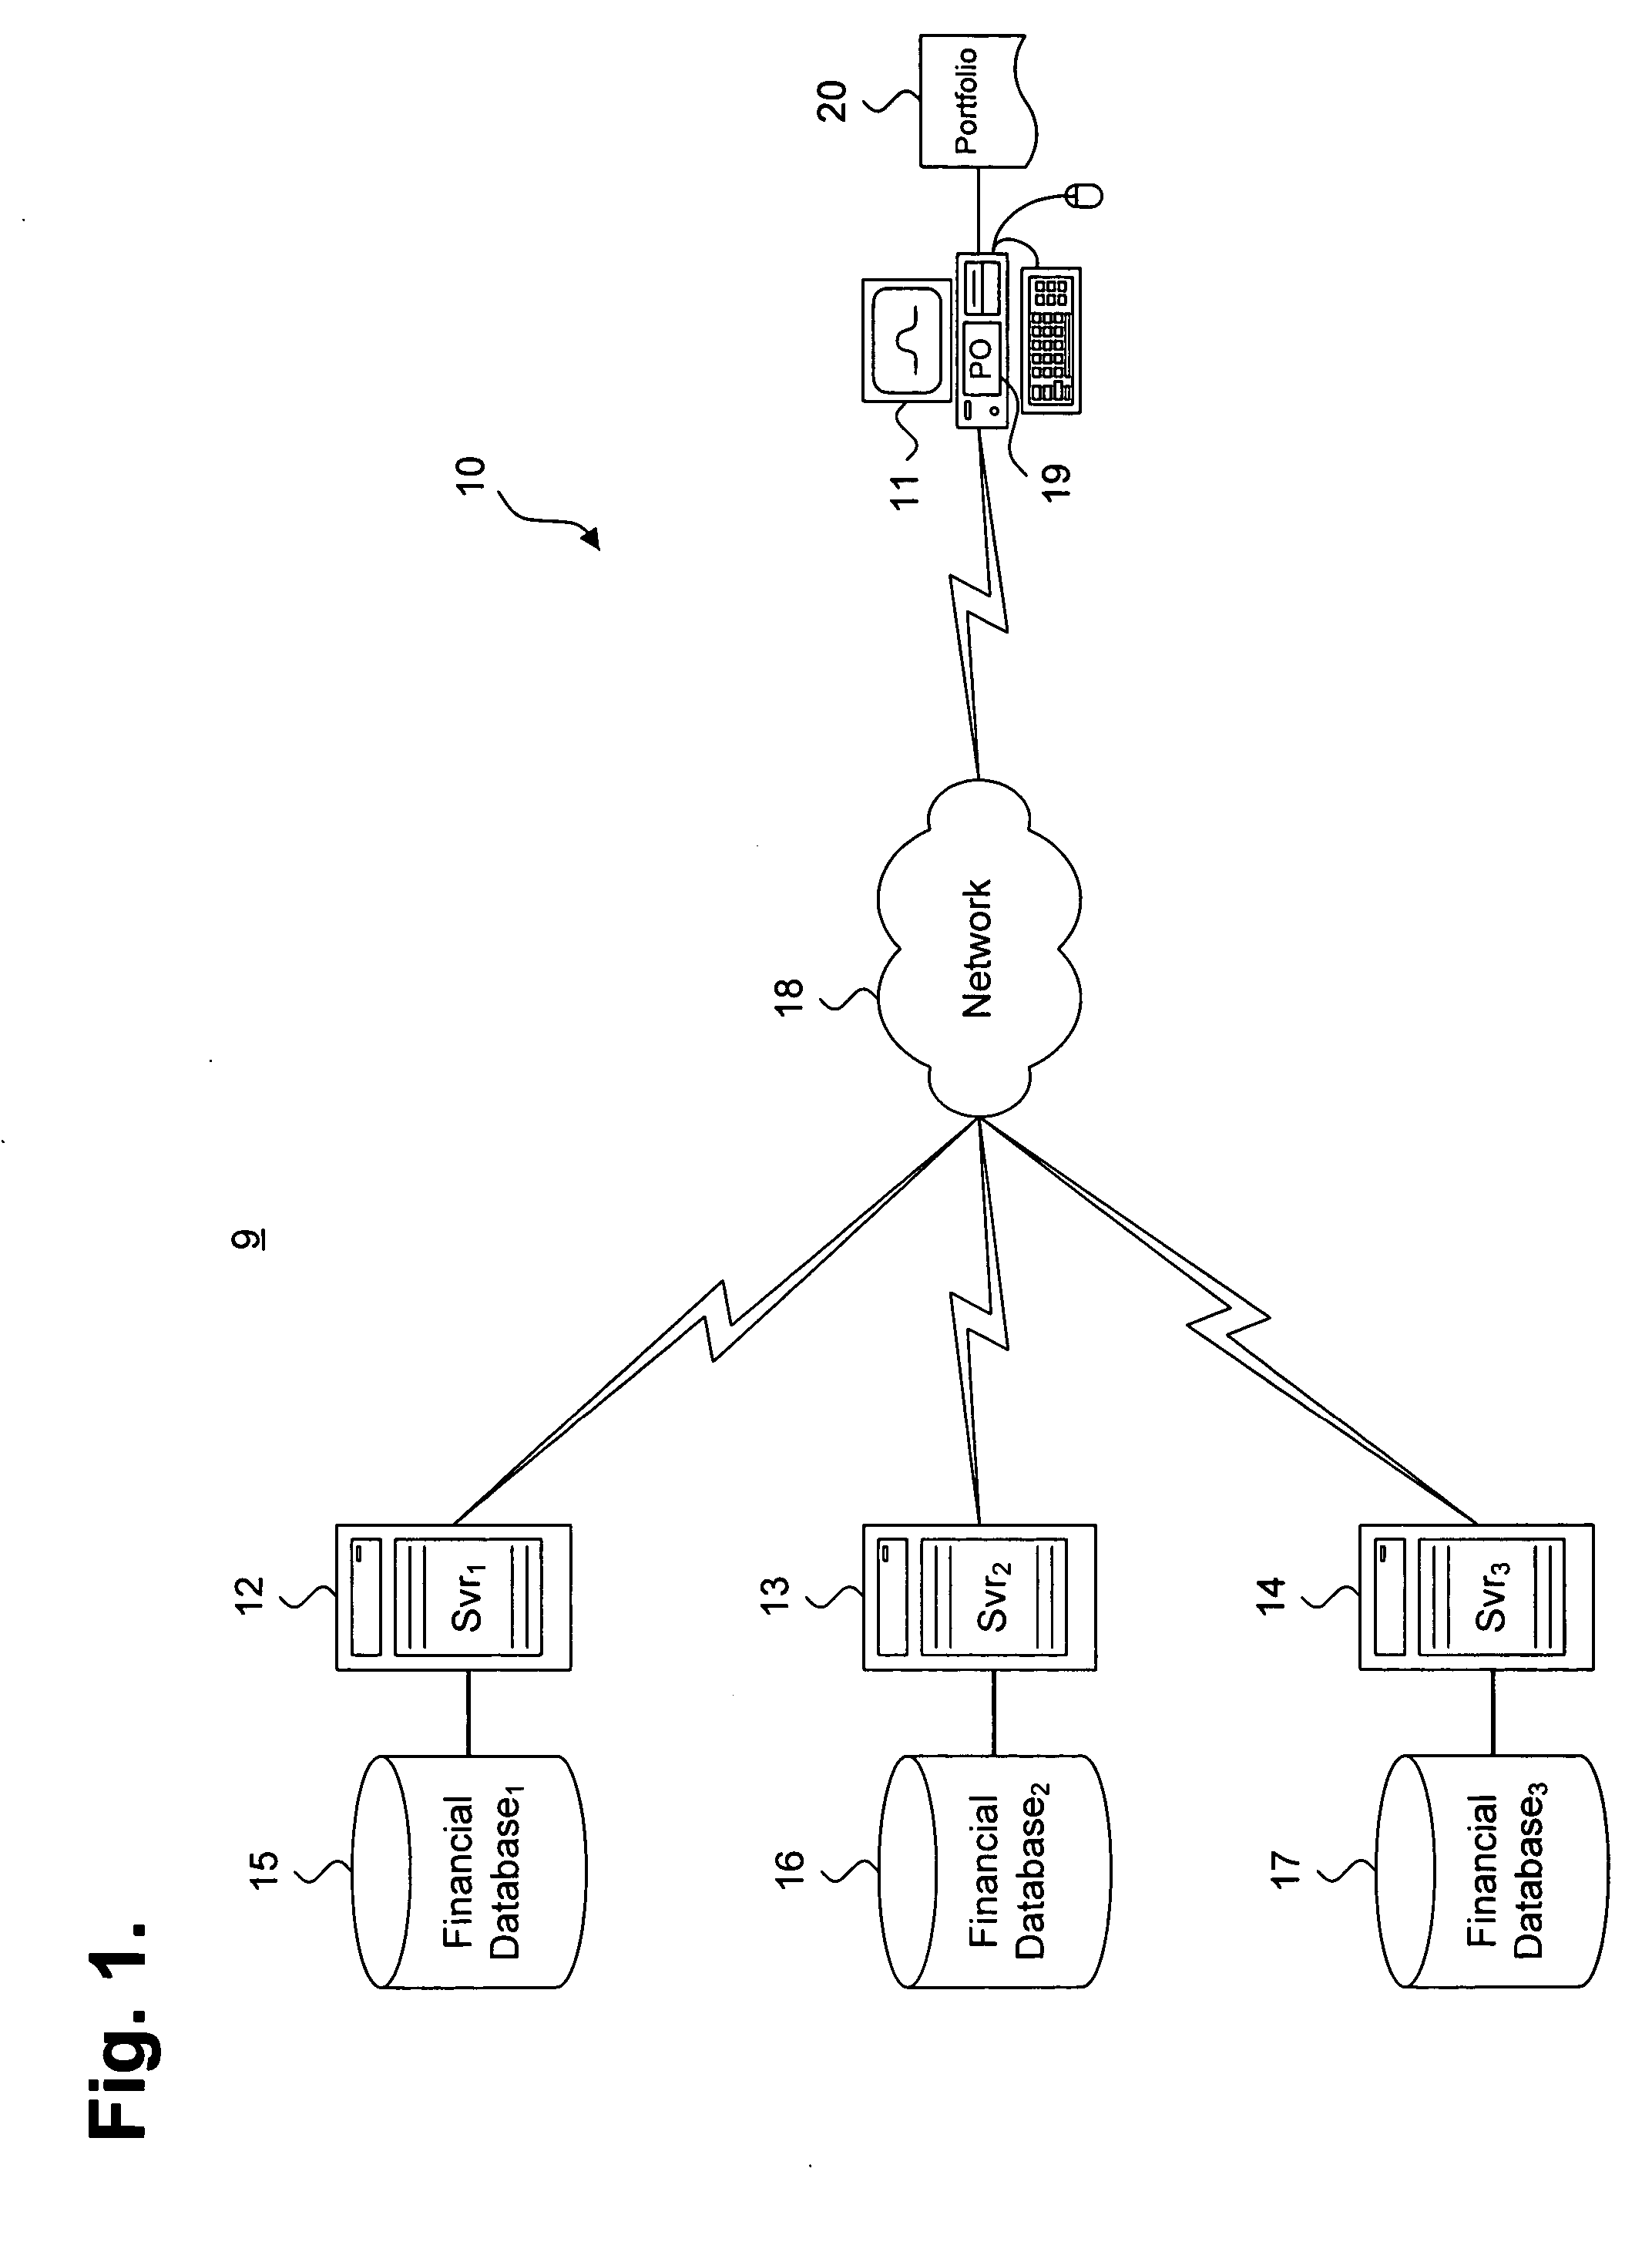
FIG. 1 is a functional block diagram 9 showing a system 10 for providing optimization of a financial portfolio 20 using a parametric leptokurtic distribution, in accordance with an embodiment of the invention. A workstation 11 is interoperatively interfaced to a plurality of servers 12-14 over a network 18, which can include an internetwork, such as the Internet, intranetwork, or combination of networking segments. In a further embodiment, the workstation 11 operates as a stand-alone determiner system without interfacing directly to other determiner systems, although data can still be exchanged indirectly through file transfer over removable media. Other network domain topologies, organizations and arrangements are possible.

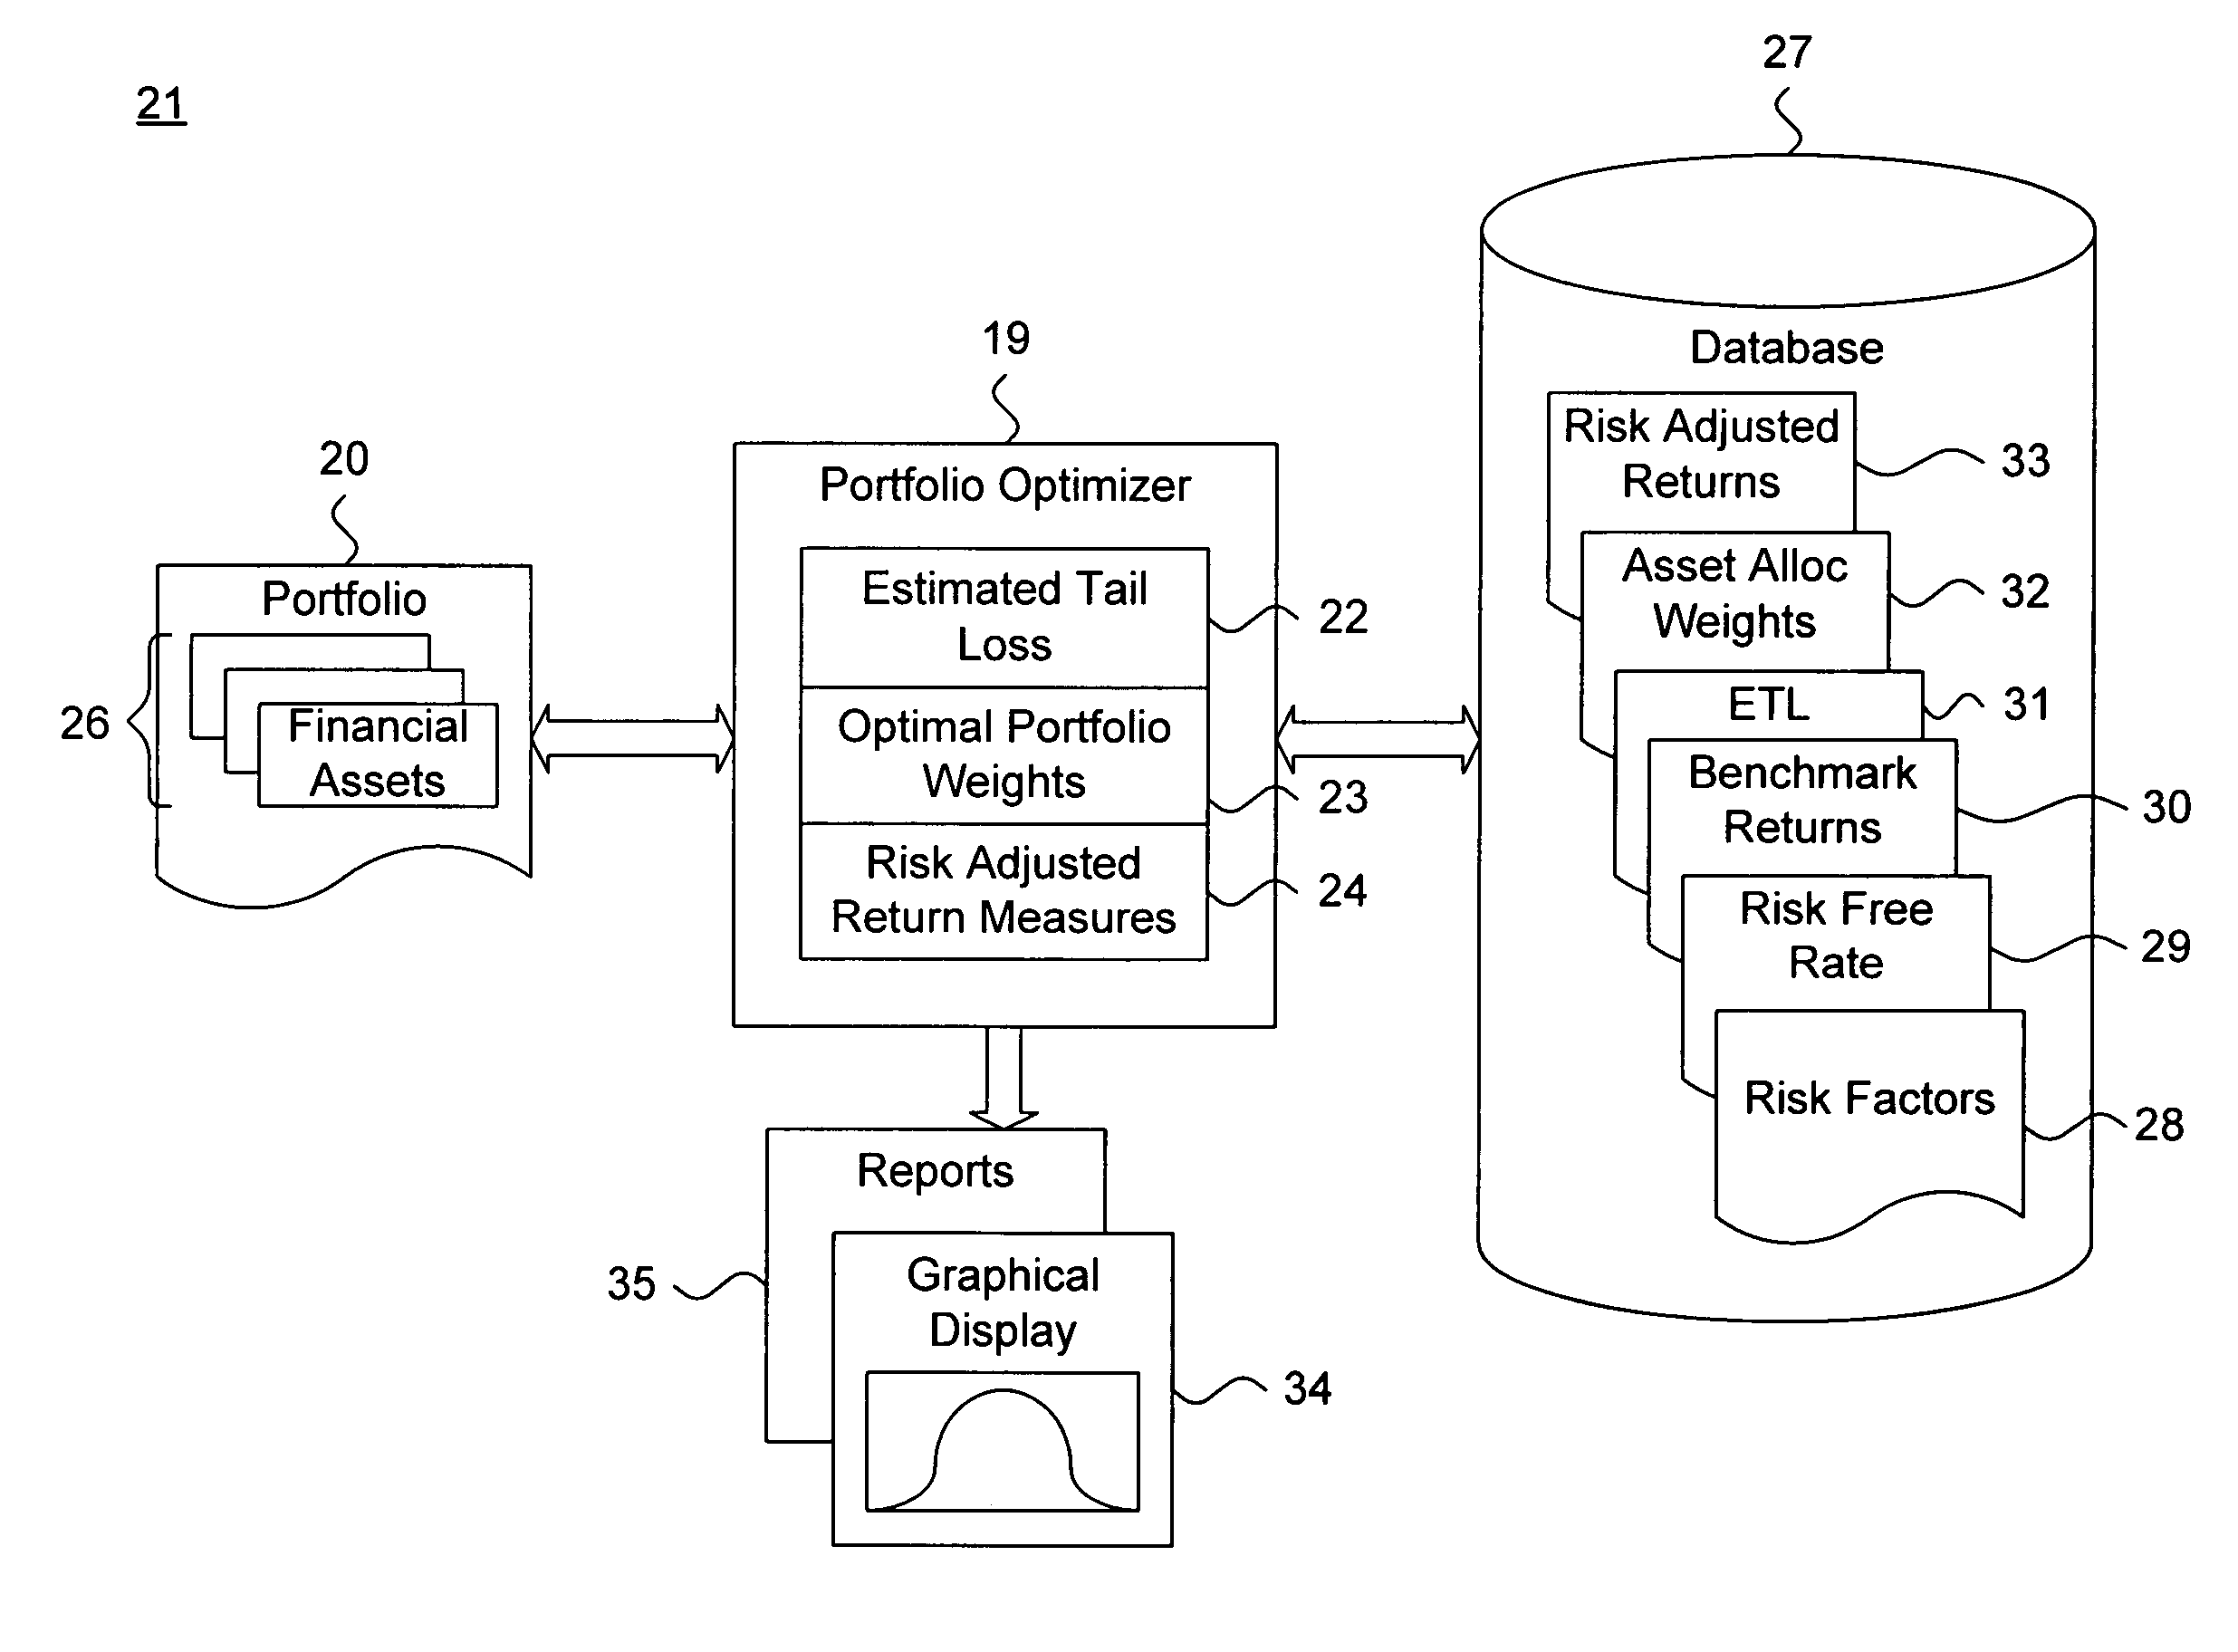
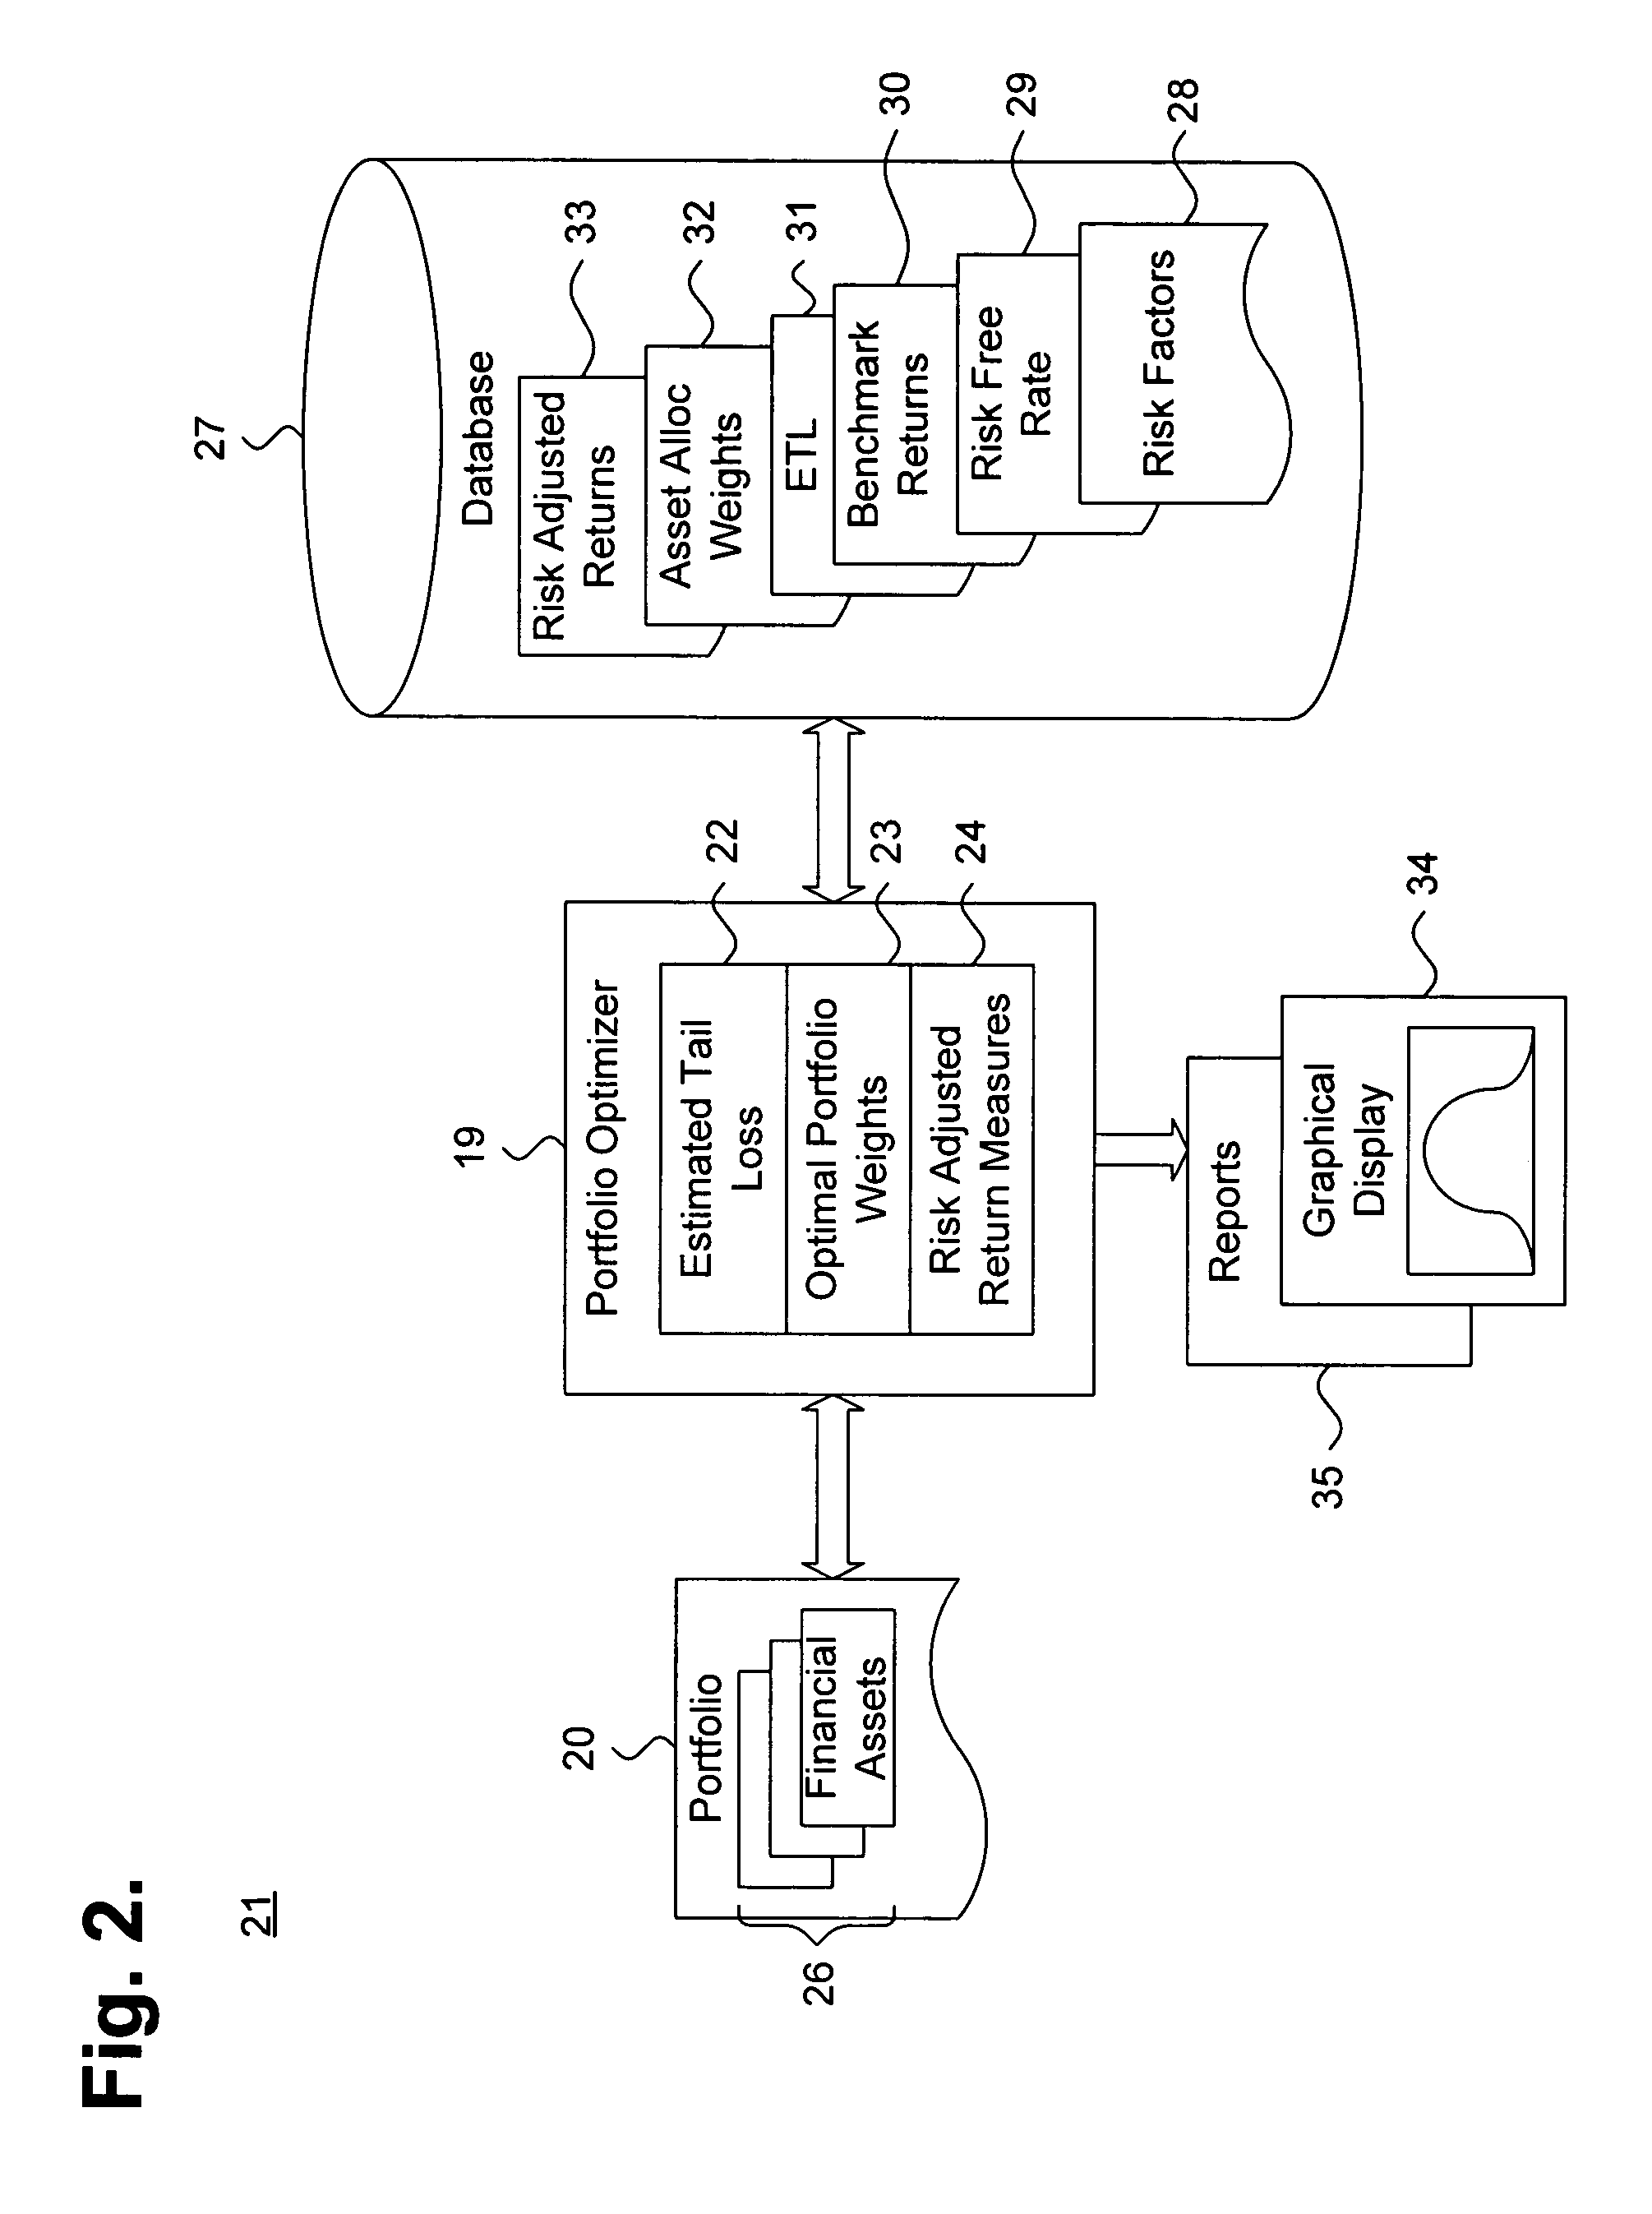
The workstation 11 includes a portfolio optimizer (PO) 19 that determines an optimal set of risk adjusted return for a portfolio of financial assets 20, as further described below beginning with reference to FIG. 2. The servers 12-14 each maint...


PUM


Abstract

A system and method for providing optimization of a financial portfolio using a parametric leptokurtic distribution is presented. One or more risk factors associated with a plurality of financial assets maintained in a portfolio and applicable over at least one time horizon are provided. A subordinated parametric distribution model having leptokurtic behaviors is specified for the risk factors with a measurement of risk expressed as a function of expected tail loss for a significance level or quantile. The subordinated distribution model is applied at each such time horizon to determine a distribution of the risk factors for the financial assets. Portfolio weights providing a substantially maximum risk adjusted return for the portfolio are determined.

Description

FIELD OF THE INVENTION The present invention relates in general to financial portfolio optimization and, specifically, to a system and method for providing optimization of a financial portfolio using a parametric leptokurtic distribution. BACKGROUND OF THE INVENTION An efficient financial portfolio provides the maximum risk adjusted return, which can be the greatest expected return for a given level of risk or the lowest risk for a given expected return. In general, risk can be measured symmetrically or asymmetrically. Symmetric risk measures include variance and standard deviation. Asymmetric risk measures include Value at Risk (VaR), which is a quantile of projected gains or losses over a target horizon, such as described in Jorion, P., “Value at Risk: the New Benchmark for Managing Financial Risk,” p. 22, McGraw Hill (2d ed. 2001), the disclosure of which is incorporated by reference. Risk adjusted return is one specific type of risk measure for gauging portfolio efficiency. Ri...

Claims


Application Information

Patent Timeline
Patent Type & Authority Applications(United States)
IPC IPC(8): G06F
CPCG06Q40/00G06Q40/06G06Q40/04
Inventor RACHEV, SVETLOZAR TODOROVRACHEVA-IOTOVA, BORYANA SVETLOZAROVASTOYANOV, STOYAN VESELINOVMARTIN, RICHARD DOUGLAS
Owner FINANALYTICA
Learn More