
Method for selecting representative endmember components from spectral data

a spectral data and endmember technology, applied in image enhancement, scene recognition, instruments, etc., can solve the problems of inability to provide routine and reliable results, inability to compare the endmembers determined through these processes to those derived by experts, and limited utility, so as to improve the complexity of data sets, improve the accuracy, and improve the cost

Inactive Publication Date: 2003-08-28
LEIDOS INC
View PDF3 Cites 9 Cited by
  • Summary
  • Abstract
  • Description
  • Claims
  • Application Information

AI Technical Summary

Benefits of technology

This process significantly reduces the time required to analyze spectral image data, making information readily available for decision-making and transforming it into interpretable layers that can be integrated into GIS databases, enhancing the utility of spectral imagery across various applications.

Problems solved by technology

Alternatively, complex statistical and mathematical approaches have been employed in order to perform endmember selection, but none have been shown to provide routine and reliable results.
The endmembers determined through these processes are physically meaningless and not comparable to those derived by expert users.
As such, their utility is limited and at best require subsequent subjective interpretation by an expert.
Current endmember selection methods are thus either manual with expert users doing the processing or automatic using signal processing, but with less reliable results that still require expert user interpretation.
Currently, the process of determining the number and nature of these spectrally distinct components (or "endmembers") using either the manual or statistical selection process is both subjective and labor intensive.
Because of this, SMA-based classification, although clearly of significant use in many applications, has largely been limited to labor intensive research projects.
Further, as the complexity of data sets increase, so does the time required to perform SMA as does the likelihood of greater error.

Method used


Image

  • Method for selecting representative endmember components from spectral data
  • Method for selecting representative endmember components from spectral data
  • Method for selecting representative endmember components from spectral data

Examples


Embodiment Construction

[0024] The following embodiments, though representing the best known mode of practicing the present invention, are not intended to be limited thereto. Based on the knowledge of one skilled in the art, variations of the following embodiments are intended to be part of the scope of the present invention.

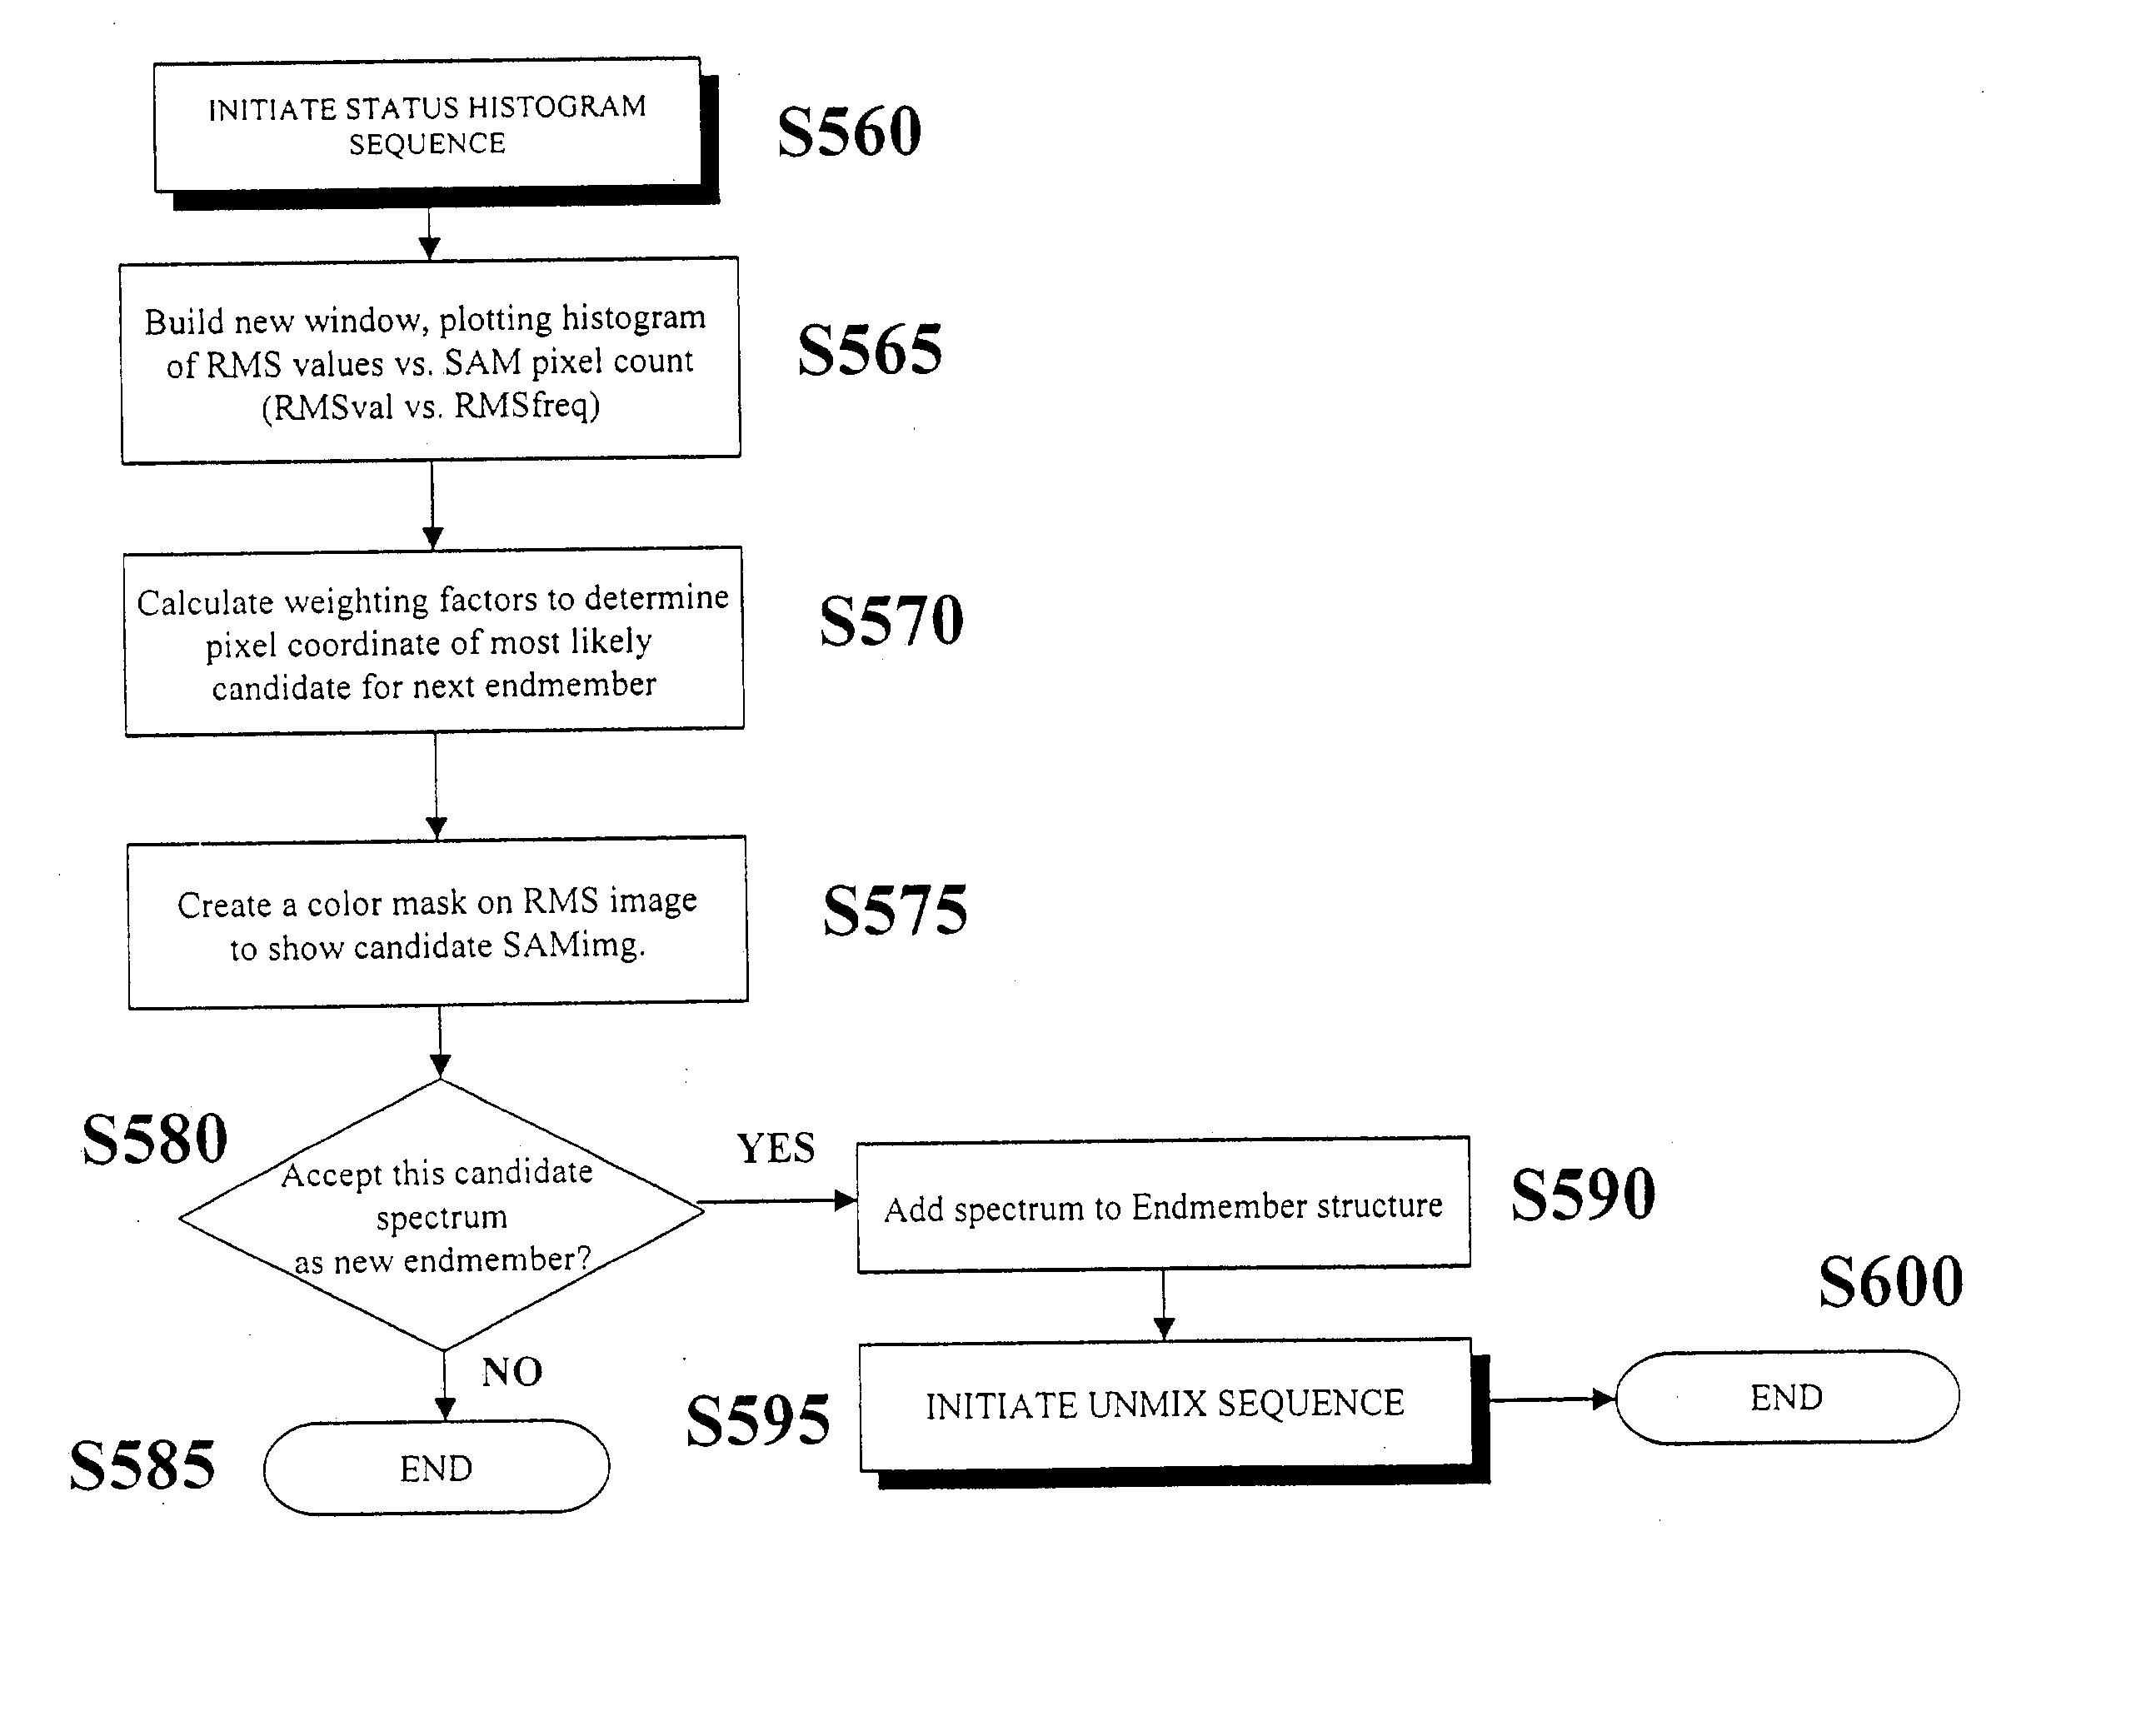
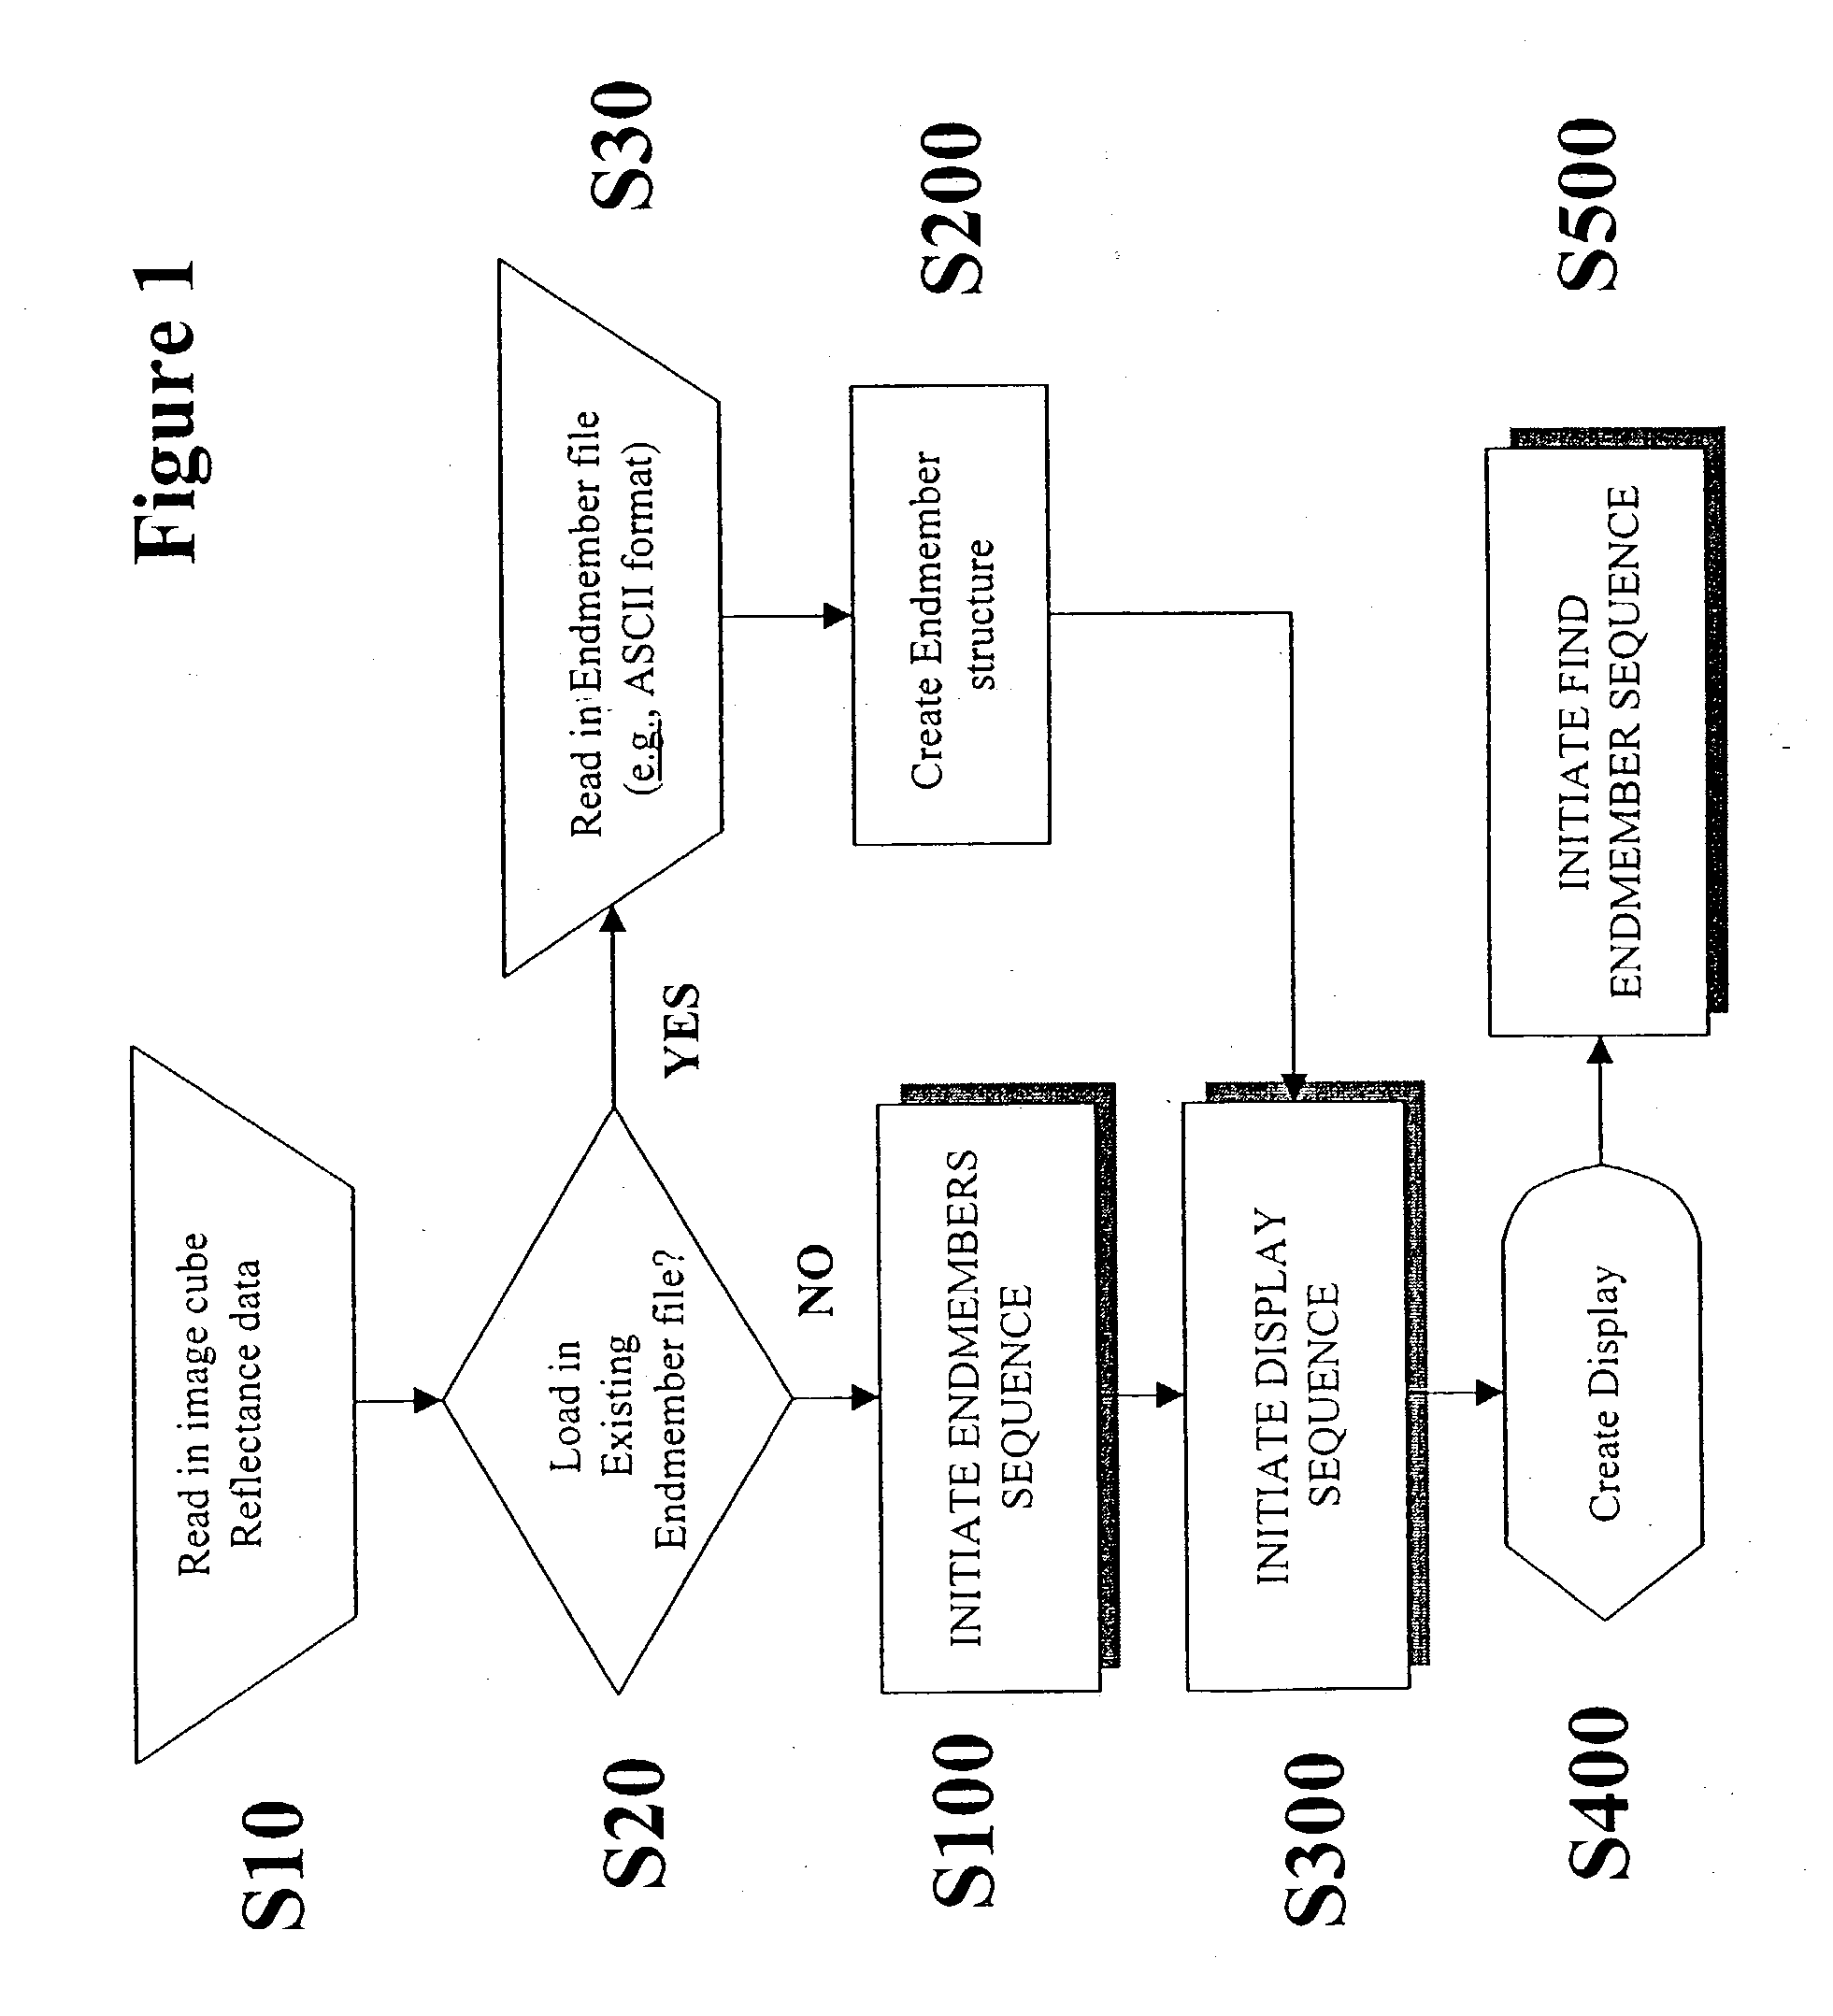
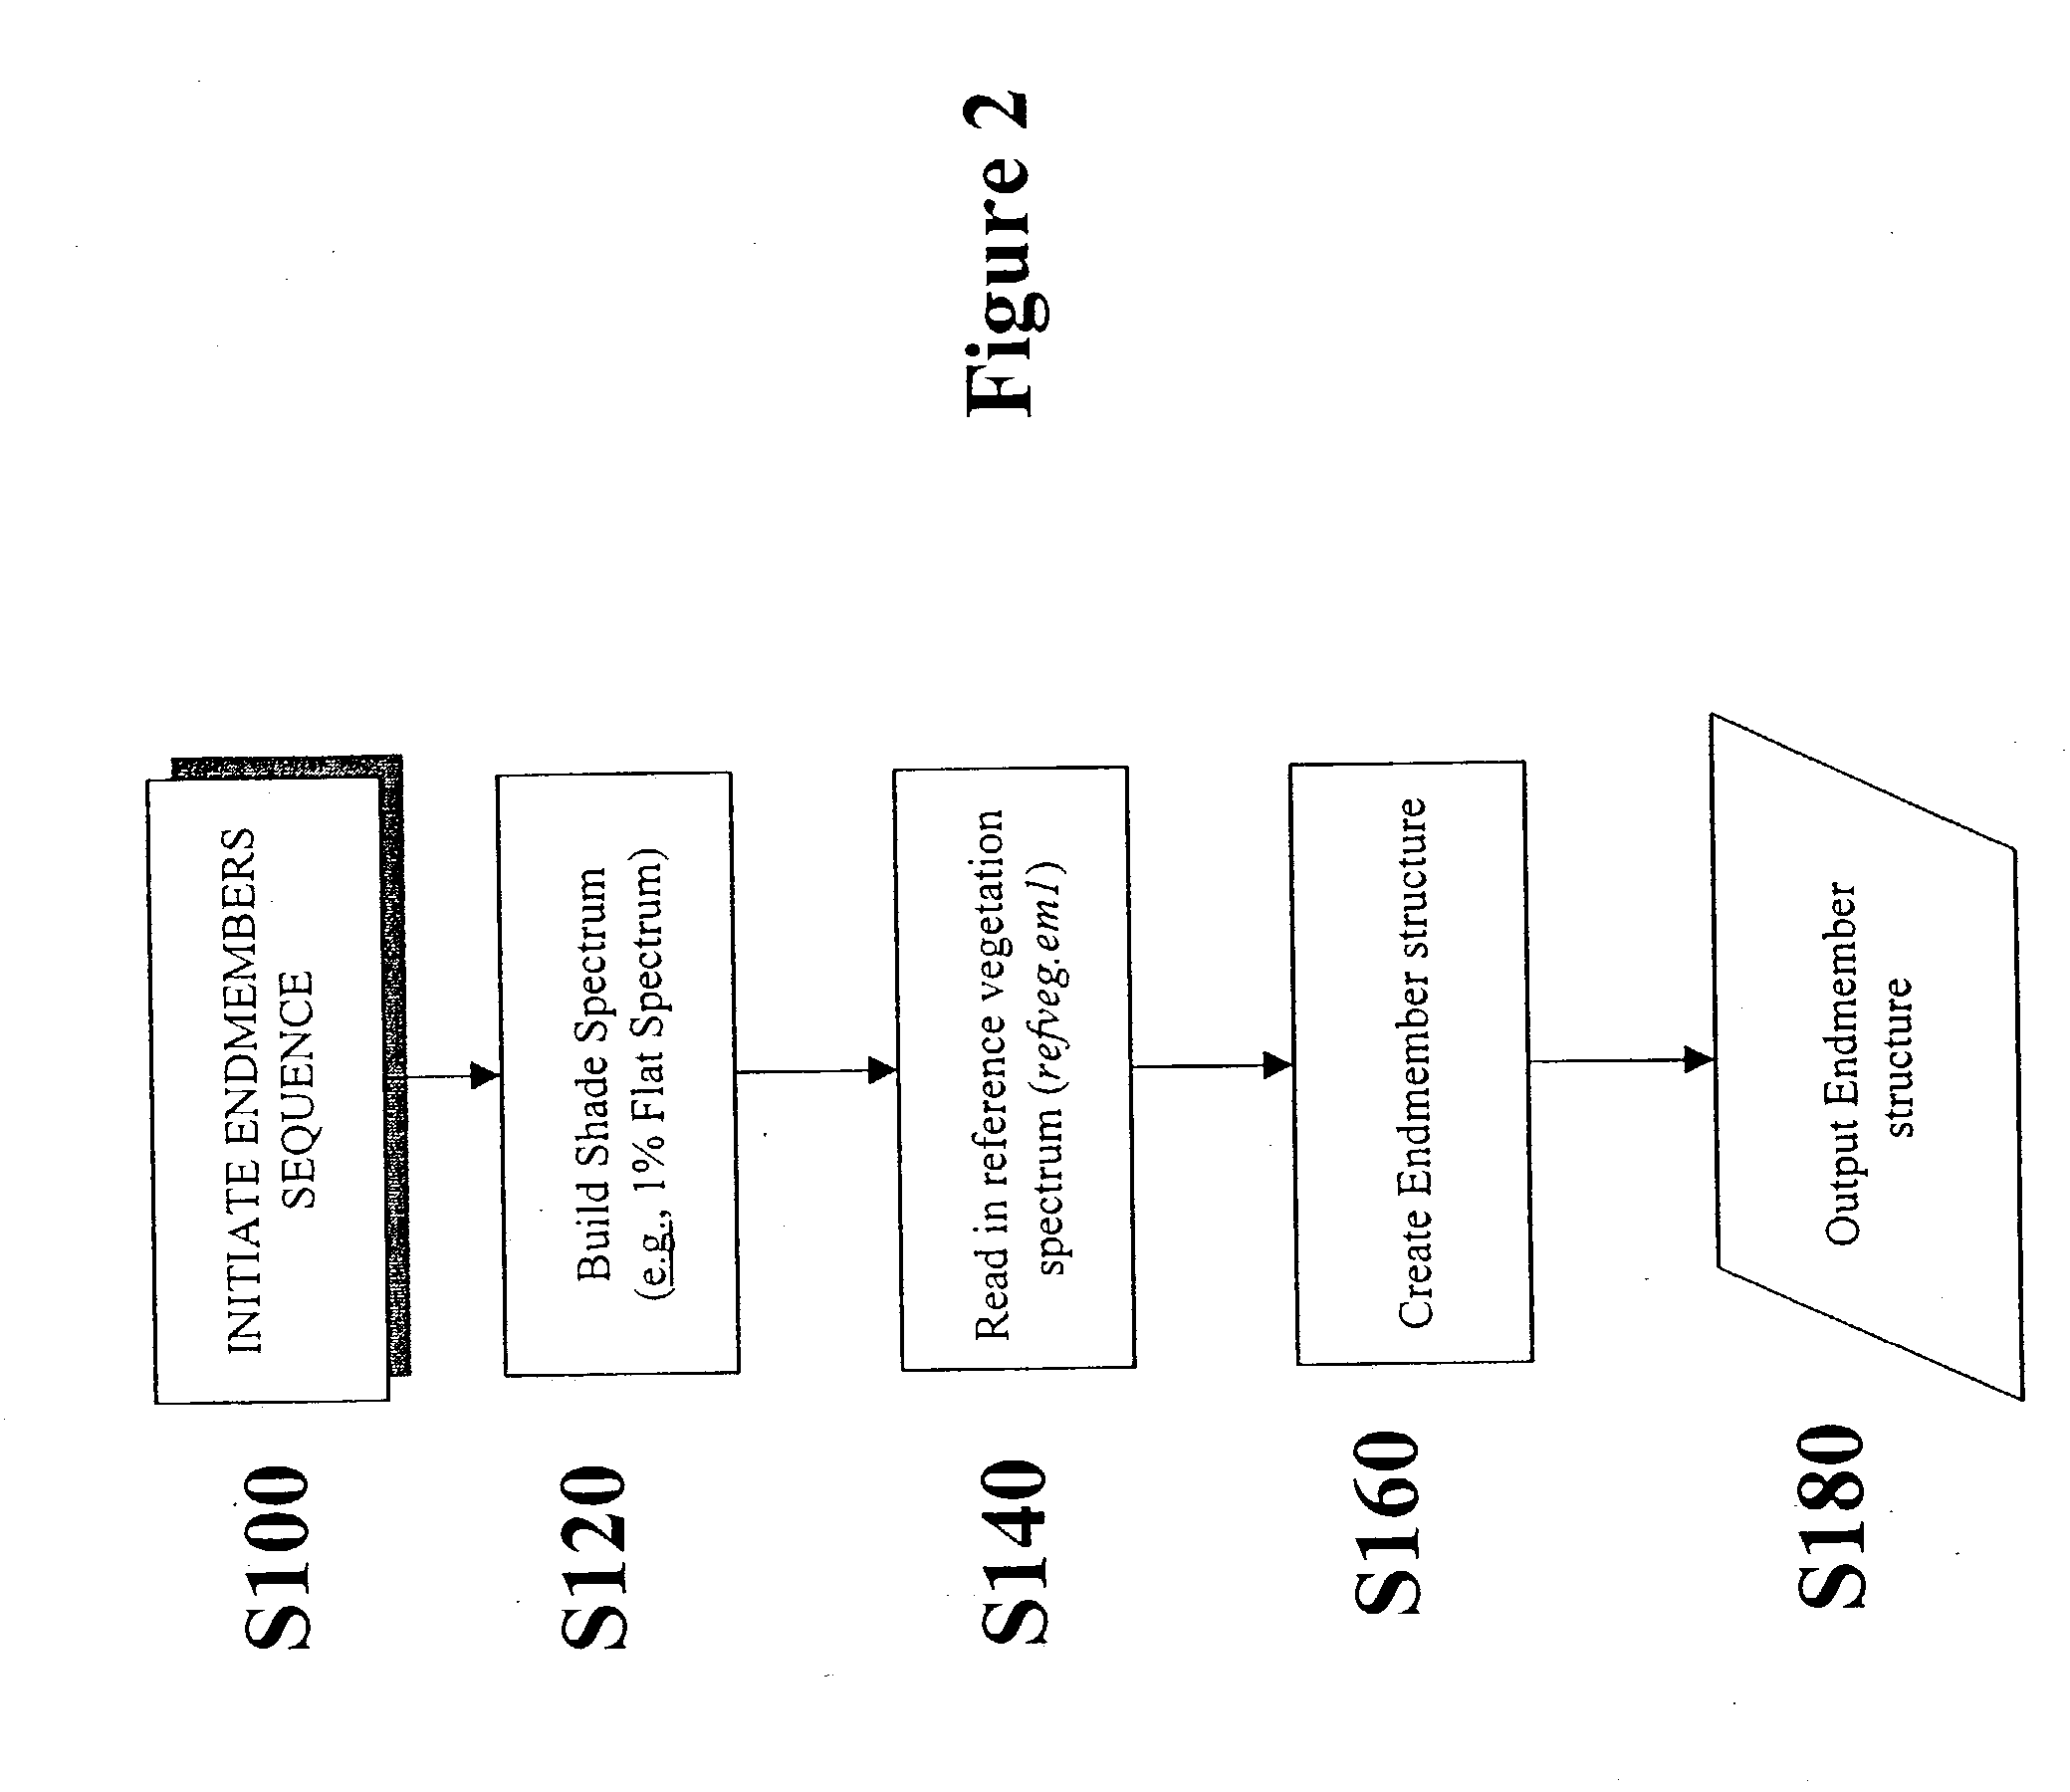
[0025] The flowchart of FIGS. 1-6 sets forth the general process steps for determining the land cover types, e.g, green vegetation (leaves, grass, etc.), non-photosynthetic vegetation ("NPV") (e.g., bark, wood, dry leaves), soils, snow, ice, roads, buildings, and shade, within a particular scene according to an embodiment of the present invention. Image cube reflectance, emission, or radiance data (hereafter "reflectance data") indicative of a scene is read into a processor S10. The scene boundaries are defined by, for example, a set of ground-based longitudinal and latitudinal coordinates. The reflectance data results from imaging performed by any of a number of sources, such as, sate...


PUM

PropertyMeasurementUnit
wavelengthaaaaaaaaaa
of reflectanceaaaaaaaaaa

Abstract

Described herein is a process for objectively and automatically determining spectral endmembers and transforming Spectral Mixture Analysis (SMA) from a widely used research technique into a user-friendly tool that can support the needs of all types of remote sensing. The process extracts endmembers from a spectral dataset using a knowledge-based approach. The process identifies a series of starting spectra that are consistent with a scene and its environment. The process then finds endmembers iteratively, selecting each new endmember based on a combination of physically and statistically-based tests. The tests combine spectral and spatial criteria and decision trees to ensure that the resulting endmembers are physically representative of the scene.

Description

[0001] 1. Field of the Invention[0002] The subject matter of the present invention generally involves spectral image analysis. More particularly, the present invention involves processes for determining representative scene components, or endmembers, from spectral imagery.[0003] 2. Description of the Related Art[0004] It has long been recognized that at spatial scales typical of remotely sensed data, the surface corresponding to a given pixel is rarely composed of a single physical component, but rather a combination of "sub-pixel" constituents. This mixed-pixel concept was developed into a quantitative model for interpretation of spectral images, Spectral Mixture Analysis ("SMA"). SMA involves an interactive selection and refinement of key components, or endmembers, to achieve an acceptable solution. The SMA model is based on the assumption that remotely sensed spectral measurements are mixed signatures, which vary across the scene as the relative proportion of each component chang...

Claims


Application Information

Patent Timeline
Patent Type & Authority Applications(United States)
IPC IPC(8): G01N21/31G06T5/00G06T5/50G06V20/13
CPCG01N21/31G06K9/0063G06T2207/30188G06T7/0004G06T2207/10036G06K9/624G06V20/13G06F18/2134
Inventor SUNSHINE, JESSICA MIRIAMTOMPKINS, STEFANIEMCNARON-BROWN, KELLIE SUE
Owner LEIDOS INC
Learn More