Eureka AIR delivers breakthrough ideas for toughest innovation challenges, trusted by R&D personnel around the world.

Systems and methods for visualizing and analyzing conditioned data

a technology of conditioned data and system, applied in the field of visualizing multiple dimensions, can solve the problems of hugely complex portals providing rich, highly customized services, capturing site activity, and conceptually simple but practically difficult problems

Inactive Publication Date: 2002-06-13
ADVIZOR SOLUTIONS
View PDF5 Cites 414 Cited by
  • Summary
  • Abstract
  • Description
  • Claims
  • Application Information

AI Technical Summary

Benefits of technology

[0026] This invention separately provides web site activity data visualization systems and methods that include a rich environment that helps users convert insights and decisions into action that creates value.
[0027] Various ones of these features of the web site activity data visualization systems and methods according to this invention are capable of working together to provide a powerful environment for web site analysis.
[0030] Various ones of these features of the web site activity data visualization systems and methods according to this invention are capable of working together to allow users to improving web site effectiveness to improve the customer experience, avoid abandoners, increase site stickiness, and provide up-selling opportunities.

Problems solved by technology

As web technology has matured, web sites have progressed from static "information distribution" sites to hugely complex portals providing rich, highly customized services.
Although the technology, channel, and medium have changed, the underlying business problems, such as: "How do I identify new prospects?"
The e-business challenge is then how best to exploit this exceedingly rich new information source.
The first problem, capturing site activity, is conceptually simple but practically difficult.
However, processing web site activity logs quickly becomes non-trivial.
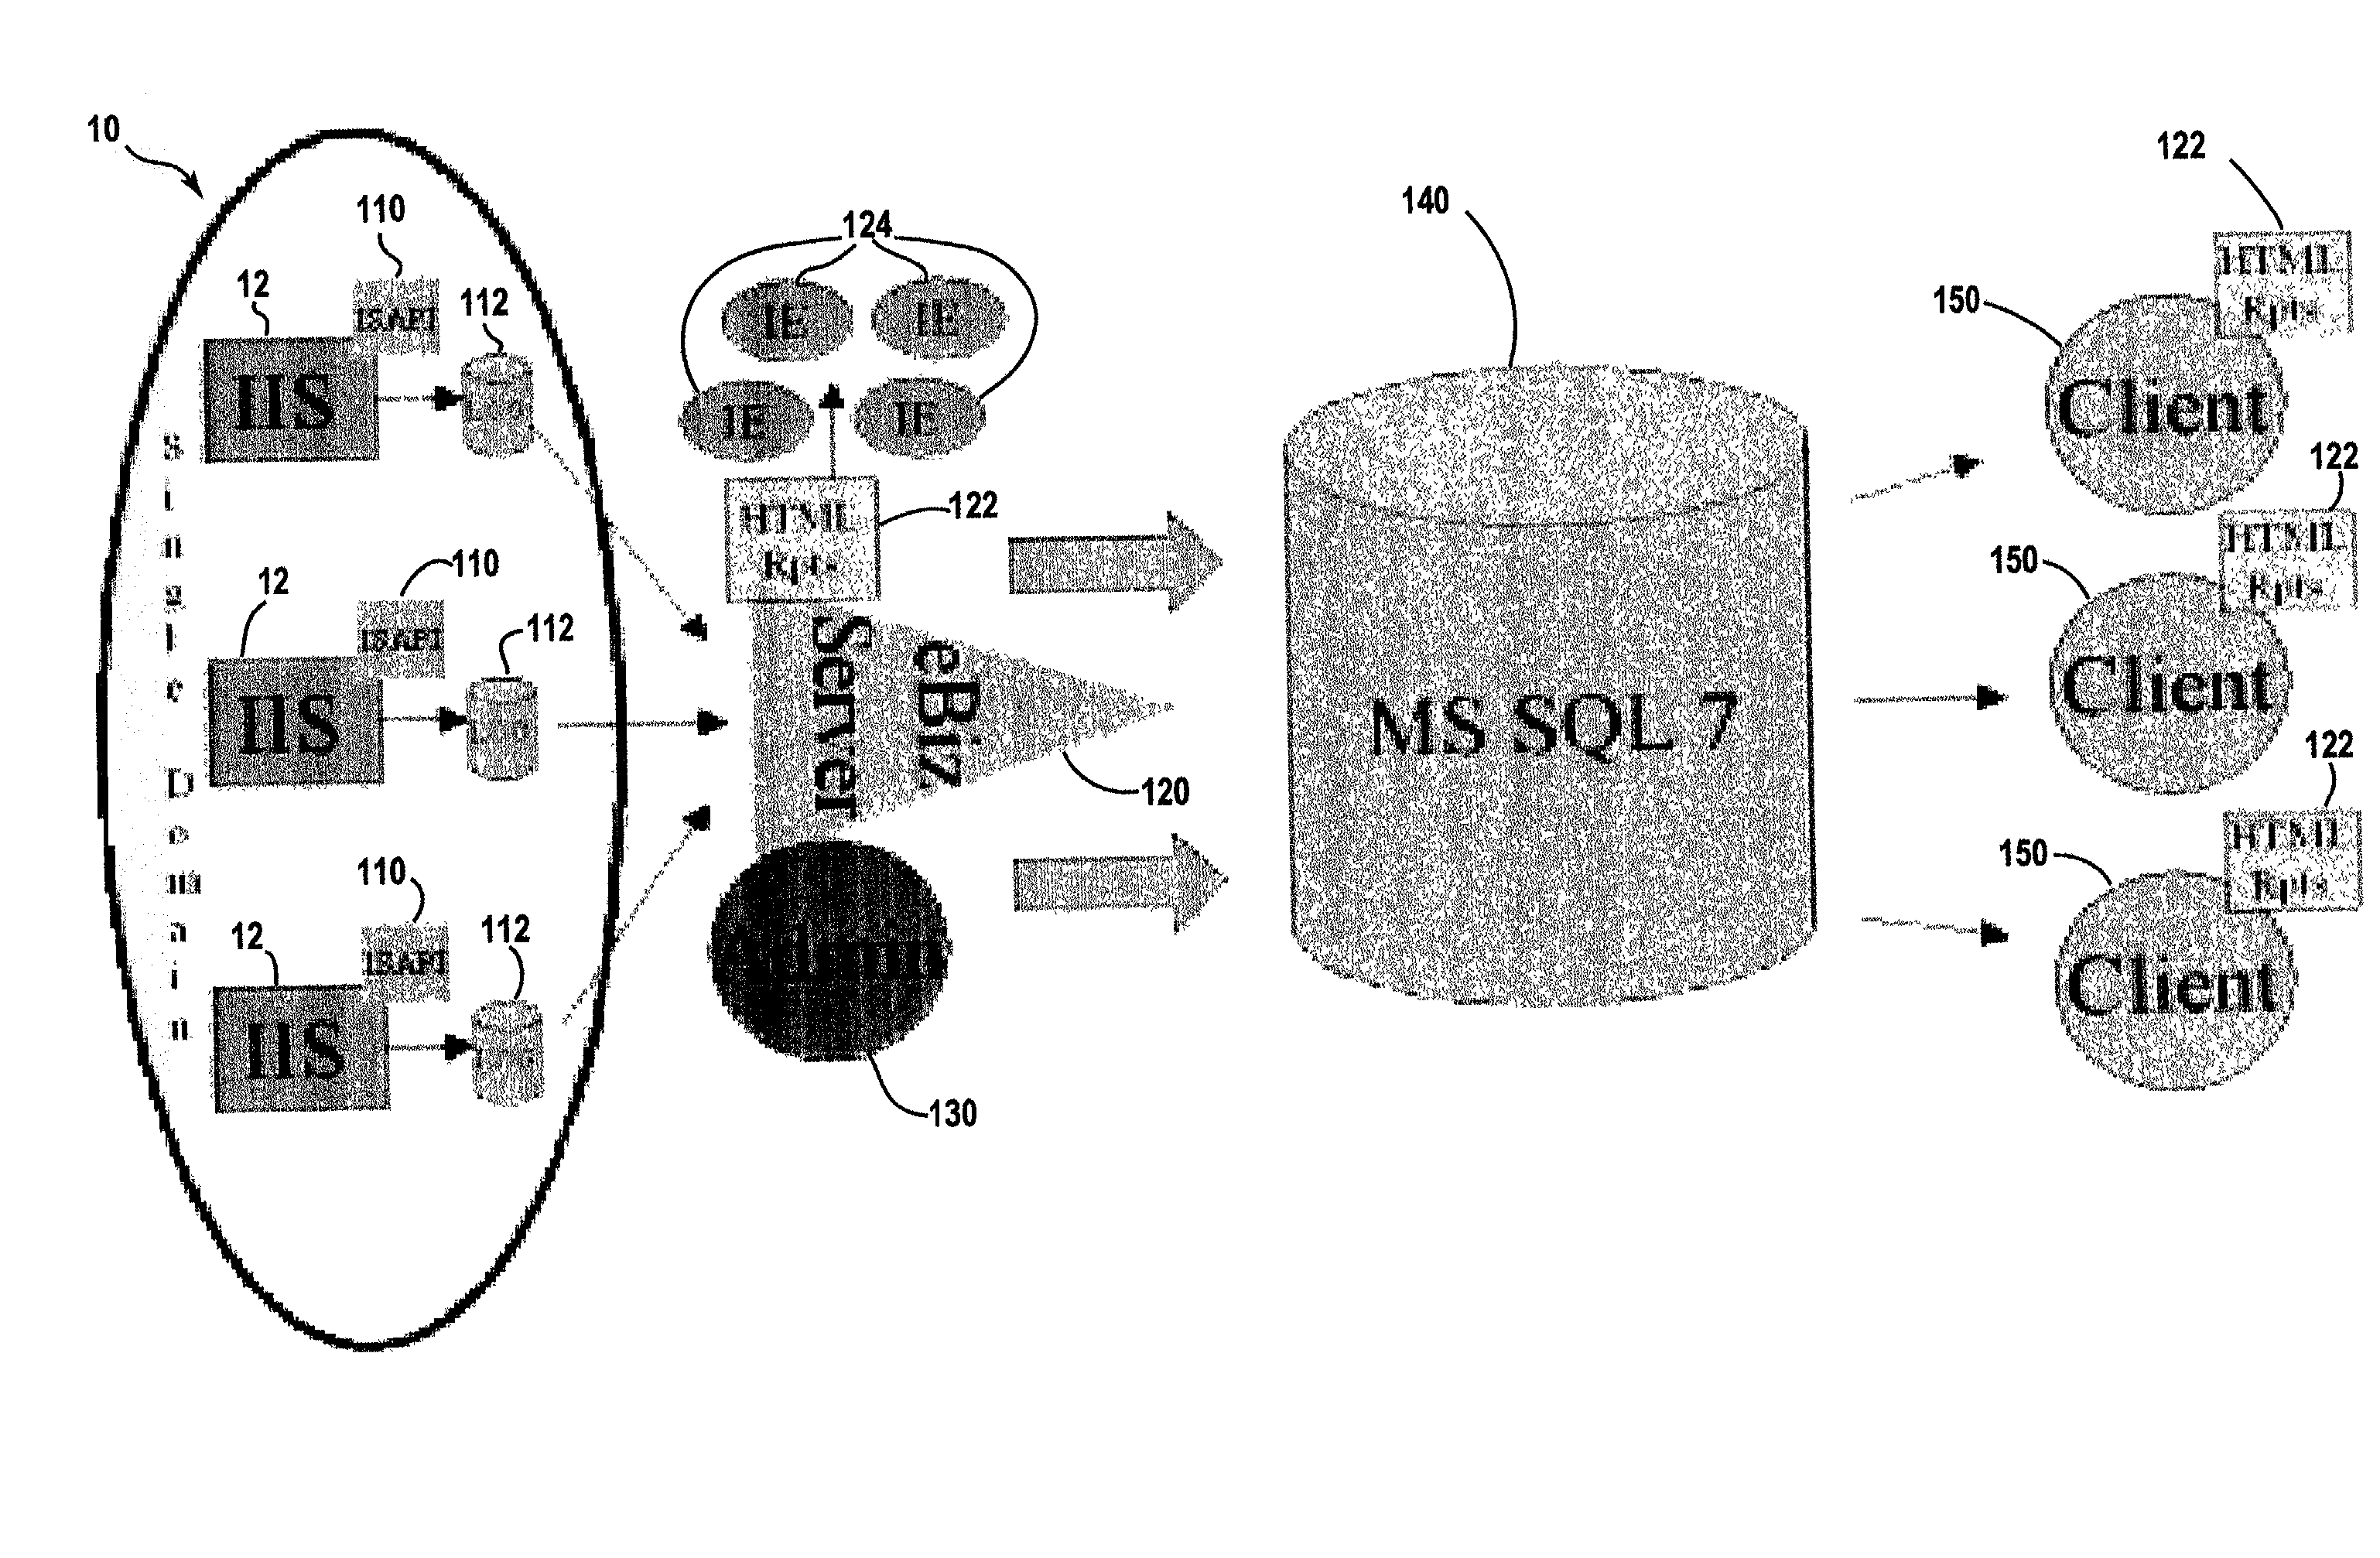
The engineering challenge that these tools address is how to collect, process, store, and report on high-volume web site activity.
It was a huge problem just to cope with all the different web log formats and assemble the information into a coherent schema.
For a variety of reasons, including data cleanliness, scalability, efficiency of the relational method, difficulty in building schemas, and computational complexity, analyzing, understanding, and making business decisions using raw relational tables is difficult.
Unfortunately, the relational model and the standard interface of the structured query language (SQL) used to manipulate relational tables, as described in A Guide to the SQL Standard, C. J. Date et al, Addison-Wesley, Reading, Mass., 1997, are not well-suited for analysis tasks.
Furthermore, the textual reports and static graphics, such as bar or pie charts, generated from such parsed web site activity logs are hard to understand, particularly for large tables.
Users usually find it difficult, if not impossible, to see patterns, discover trends, and / or find relationships between various web site activity measures.
Seemingly simple analysis tasks, such as identifying the three largest cells, locating the two rows with the smallest totals, or finding the biggest growth trends, are time consuming and tedious.

Method used


Image

  • Systems and methods for visualizing and analyzing conditioned data
  • Systems and methods for visualizing and analyzing conditioned data
  • Systems and methods for visualizing and analyzing conditioned data

Examples


Embodiment Construction

[0081] The conditioned data visualization systems and methods of this invention are described in summary above and in detail below using exemplary embodiments that are directed to visualizing web site activity log data. However, it should be appreciated that, the conditioned data visualization systems and methods of this invention are more generally directed to visualizing any previously conditioned data. In general, raw data is "conditioned" by parsing and / or mining the raw data to place, i.e., condition, the raw data into a database structure. In general, the database structure conditions the parsed and / or mined data by storing measure data for different dimensions into database fields associated with those dimensions, and by organizing the various dimension fields for a defined unit of the data into a database record.

[0082] As discussed above, the first generation web site reporting tools focused on data collection and reporting. These first generation tools produced literally hu...


PUM


Abstract

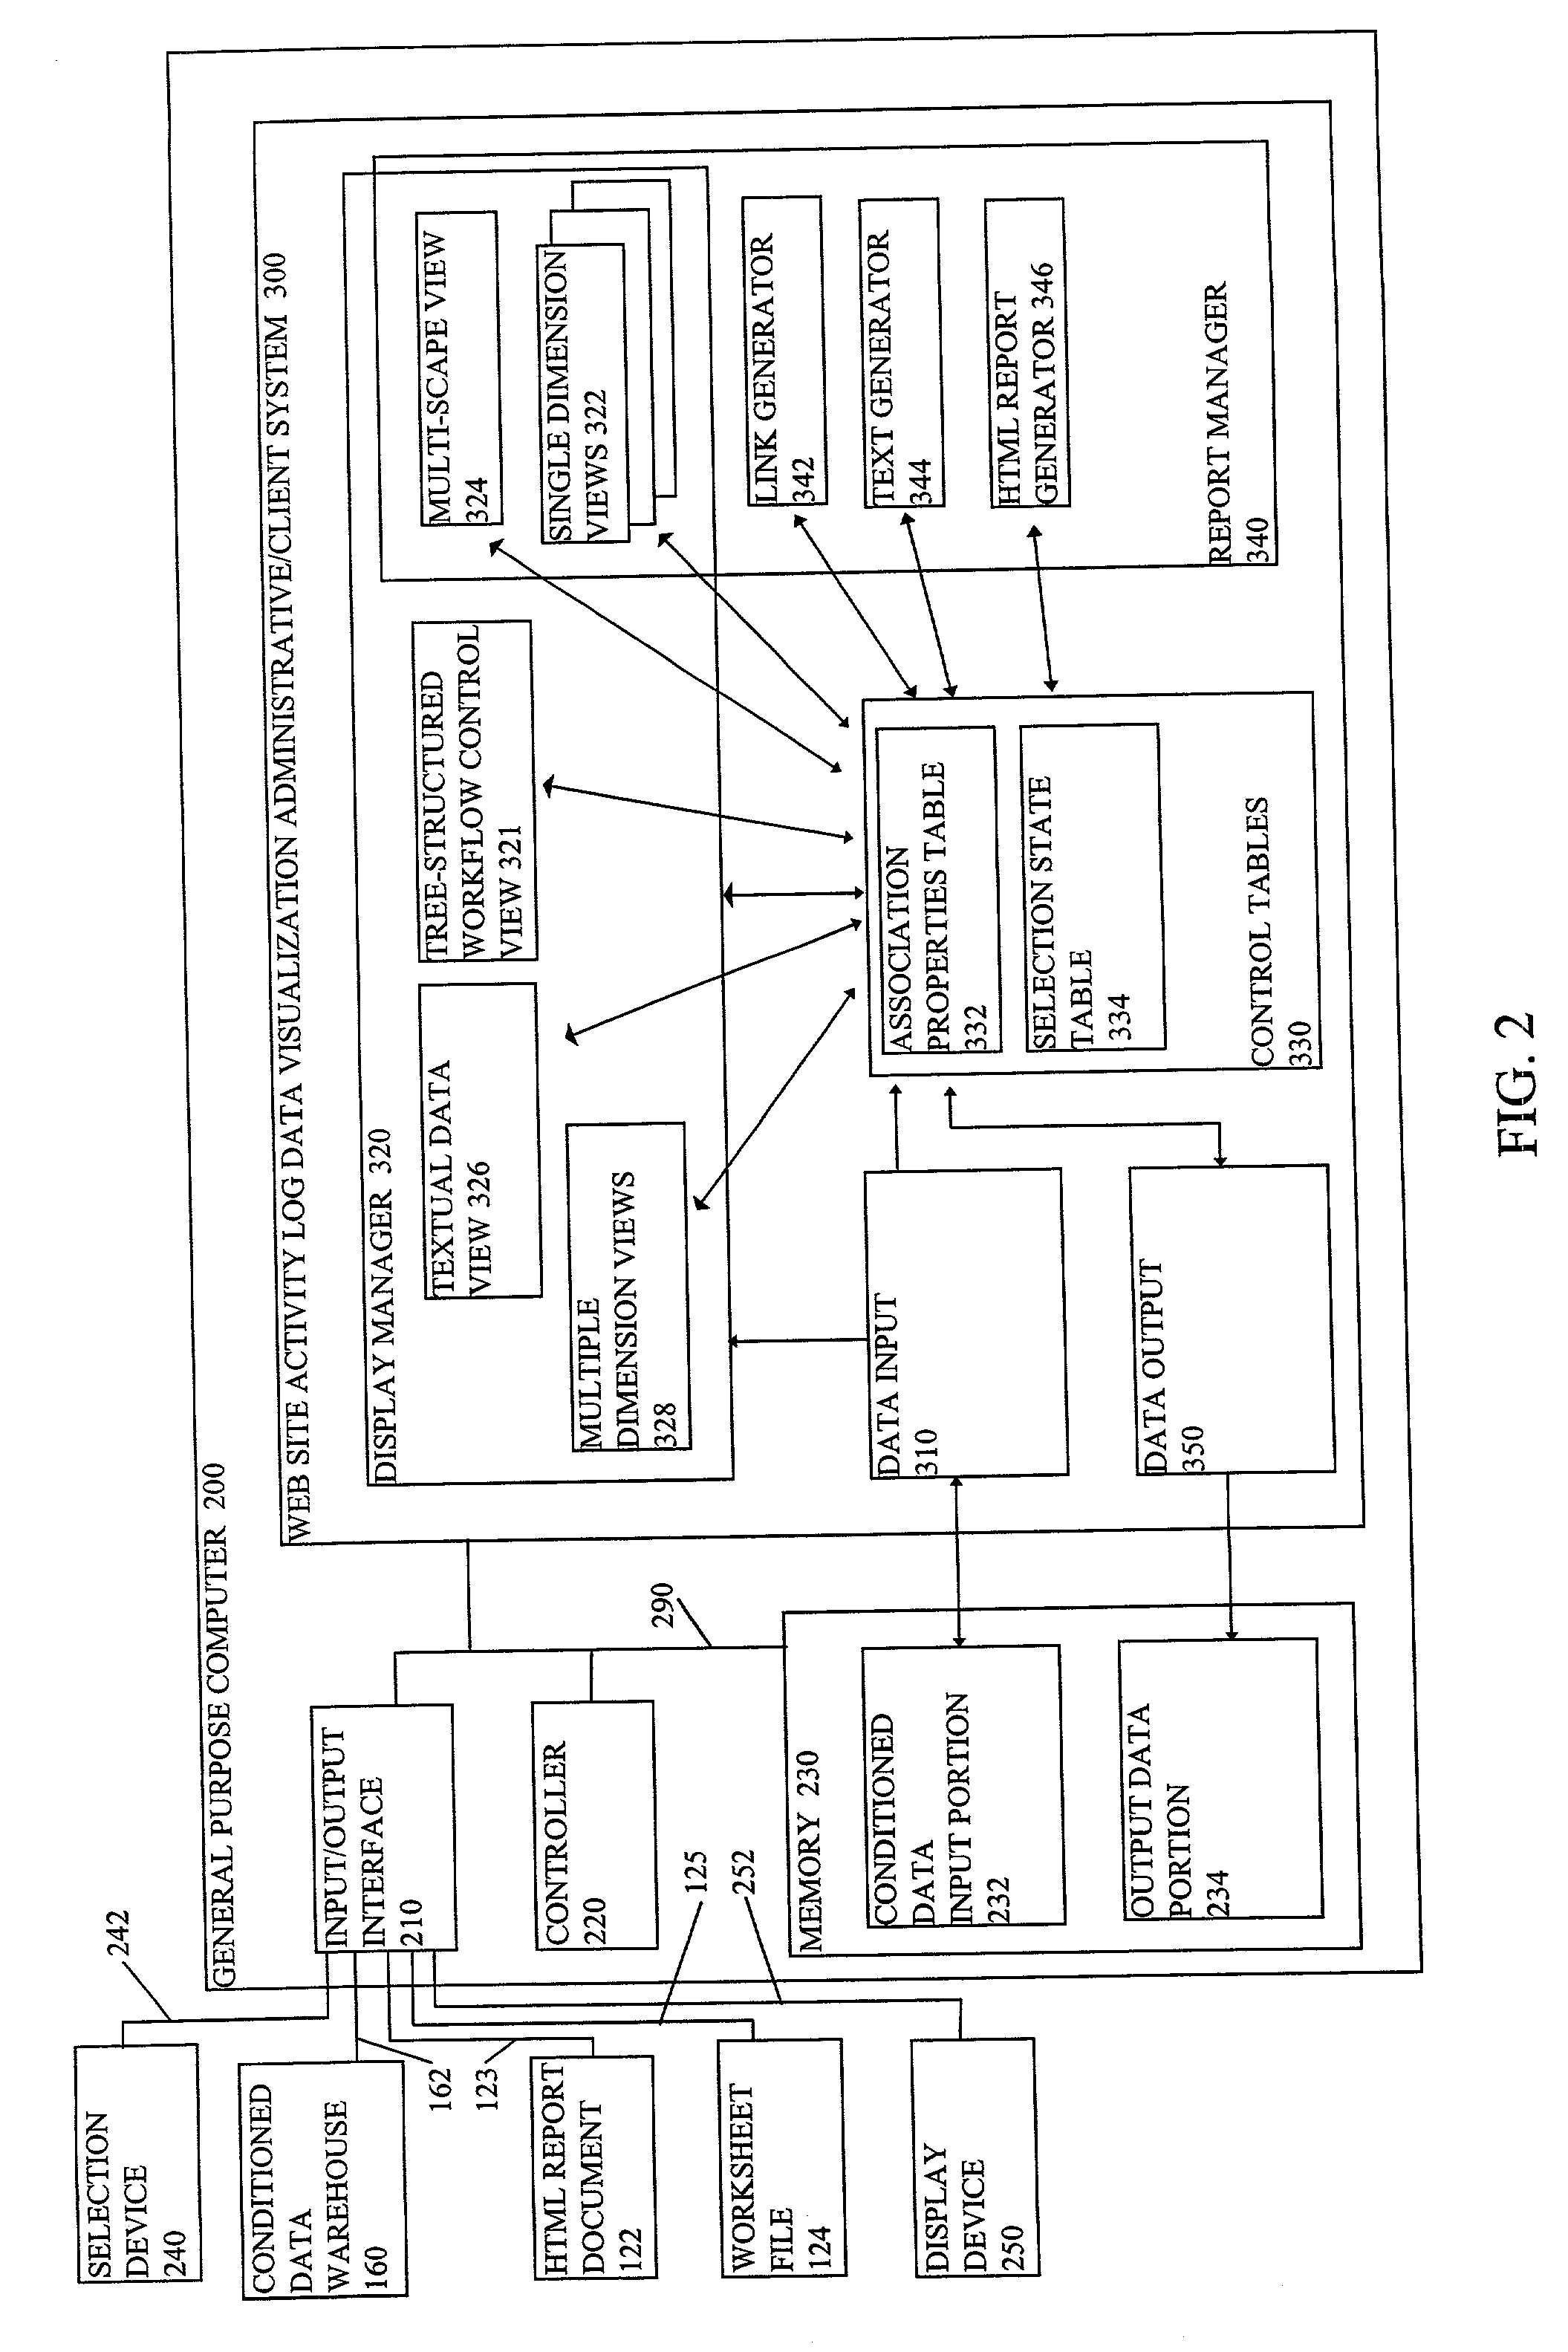
A tree-structured workflow control and a tree-structured report selection control allow users to easily display data and generate reports, without having to actively determine the various measures and dimensions to be displayed in various interactive views of the data and various simple and advanced reports. By linking predetermined sets of dimensions, measures and views to predetermined workflow control entries and report selection entries in a tree structure having labels on the branches and leaves that are logically related to the associated predetermined sets, the user can immediately obtain a data visualization perspective or a report without having to actively select the particular dimensions and measures for display, and without having to actively arrange the selected dimensions into a multi-dimensional view. The user can also alter the particular dimensions and / or measures being displayed and associate the user's selection with a new predetermined entry in the tree-structured workflow and report selection controls.

Description

[0001] 1. Field of Invention[0002] This invention relates to visualizing multiple-dimension data obtained from web site activity logs.[0003] 2. Description of Related Art[0004] One of the most exciting trends of our time is the explosive growth of the Internet, web sites, and e-commerce. This trend has manifested itself with the creation of millions of web sites, the widespread emergence of e-commerce sites, the birth of a huge number of "dot coms", and the merging of brick and mortar and cyberspace business models. As web technology has matured, web sites have progressed from static "information distribution" sites to hugely complex portals providing rich, highly customized services.[0005] For many companies, e-commerce web sites have become a significant, if not the primary, distribution channel for a company's products and services. With this transition from a traditional brick and mortar economy to a new self-service economy, web sites are becoming a focal point for customer int...

Claims


Application Information

Patent Timeline
Patent Type & Authority Applications(United States)
IPC IPC(8): G06Q10/10G06Q30/02
CPCG06Q30/02G06Q10/10
Inventor BARG, TIMOTHY A.EICK, STEPHEN G.MARTIN, JONATHAN C.SWANSON, WILLIAM C.SMITH, RONALD D.WHITMORE, DARRYLRIVARD, KURT D.
Owner ADVIZOR SOLUTIONS
Why Eureka
Eureka Blog
Learn More