
Multi-modal imaging of blood flow

a multi-modal imaging and blood flow technology, applied in the field of mapping blood flow, can solve the problems of low sensitivity, low resolution, and certain risks

Active Publication Date: 2018-10-02
THE MCLEAN HOSPITAL CORP
View PDF6 Cites 0 Cited by
  • Summary
  • Abstract
  • Description
  • Claims
  • Application Information

AI Technical Summary

Benefits of technology

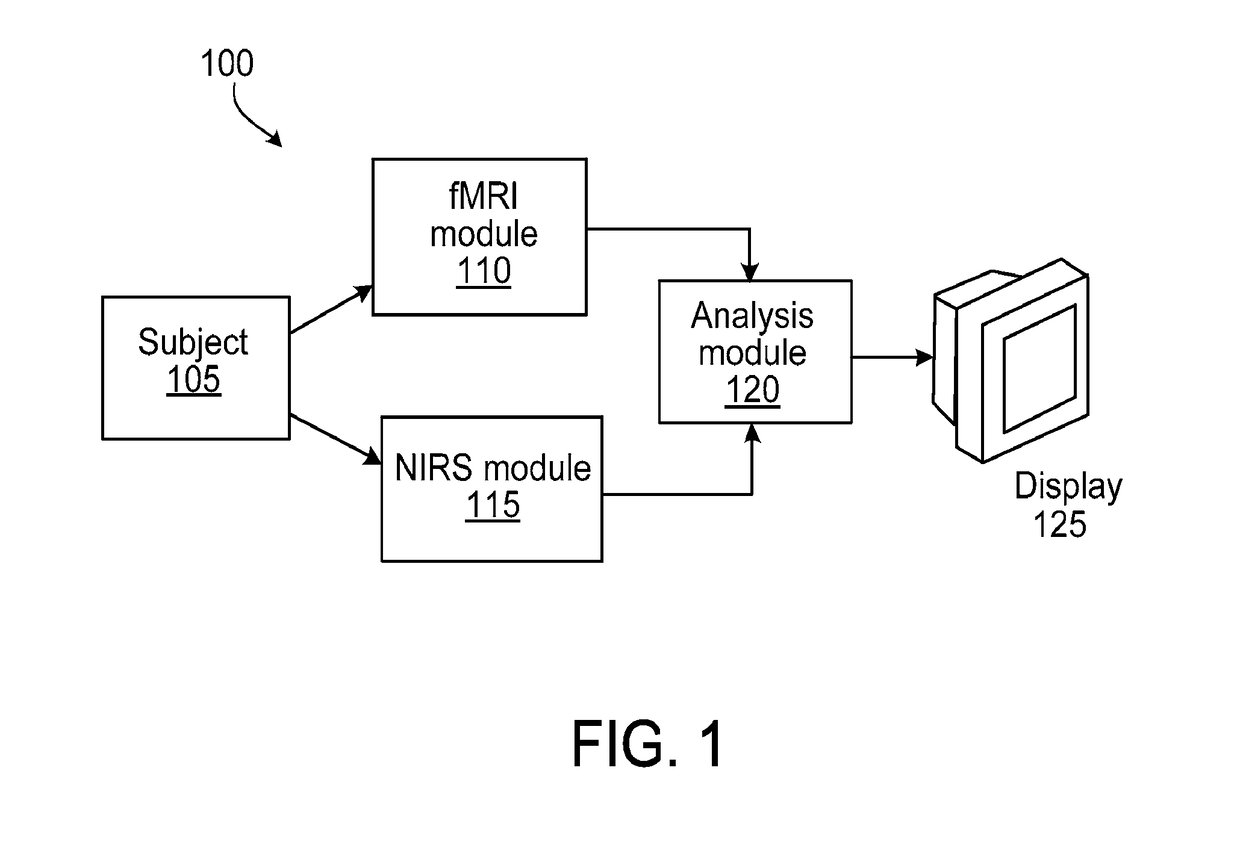
The new methods and systems described in this patent provide better ways to measure blood flow and volume. They can use fMRI data along with low-cost NIRS systems, allowing for high-resolution mapping of various parameters related to blood flow. This technology can be useful in diagnostic and therapeutic procedures, such as measuring brain perfusion.

Problems solved by technology

In some cases, blood flow is measured using MRI based methods that use exogenous contrast agents such as gadolinium to track blood through an organ, which can have certain risks.
Such methods suffer from low sensitivity, low resolution, and a limitation on the duration of time that blood can be tracked due to loss of coherence of tagged blood.

Method used


Image

  • Multi-modal imaging of blood flow
  • Multi-modal imaging of blood flow
  • Multi-modal imaging of blood flow

Examples


example 1

[0081]In this example, the high temporal resolution of NIRS (about 80 ms) was combined with the high spatial resolution of fMRI (about 3.5×3.5×4 mm) to investigate the physiological origin of LFOs detected by both modalities in human brain during a resting state of a subject. The goals of the resting state study were: 1) to examine the temporal and spatial characteristics of LFOs as measured with NIRS; 2) to determine the spatial extent of NIRS LFO in brain; and 3) to investigate temporal changes in the spatial patterns of LFO signal (identified by NIRS) throughout the brain in the BOLD fMRI data.

[0082]Both NIRS and BOLD fMRI signals are sensitive to blood-oxygenation-related changes in the brain and both are able to accurately sample the low frequency band (<0.1 Hz), in general, there exists a strong temporal correlation between measurements of low-frequency physiological processes obtained using both techniques simultaneously. Conversely, these two imaging modalities have differen...

example 2

Separation of NIRS Signals

[0113]In this example, a temporal trace of NIRS was first spectrally separated into four bands using a zero delay Fourier domain bandpass filter in Matlab. The four bands were defined as very low frequency oscillation (VLF), VLF0.8 Hz. The temporal signal from each band was then resampled according to the TR of the fMRI acquisition. FIG. 12 shows the process for one subject. FIGS. 12a, 12c, 12f, 12i and 12l show the power spectra for (a) original data, (b) VLF, (c) LFO, (d) Resp and (e) Card, respectively. FIGS. 12b, 12d, 12g, 12j and 12m show the corresponding time traces, respectively. FIGS. 12e, 12h, 12k and 12n show the enlarged sections of the corresponding time traces, respectively. The resampled points (separated by 1.5 s) in the enlarged sections are shown as closed circles. Regressor interpolation at progressive time delays can then be applied on each spectrally separated band to assess the spatiotemporal evolutions of VLF, LFO, respiration and car...

example 3

oval from BOLD Data

[0114]The following examples illustrate how some of the factors described herein affect the efficacy of noise removal from BOLD data. In the following examples, different types of NIRS data (deoxy-hemoglobin, Δ[HbR] and total hemoglobin Δ[tHb]) were used alone and in combination with one another, the effect of using a plurality of frequency bands were compared, and data from different NIRS detection paths were compared. The probe placement for the experiment was substantially same as that shown in FIG. 5.

[0115]Choice of NIRS Type

[0116]As shown in FIGS. 13A and 13B, two independently determined NIRS quantities −Δ[HbR] and Δ[tHb] were used to illustrate the physiological variation in the BOLD data, and were found to be effective in different areas. For example, the Δ[tHb] regressors worked effectively near large vessels and in gray matter. Because the amount of physiological variance is essentially additive, both types of NIRS signals were used. When regressors were...


PUM


Abstract

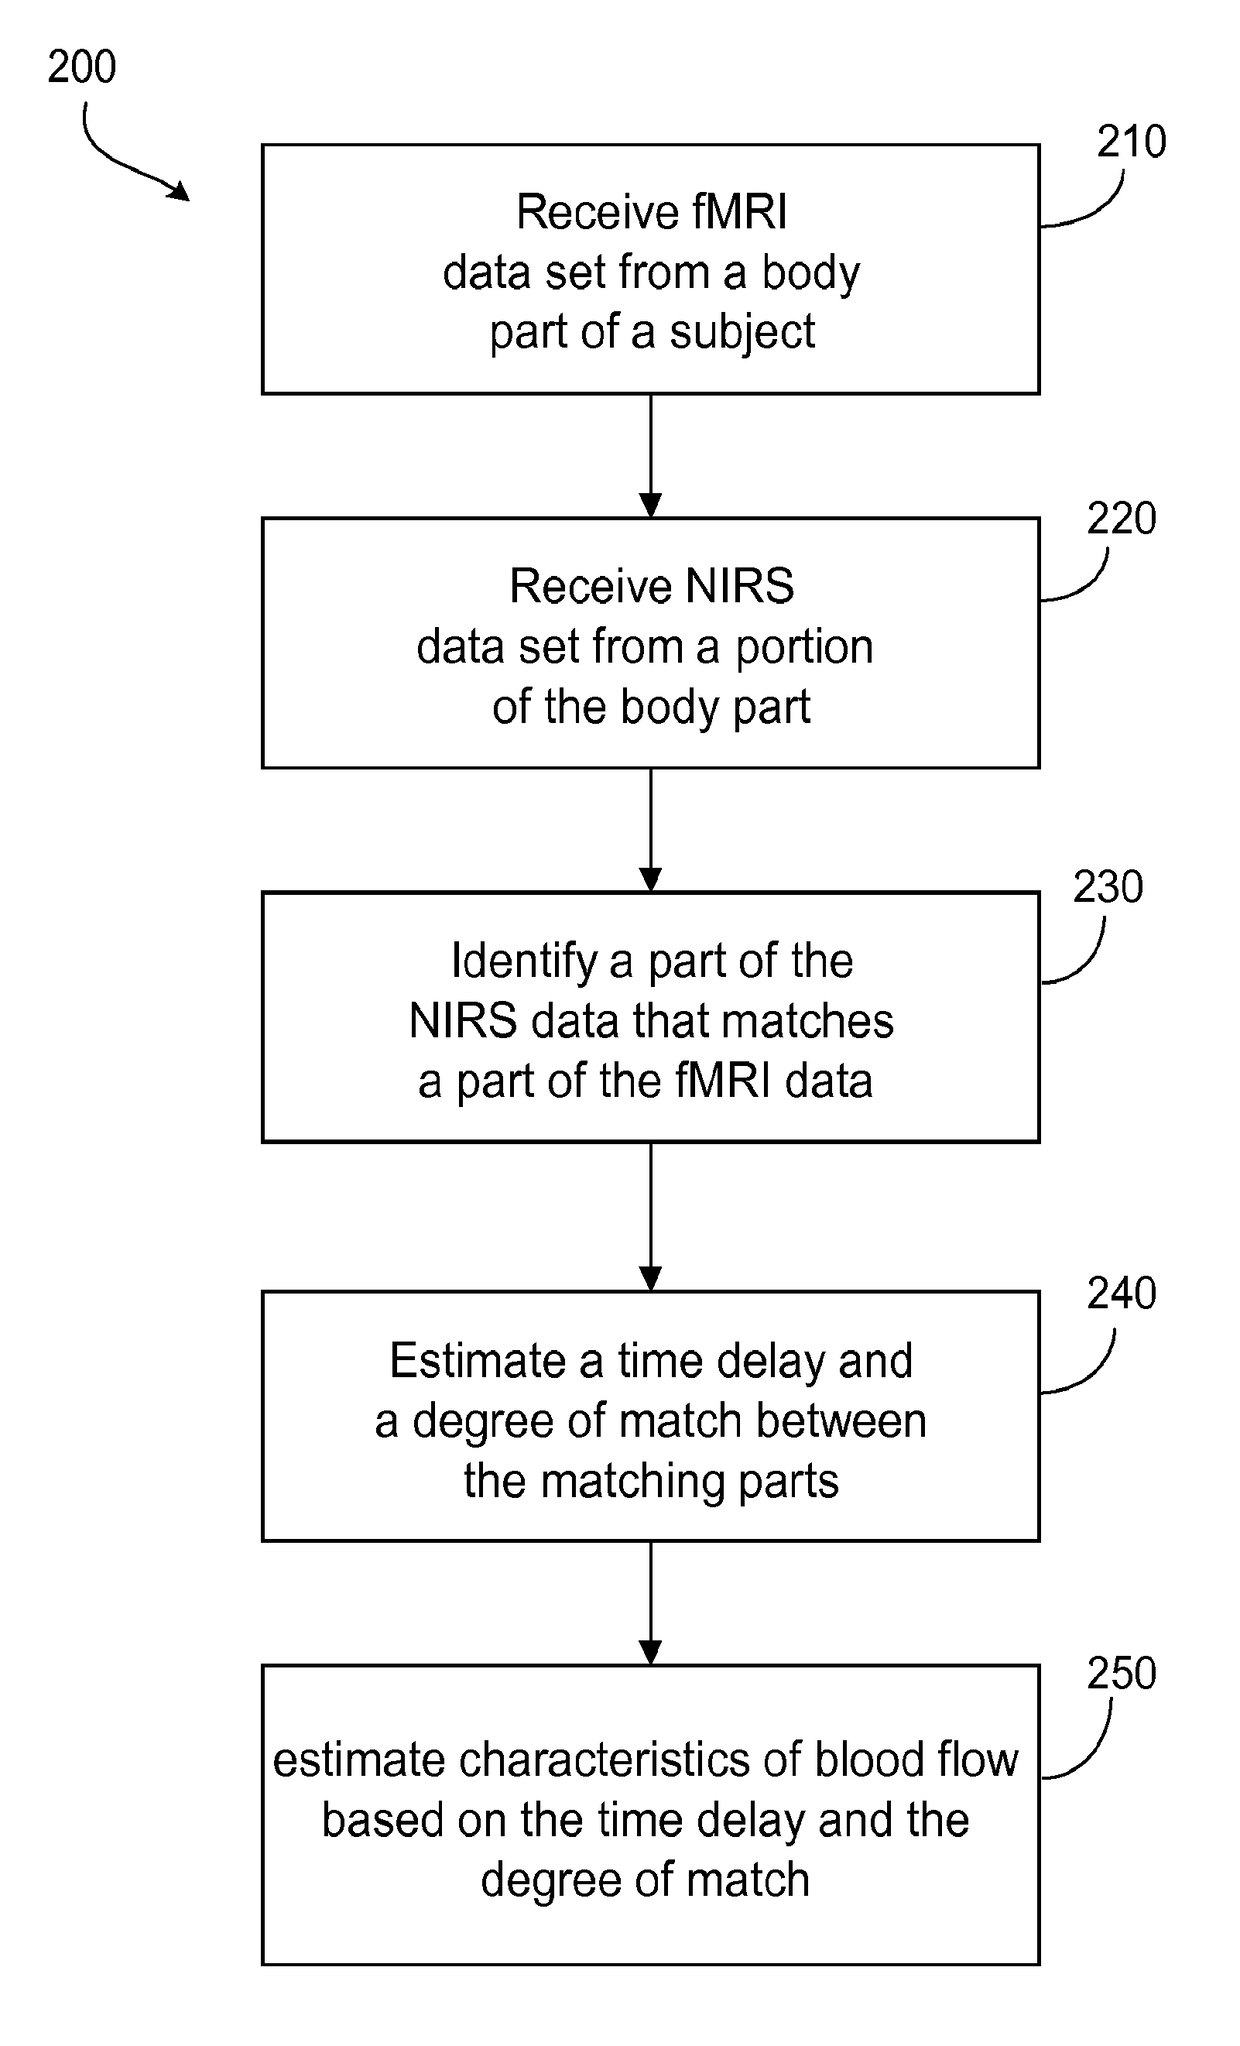
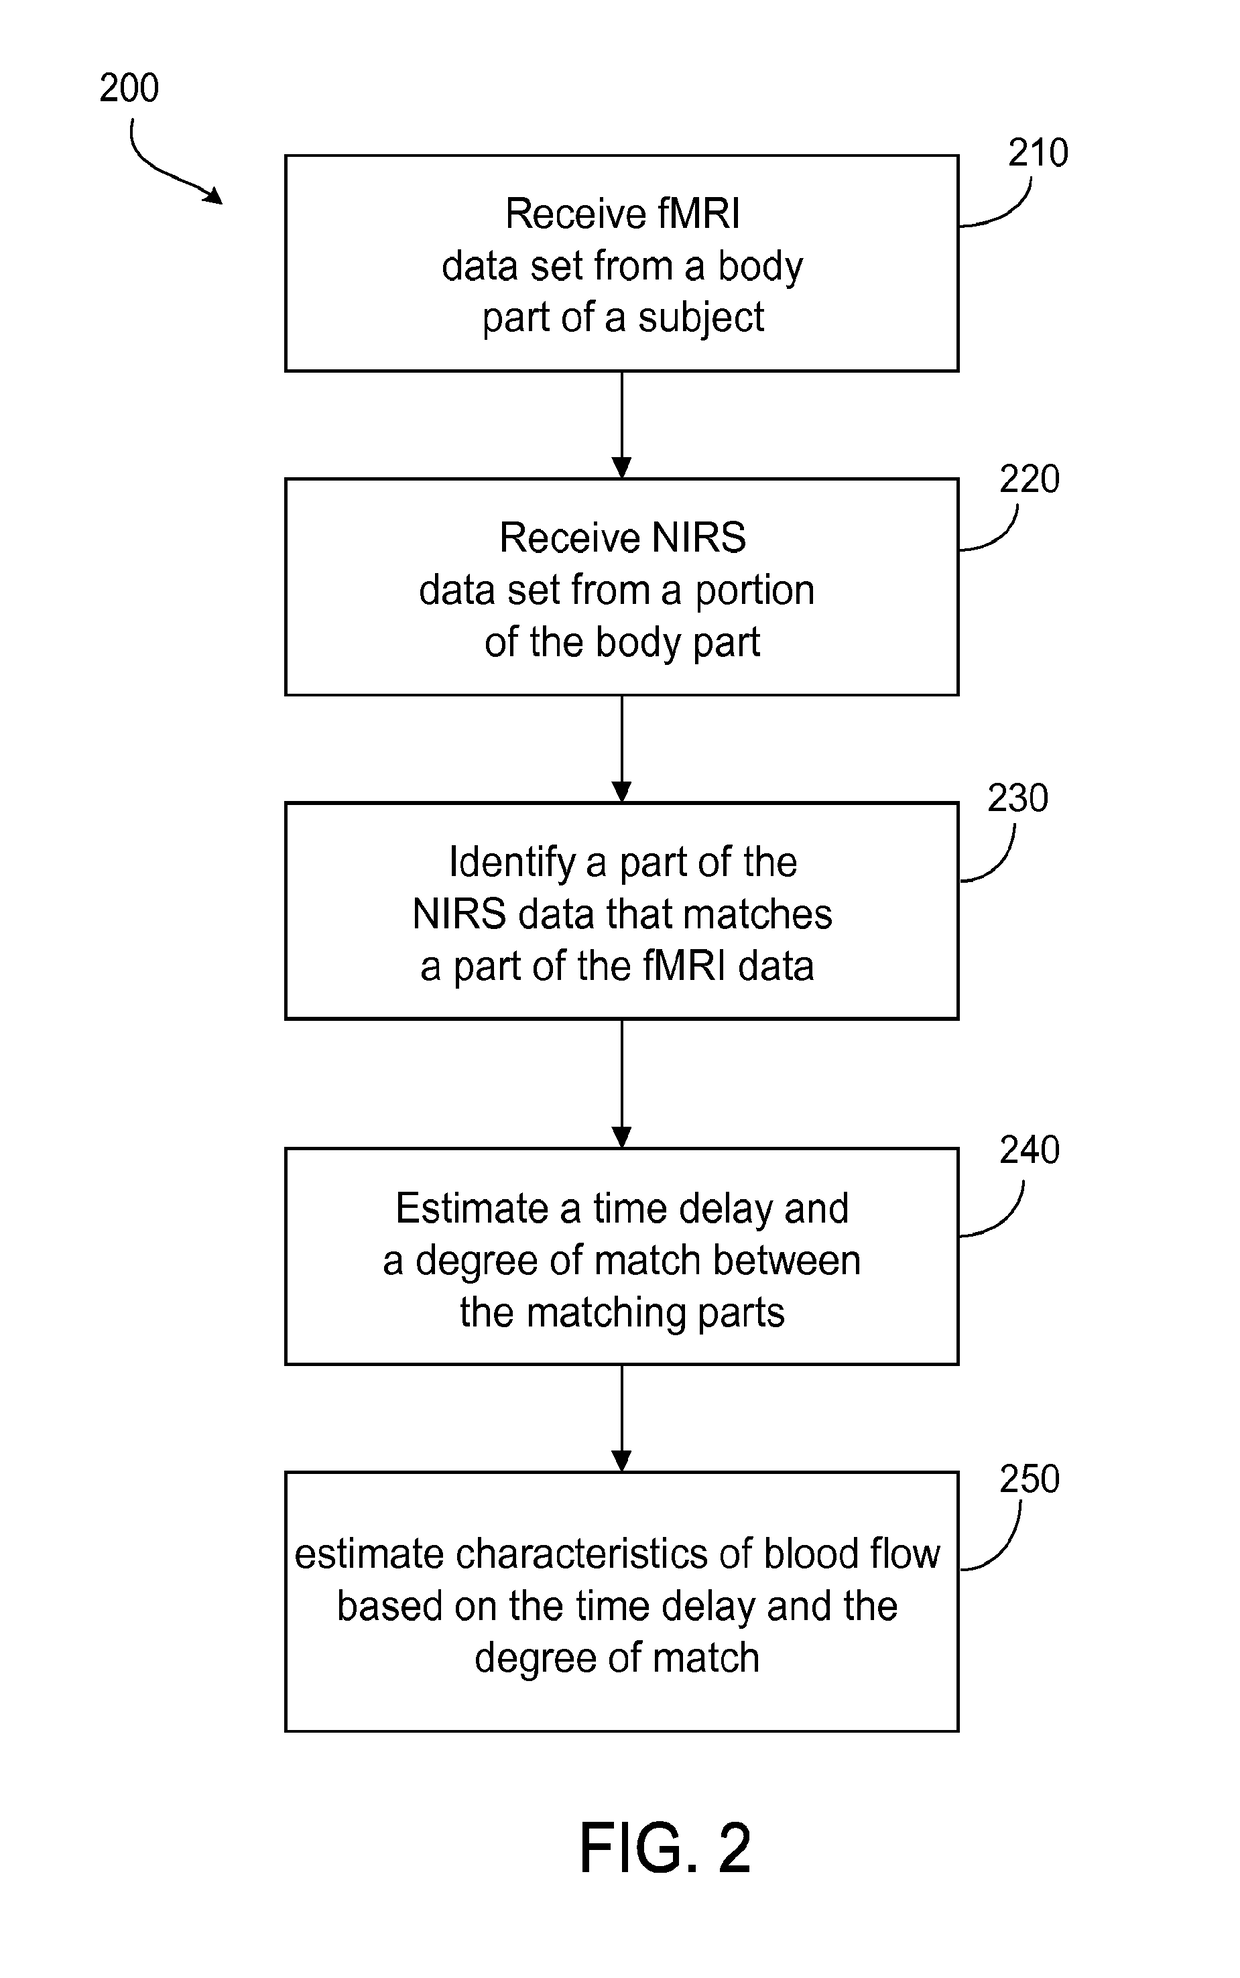
The application features methods, devices, and systems for measuring blood flow in a subject. The computer-implemented methods include receiving functional magnetic resonance imaging (fMRI) data that provides information on at least one of volume or oxygenation of blood at one or more locations in a body over a first predetermined length of time. The methods also include receiving near-infrared spectroscopic (NIRS) imaging or measurement data representing at least one of blood concentration or oxygenation at a first portion of the body over a second predetermined length of time. The methods further include deriving, from the fMRI data corresponding to a second portion of the body, a time varying data set representing changes in blood oxygenation or volume or both blood oxygenation and volume at the second portion over the first predetermined length of time and determining, by a computing device, a time delay and a value of a similarity metric corresponding to a part of the spectroscopic imaging data that most closely matches the time varying data set. The time delay represents a difference between a first time in which blood flows from a third portion in the body to the first portion and a second time in which blood flows to the second portion from the third portion. The value of the similarity metric represents an amount of blood at the second portion. An estimate of a characteristic of at least one of blood flow or blood volume in the second portion at a given time is determined based on the time delay and the value of the similarity metric.

Description

CROSS-REFERENCE TO RELATED APPLICATIONS[0001]This application represents the national stage entry of PCT International Application No. PCT / US2011 / 039230 on Jun. 6, 2011 and claims the benefit of U.S. Provisional Patent Application No. 61 / 351,703 filed Jun. 4, 2010. The contents of both of these applications are hereby incorporated by reference as if set forth in their entirety herein.STATEMENT REGARDING FEDERALLY SPONSORED RESEARCH[0002]This invention was made with Government support under Grant Number DA021817 awarded by the National Institutes of Health. The Government has certain rights in the invention.FIELD OF THE INVENTION[0003]The invention relates to mapping blood flow through an organ of a subject.BACKGROUND OF THE INVENTION[0004]Measuring blood flow in organs is useful in a variety of diagnostic and therapeutic procedures. Magnetic resonance imaging (MRI) can be used for such measurements. In some cases, blood flow is measured using MRI based methods that use exogenous con...

Claims


Application Information

Patent Timeline
Patent Type & Authority Patents(United States)
IPC IPC(8): A61B5/00A61B5/1455A61B5/055A61B5/026A61B5/02A61B5/0295
CPCA61B5/0035A61B5/0075A61B5/02014A61B5/02042A61B5/0261A61B5/0263A61B5/0295A61B5/055A61B5/14551A61B5/4088A61B5/4244A61B5/4312A61B5/4842A61B5/4848A61B5/7203A61B5/7225A61B5/7278A61B5/742A61B5/0042A61B5/4064
Inventor FREDERICK, BLAISETONG, YUNJIE
Owner THE MCLEAN HOSPITAL CORP
Learn More