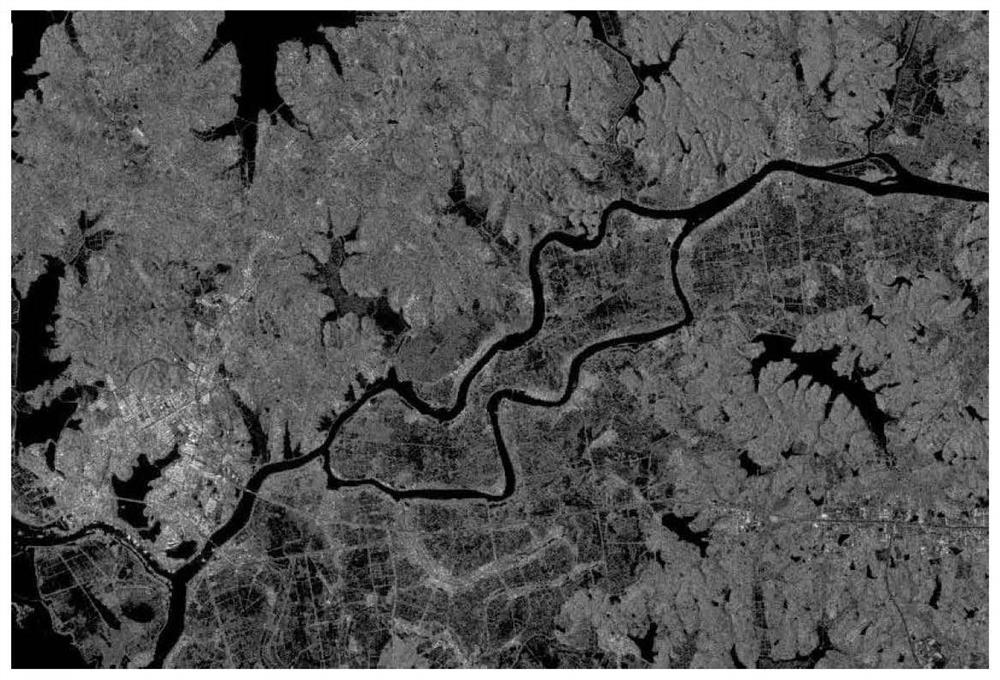
Method and device for detecting growth vigor of rice after disaster
A detection method and rice technology, applied in the field of agricultural remote sensing, can solve the problems of large fluctuation of scattering intensity and unfavorable crop analysis, and achieve the effects of accurate detection, guaranteed availability, and easy loss determination.
- Summary
- Abstract
- Description
- Claims
- Application Information
AI Technical Summary
Problems solved by technology
Method used
Image
Examples
Embodiment 1
[0057] like figure 1 As shown in the figure, a method for detecting post-disaster growth of rice includes the following steps:
[0058] S11. Determine the disaster-affected research area and obtain the SAR image data of the research area. After performing terrain correction, radiometric calibration, and filtering on the SAR image data, the normalized backscattering cross-section intensity is obtained. The backscattering cross-section intensity includes the backscattering cross-section intensity of VH polarization and the backscattering cross-section intensity of VV polarization;
[0059] S12. Bring the backscattering cross-section intensity of the VH polarization and the backscattering cross-section intensity of the VV polarization into the formula Calculated in , to get the normalized difference index, where NDBI is the normalized difference index, σ VH is the backscattering cross-section intensity of VH polarization, σ VV is the backscattering cross-section intensity of ...
Embodiment 2
[0073] A method for NDVI and NDBI relationship establishment, including:
[0074] Taking Jiangsu rice as an example, the typical crop phenological characteristics of the sample area: Jiangsu rice is mainly medium rice, which is sown and germinated in May, and the seedlings turn green in June. The wheat sowing time is mid-to-late October, jointing from late March to early April of the following year, heading from late April to early May, and mature and harvested from late May to early June;
[0075] After analysis, from June 2020 to July 2021, the VV and VH backscattering characteristics of SAR images are as follows: Figure 9 Then, the normalized difference index is calculated, and time series fitting is performed to obtain the typical crop time series fitting characteristics as follows Figure 10 At the same time, combined with the optical image to filter the cloud-less data in the corresponding area, the NDVI time series and fitting results are as follows Figure 11 shown,...
Embodiment 3
[0079] like Figure 12 As shown, a post-disaster growth detection device for rice includes:
[0080] Image data preprocessing module 10: used to determine the disaster-affected research area and obtain the SAR image data of the research area, perform terrain correction, radiometric calibration, and filtering on the SAR image data to obtain a normalized backscattering cross section Intensity, the normalized backscattering cross-section intensity includes the backscattering cross-section intensity of VH polarization and the backscattering cross-section intensity of VV polarization;
[0081] Normalized difference index calculation module 20: used to bring the backscattering cross-section intensity of the VH polarization and the backscattering cross-section intensity of the VV polarization into a formula Calculated in , to get the normalized difference index, where NDBI is the normalized difference index, σ VH is the backscattering cross-section intensity of VH polarization, σ ...
PUM
 Abstract
Description
Claims
Application Information
 - Generate Ideas
- Intellectual Property
- Life Sciences
- Materials
- Tech Scout
- Unparalleled Data Quality
- Higher Quality Content
- 60% Fewer Hallucinations
Browse by: Latest US Patents, China's latest patents, Technical Efficacy Thesaurus, Application Domain, Technology Topic, Popular Technical Reports.
© 2025 PatSnap. All rights reserved.Legal|Privacy policy|Modern Slavery Act Transparency Statement|Sitemap|About US| Contact US: help@patsnap.com


