
Subsystem fluctuation signal analysis method based on causal analysis

A signal analysis method and causal analysis technology, which is applied in the field of industrial control system fault diagnosis, can solve problems such as modal aliasing, and achieve the effects of easy operation, simple algorithm principle, and improved accuracy and reliability

Pending Publication Date: 2022-05-10
ZHEJIANG UNIV
View PDF2 Cites 0 Cited by
  • Summary
  • Abstract
  • Description
  • Claims
  • Application Information

AI Technical Summary

Problems solved by technology

Since the method involves EMD decomposition, there are problems such as mode aliasing

Method used


Image

  • Subsystem fluctuation signal analysis method based on causal analysis
  • Subsystem fluctuation signal analysis method based on causal analysis
  • Subsystem fluctuation signal analysis method based on causal analysis

Examples


Embodiment Construction

[0101] The present invention will be further described in detail below with reference to the accompanying drawings and embodiments. It should be noted that the following embodiments are intended to facilitate the understanding of the present invention, but do not limit it in any way.

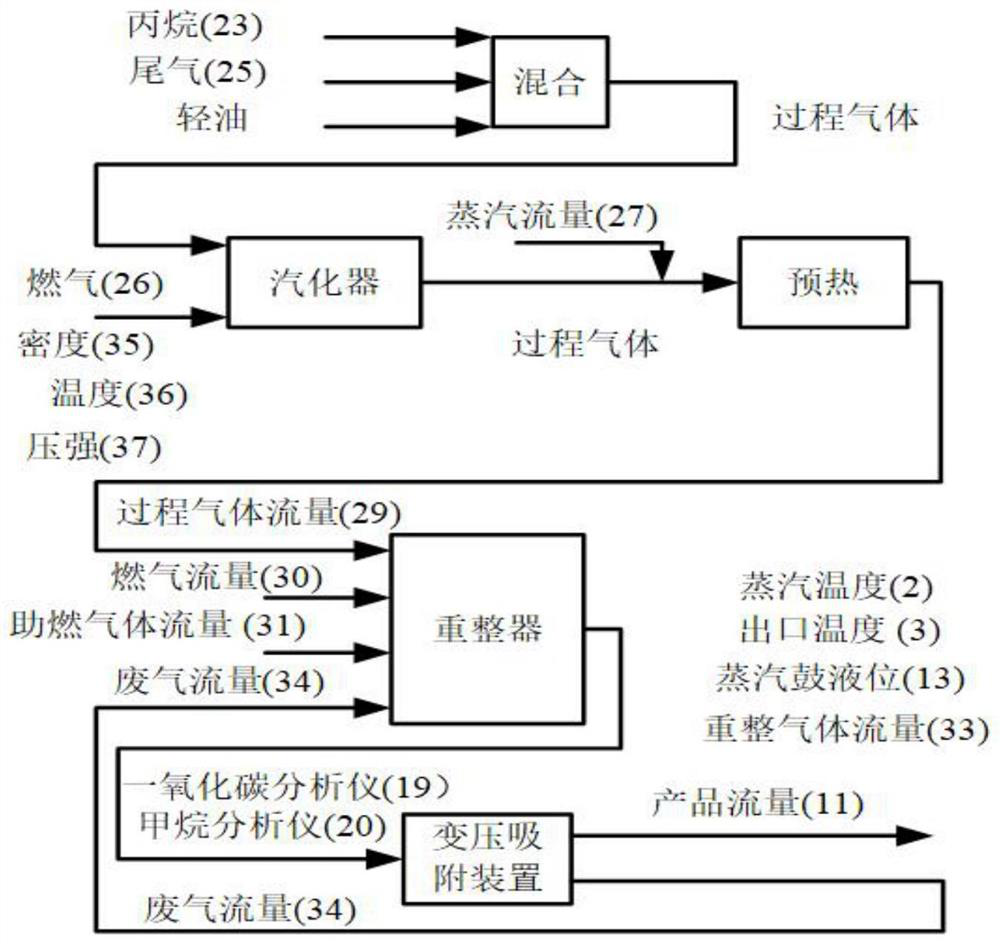
[0102] Taking the hydrogen conversion of an oil refinery in Southeast Asia as an example, the causal analysis-based correlative subsystem control fluctuation correlation modeling technology for a chemical process with multiple fluctuation subsystems is described in detail.

[0103] The hydrogen conversion process of the Southeast Asia refinery in this example is as follows: figure 1 shown.

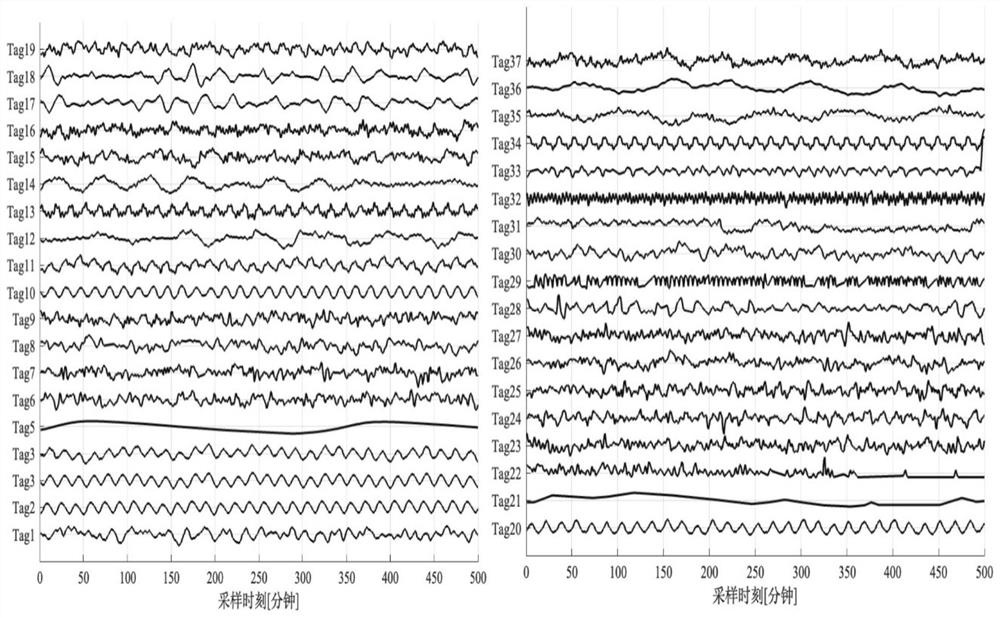
[0104] The process includes a total of 37 variables including controller and indicator process variables. The standardized sample length is 512, and the sampling interval is 1min. Its original time series as figure 2 As shown, it can be seen from the figure that 37 variables fluctuate globally. The main...


PUM


Abstract

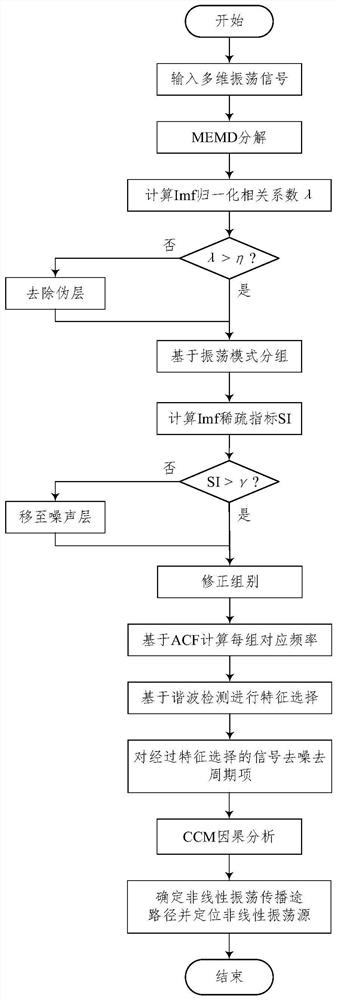
The invention discloses a subsystem fluctuation signal analysis method based on causal analysis, and the method comprises the steps: carrying out the decomposition of a multi-dimensional signal through employing an MEMD method, obtaining the Imf of each layer of all signals, carrying out the grouping of each layer Imf of each signal based on a normalized correlation coefficient, correcting the group based on a sparse index, and carrying out the analysis of a fluctuation signal. A harmonic detection method is adopted to search for fundamental waves and harmonic waves Imf which are in an integral multiple relation in the groups, signals with the fundamental waves and the harmonic waves at the same time are selected to serve as the result of grouping harmonic detection feature selection, denoising and periodic term removing processing is conducted on fluctuation signals subjected to feature selection, the remaining part is reconstructed, and corresponding target sub-signals are obtained; and calculating cross mapping indexes of the reconstructed sub-signal pairs under different time lag by using an extended CCM method, judging whether to converge according to a convergence threshold, obtaining a causal relationship of each signal pair, further obtaining a fluctuation propagation path, and positioning a fluctuation source. According to the method, the fluctuation propagation path in the industrial control system can be quickly and accurately diagnosed, and the fluctuation source can be positioned.

Description

technical field [0001] The invention belongs to the field of fault diagnosis of industrial control systems, in particular to a method for analyzing fluctuation signals of subsystems based on causal analysis. Background technique [0002] Over-tuning of controllers, external disturbances and nonlinearities may cause fluctuations in industrial process subsystems. Among them, nonlinearity mainly includes the inherent nonlinear properties of the process itself or the nonlinearity caused by the failure of sensors and actuators, which is one of the main reasons for the fluctuation of the industrial process control system subsystem. [0003] In the field of industrial process control, the detection of fluctuations caused by nonlinearity has a lot of research results after decades of development. In recent years, industrial process fault diagnosis based on causal analysis has developed rapidly. [0004] Thornhill used the spectrum PCA method to group the fluctuation subsystems, an...

Claims


Application Information

Patent Timeline
Patent Type & Authority Applications(China)
IPC IPC(8): G05B23/02
CPCG05B23/0243G05B2219/24065
Inventor 谢磊陈昕昊陈启明张志铭苏宏业
Owner ZHEJIANG UNIV
Learn More