
Efficient OD data visualization method and system

A data and efficient technology, applied in the field of efficient OD data visualization methods and systems, can solve the problems of low OD line drawing efficiency, damage to the original data table, and time-consuming OD start and end points, etc., to reduce the search range and improve the drawing rate Effect

Active Publication Date: 2021-06-11
重庆市规划设计研究院
View PDF10 Cites 2 Cited by
  • Summary
  • Abstract
  • Description
  • Claims
  • Application Information

AI Technical Summary

Problems solved by technology

[0005] 1. The network analysis function of ArcGIS can only connect the starting point and the ending point through a straight line, and cannot distinguish the connection between two destinations in two directions
[0006] 2. When the network analysis function of ArcGIS draws the OD line, it needs to traverse from the original data table to find the corresponding OD line starting point information and OD line end point information according to the required starting and ending points of the OD line, so that the OD starting and ending point Finding can take a lot of time, making OD line drawing inefficient
[0007] 3. The network analysis function of ArcGIS is to query directly in the original data table. If an unforeseen error occurs during the OD line drawing process, it is easy to cause damage to the original data table and cause the OD line to not be drawn normally.

Method used


Image

  • Efficient OD data visualization method and system
  • Efficient OD data visualization method and system
  • Efficient OD data visualization method and system

Examples


Embodiment 1

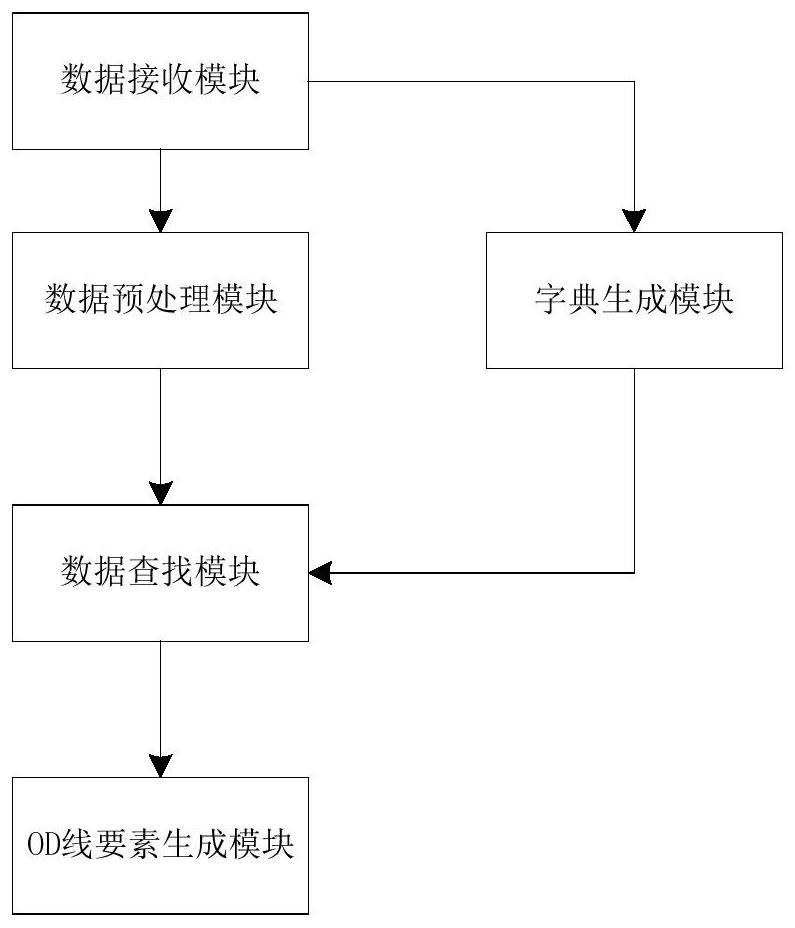
[0055] An efficient OD data visualization system, such as figure 1 As shown, it includes a data receiving module, a dictionary generation module, a data preprocessing module, a data search module and an OD line element generation module, where:

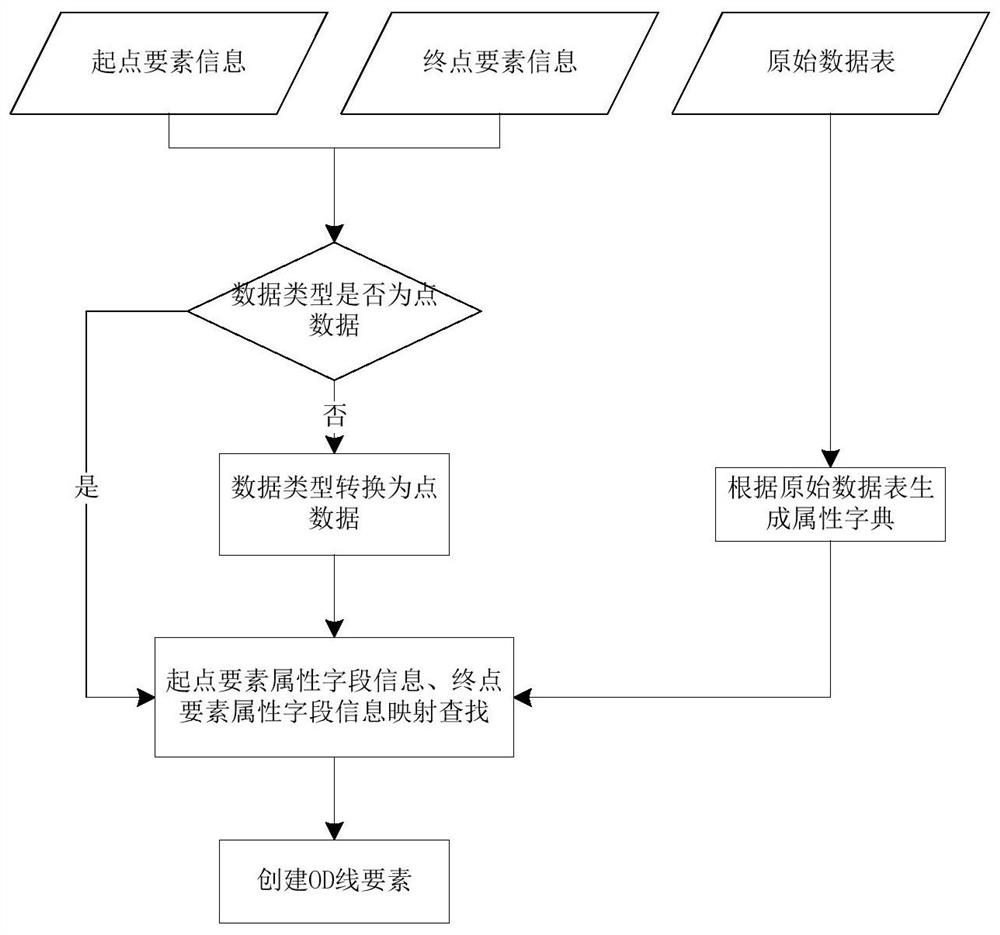
[0056] The data receiving module is used to receive the start point element information, end point element information, radian parameter information and original data table; the data receiving module is also used to extract the attribute fields of the start point element information and the end point element information respectively, and obtain the start point element attribute field information and the end point element Attribute field information. in:

[0057] The start element information is the spatial start element of the OD line, the end element information is the spatial end element before OD, and the data type of the received start element information and end point element information is point data or area data.

[0058] The...

Embodiment 2

[0073] The difference from Embodiment 1 is that the dictionary generation module is used to copy all the OD line end information corresponding to the same OD line start information in the original data table and the trend flow information of the OD line start and end points to obtain No. 1 sub-data table, and generate a starting point-ending point attribute dictionary for all copied No. 1 sub-data tables according to their corresponding OD line starting point information.

[0074] The data search module is used to find the corresponding OD line starting point information and associated No. The end point information of the OD line and the trend flow information of the corresponding start and end points of the OD line.

[0075]Before the data receiving step, a dictionary generation step is also included. The dictionary generation step is to copy all the OD line end information corresponding to the same OD line start information in the original data table and the trend flow infor...

Embodiment 3

[0078] The difference from Embodiment 1 is that the dictionary generation module is used to copy all the OD line start information corresponding to the same OD line end point information in the original data table and the trend flow information of the OD line start and end points to obtain the second sub-data table, and generate the end point-start point attribute dictionary for all copied No. 2 sub-data tables according to their corresponding OD line end point information.

[0079] The data search module is used to find the corresponding OD line end point information and the associated No. 2 sub-data table from the end point-start point attribute dictionary according to the end point attribute field information, and find the corresponding The starting point information of the OD line and the trend flow information of the corresponding starting and ending points of the OD line.

[0080] Before the data receiving step, a dictionary generation step is also included. The dictiona...


PUM


Abstract

The invention relates to the technical field of urban planning, and particularly discloses an efficient OD data visualization method and system, and the method comprises the steps: a dictionary generation module carries out the correlation searching of the OD terminal point information of a corresponding terminal point column or the OD starting point information of a starting point column according to the same OD starting point information in a starting point column of an original data table or the same OD terminal point information in a terminal point column, copying, extracting, permutation and combination are carried out to obtain sub-data tables, and an attribute dictionary is generated according to all the obtained sub-data tables; the data preprocessing module is used for performing data type analysis on the starting point element information and the end point element information respectively, and performing data type conversion on the starting point element information and the end point element information of which the data type is surface data to obtain the starting point element information and the end point element information of which the data type is point data; and the data searching module is used for searching corresponding OD line starting point information and OD line terminal point information from the attribute dictionary. By adopting the technical scheme of the invention, the OD line drawing efficiency can be improved.

Description

technical field [0001] The invention relates to the technical field of urban planning, in particular to an efficient OD data visualization method and system. Background technique [0002] OD (Origin-Destination) data is an important data type that reflects the flow of elements and inter-regional connections, such as population travel OD data, capital flow OD data, etc., and has been widely used in planning research and urban perception. [0003] At present, OD data can be visualized through network platforms such as Canvas, eCharts, kepler, etc. Using these platforms, users can draw arc-connected OD diagrams, but these network platforms require users to have certain JavaScript script code writing capabilities , puts forward high requirements for users, and is not convenient for ordinary planners to use. [0004] In the context of land and space planning, GIS is more and more widely used in urban planning. Using the network analysis function of ArcGIS, OD data can be visuali...

Claims


Application Information

Patent Timeline
Patent Type & Authority Applications(China)
IPC IPC(8): G06F16/904G06F16/903G06F16/36
CPCG06F16/904G06F16/90335G06F16/374
Inventor 刘清全冷炳荣易峥曹春霞王英李继珍
Owner 重庆市规划设计研究院
Learn More