Data visual display method and device

A display device and data technology, applied in the field of data visualization, can solve problems such as reduced server computing efficiency, data congestion, visual display, failure, etc., and achieve the effect of improving the quality of data visualization, improving data processing efficiency, and improving practicability

Pending Publication Date: 2020-08-25
北京龙云科技有限公司
View PDF5 Cites 3 Cited by
  • Summary
  • Abstract
  • Description
  • Claims
  • Application Information

AI Technical Summary

Problems solved by technology

With the development of big data, the amount of data is increasing. The traditional method of transferring all the data that needs to be visualized to

Method used


Image

  • Data visual display method and device
  • Data visual display method and device

Examples


Example Embodiment

[0039] The technical solutions in the embodiments of the present invention will be clearly and completely described below in conjunction with the accompanying drawings in the embodiments of the present invention. Obviously, the described embodiments are only a part of the embodiments of the present invention, rather than all the embodiments. Based on the embodiments of the present invention, all other embodiments obtained by those of ordinary skill in the art without creative work shall fall within the protection scope of the present invention.

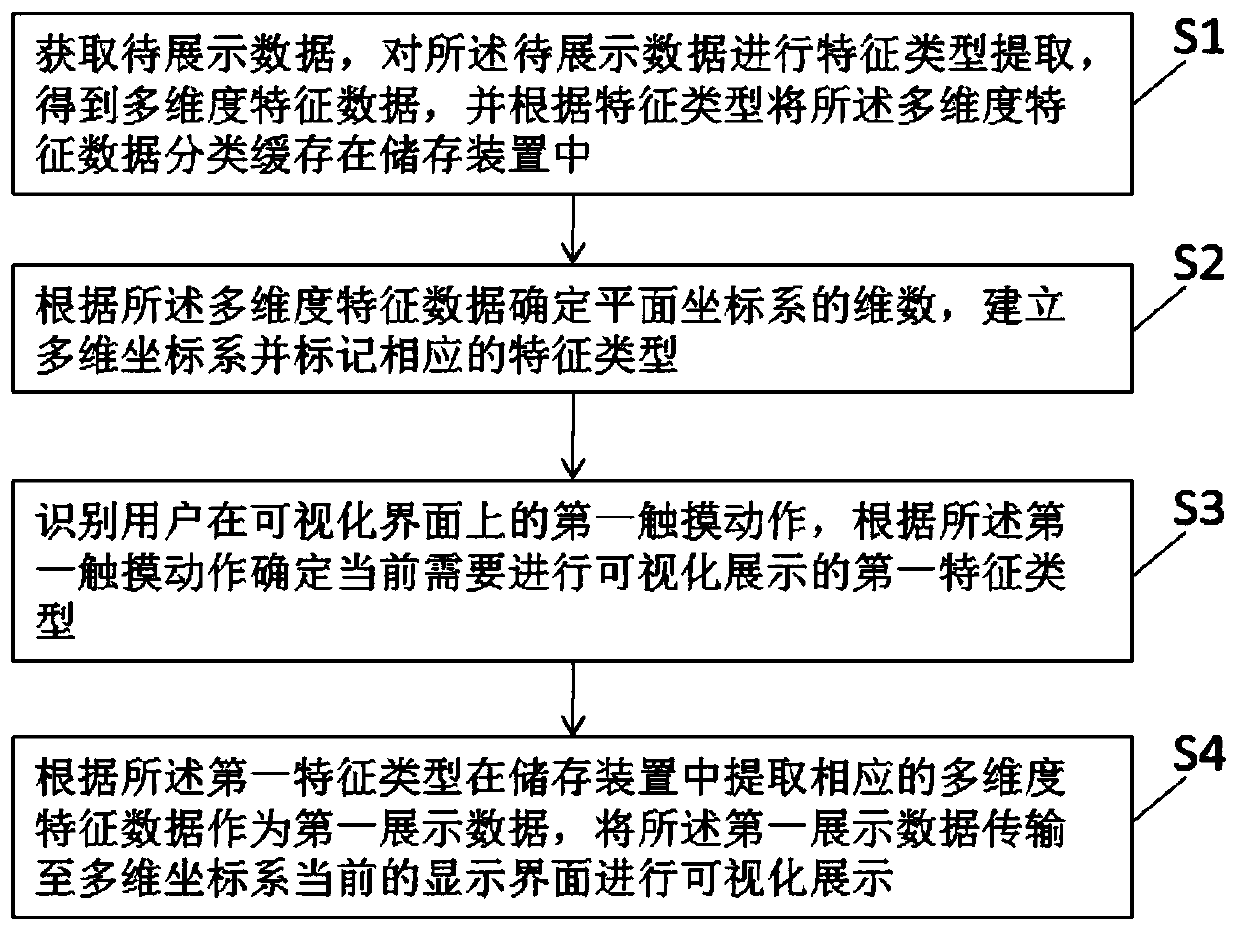
[0040] Please refer to figure 1 , A preferred embodiment of the present invention provides a data visualization display method, including:

[0041] S1. Obtain data to be displayed, extract feature types of the data to be displayed, obtain multi-dimensional feature data, and classify and cache the multi-dimensional feature data in a storage device according to the feature type; in this embodiment, the The storage device includes a local sto...


PUM


Abstract

The invention discloses a data visual display method, which comprises the steps of obtaining to-be-displayed data, performing feature type extraction on the to-be-displayed data to obtain multi-dimensional feature data, and caching the multi-dimensional feature data in a storage device in a classified manner according to the feature type; determining dimensions of a plane coordinate system according to the multi-dimensional feature data, establishing a multi-dimensional coordinate system, and marking corresponding feature types; identifying a first touch action of a user on the visual interface, and determining a first feature type which currently needs to be visually displayed according to the first touch action; extracting corresponding multi-dimensional feature data from a storage device as first display data according to the first feature type, and transmitting the first display data to a current display interface of a multi-dimensional coordinate system for visual display. According to the technical scheme, the multi-dimensional data can be selectively and visually displayed according to actual display requirements of users, and the data processing efficiency and the data visualization quality are improved.

Description

technical field [0001] The present invention relates to the technical field of data visualization, in particular to a data visualization display method and device. Background technique [0002] Data visualization is a scientific and technological research on the visual representation of data. Among them, the visual representation of this data is defined as information extracted in a certain summary form, including various attributes and variables of the corresponding information unit. Information visualization aims to study the visual presentation of large-scale non-numerical information resources in the form of graphics and images. In the application of traditional data visualization technology, due to the multi-dimensionality of data, the visualization displays multiple attributes. When performing data visualization, it is usually to completely transfer all data to a multi-dimensional coordinate system for display. With the development of big data, the amount of data is ...

Claims


Application Information

Patent Timeline
IPC IPC(8): G06F16/22G06F16/2458G06F16/26G06F3/0488
CPCG06F16/2264G06F16/2465G06F16/26G06F3/0488
Inventor 朴志鹏
Owner 北京龙云科技有限公司
Why Eureka
Try Eureka