High-stability near-infrared-II nano fluorescent probe as well as preparation method and application thereof
A nano-fluorescence probe and high-stability technology, applied in chemical instruments and methods, luminescent materials, pharmaceutical formulations, etc., can solve problems such as poor stability and weak integration of diagnosis and treatment
- Summary
- Abstract
- Description
- Claims
- Application Information
AI Technical Summary
Problems solved by technology
Method used
Image
Examples
Embodiment 1
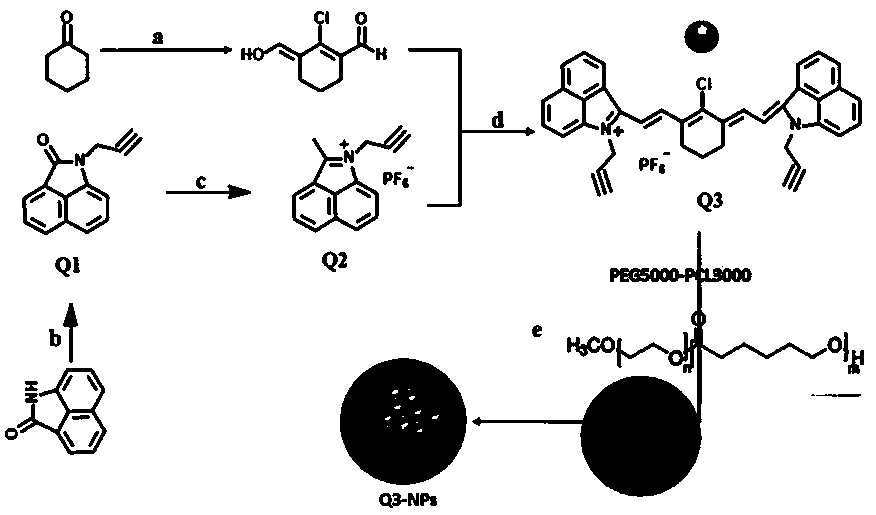
[0072] Example 1: Synthesis of novel high-stability near-infrared second region nano-fluorescent probe Q3-NPs
[0073] (1) Under nitrogen protection, add naphthalimide (1.69 g, 10 mmol), 3-bromopropyne (2.38 g, 20 mmol) and 10 mL of anhydrous N, N-dimethyl Using methyl formamide as a solvent, the mixture was heated to 100 °C with magnetic stirring and refluxed for 5 h. The reaction was completed, cooled to room temperature, the mixture was poured into 500 mL of ice-water mixture, and the pH was adjusted to neutral with 1 mol / L hydrochloric acid aqueous solution, filtered under reduced pressure, and the crude product was purified by silica gel column chromatography (petroleum ether: ethyl acetate Esters = 9:1, v / v), the product was yellow solid compound Q1 (1.56 g, yield: 75 %). Maldi-Tof: m / z , cal : 208.07, found : 208.17 [M + ].
[0074] (2) Under nitrogen-protected ice-bath conditions, add compound Q1 (1.03 g, 5.0 mmol) and 20 mL of anhydrous tetrahydrofuran into a...
Embodiment 2
[0078] Example 2: Photophysical properties of novel high-stability near-infrared second region nano-fluorescent probes
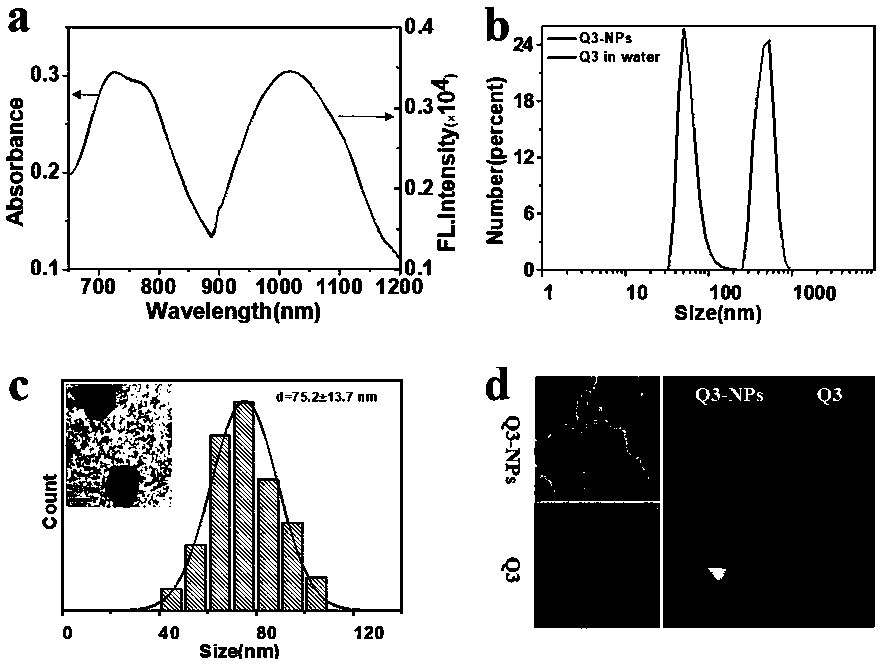
[0079] Dilute the probe Q3-NPs of the experimental group prepared in Example 1 to a concentration of 10 μg / mL with ultrapure water, and use a UV-Vis-NIR spectrophotometer and a fluorescence spectrophotometer to measure its UV-Vis-NIR spectrum and fluorescence spectrum. Such as figure 2 As shown in (a), the results show that the probe Q3-NPs has the best absorption at 750 nm; it shows a strong NIR-II emission fluorescence signal in aqueous solution.
[0080] The hydrated particle size of the aqueous solution of the probe Q3-NPs in the experimental group and the probe Q3 in the control group is as follows: figure 2 (b), the transmission electron microscope image is shown as figure 2 As shown in (d), the particle size statistics of the transmission electron microscope image are as follows figure 2 As shown in (c), the probe Q3-NPs of the experimental gr...
Embodiment 3
[0082] Example 3: In vivo near-infrared second-region fluorescence imaging of novel high-stability near-infrared second-region nanofluorescent probes
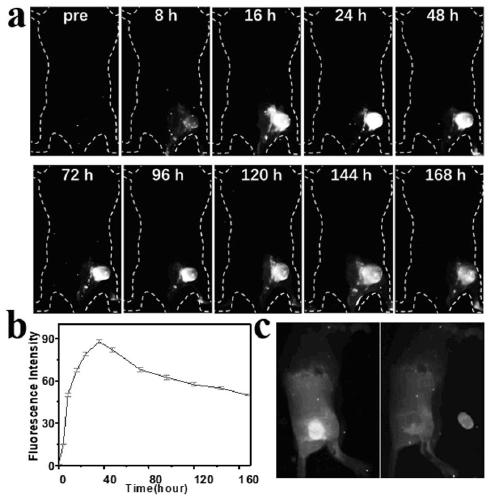
[0083] The probe Q3-NPs of the experimental group prepared in Example 1 was dissolved in PBS solution (100 μg / mL, 200 μL), and the probe was injected into the tumor-bearing (4T1 mouse breast cancer) BALB / c / Nu female white mice were placed in the small animal Serious II 900-1700 nm near-infrared second region in vivo imaging system (excitation wavelength: 808 nm), and the imaging effect was observed in real time, and finally the tumors of nude mice were calculated by in vivo imaging analysis software The fluorescence intensity of the site at different time points. In vivo fluorescence imaging of the probe Q3-NPs in the experimental group at different time points in the second near-infrared region image 3 As shown in (a), the results showed that the probe Q3-NPs in the experimental group had the strongest fluorescence at the t...
PUM
| Property | Measurement | Unit |
|---|---|---|
| particle size | aaaaa | aaaaa |
Abstract
Description
Claims
Application Information
 - R&D
- Intellectual Property
- Life Sciences
- Materials
- Tech Scout
- Unparalleled Data Quality
- Higher Quality Content
- 60% Fewer Hallucinations
Browse by: Latest US Patents, China's latest patents, Technical Efficacy Thesaurus, Application Domain, Technology Topic, Popular Technical Reports.
© 2025 PatSnap. All rights reserved.Legal|Privacy policy|Modern Slavery Act Transparency Statement|Sitemap|About US| Contact US: help@patsnap.com


