
Multi-source atmospheric data clustering method based on distribution density

A technology of distribution density and atmospheric data, applied in other database clustering/classification, other database indexing, other database retrieval, etc., can solve the problem of inability to distinguish noise points, unallocated points allocation accuracy is not high, and cluster centers are difficult to accurately identify, etc. question

Pending Publication Date: 2020-08-07
NANJING UNIV OF INFORMATION SCI & TECH
View PDF0 Cites 6 Cited by
  • Summary
  • Abstract
  • Description
  • Claims
  • Application Information

AI Technical Summary

Problems solved by technology

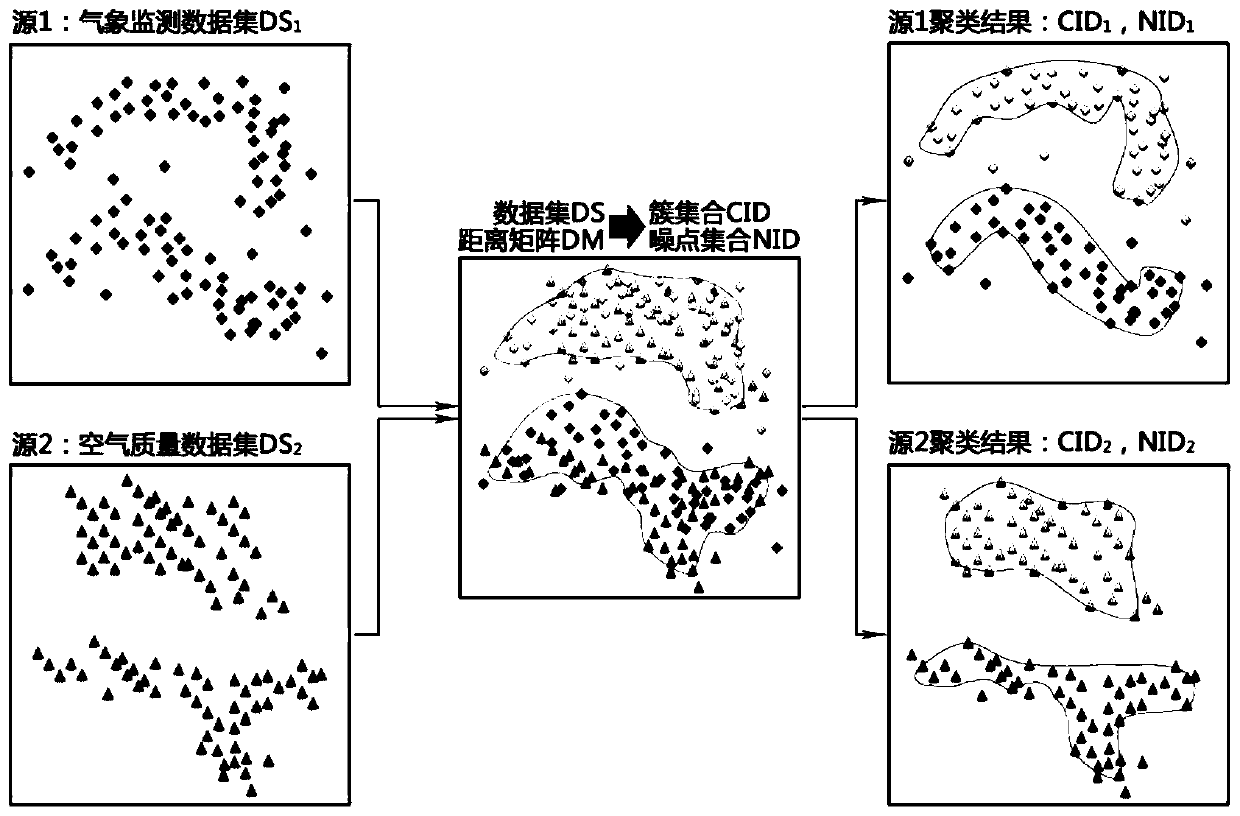
After continuous development and mutual reference and fusion of the above-mentioned various clustering algorithms, a classic density peak clustering algorithm DPC emerged. It is relatively larger, and thus achieves efficient clustering of data with a single truncated distance parameter to control arbitrary distribution shapes, but not all data sets can accurately find the cluster center through the decision map and the algorithm cannot distinguish noise points, so there are The researchers improved the DPC algorithm, trying to solve the two major problems of determining the cut-off distance of the algorithm and selecting the cluster center. Although this has achieved certain results, the accuracy of cluster center selection and unassigned point allocation is still not high. On the one hand, the reason is that it is difficult to accurately determine the cluster center, and on the other hand, because the nearest neighbor allocation strategy for unassigned points is not perfect. Therefore, the present invention proposes a new multi-source clustering algorithm based on the distribution density of the entire neighborhood of data. Atmospheric data clustering analysis algorithm, which can solve the problems of increasing clustering parameters and unautomated discrimination noise existing in the prior art

Method used


Image

  • Multi-source atmospheric data clustering method based on distribution density
  • Multi-source atmospheric data clustering method based on distribution density
  • Multi-source atmospheric data clustering method based on distribution density

Examples


Embodiment Construction

[0063] The present invention will be described in further detail below in conjunction with the accompanying drawings.

[0064] The distribution density is in a data set DS composed of M-dimensional data with a data volume of N, the distribution density dd(i,j) of any item of data (vertex) i to another item of data j is:

[0065]

[0066] Where V(i,k) represents the hypersphere volume with the vertex i as the center and the distance from i to k as the radius, DS(i,j) represents the vertices within the range of V(i,j), PN(i,j ) represents the number of vertices within the range of V(i,j), and the hypersphere formula is as follows:

[0067]

[0068] where r is the radius, M is the data dimension, and Γ is the gamma function.

[0069] The above formula (1) for defining the distribution density expresses the ratio of the number of vertices in the hypersphere formed by the distance between any two vertices in the data set as the radius to the sum of the volume of the hypersph...


PUM


Abstract

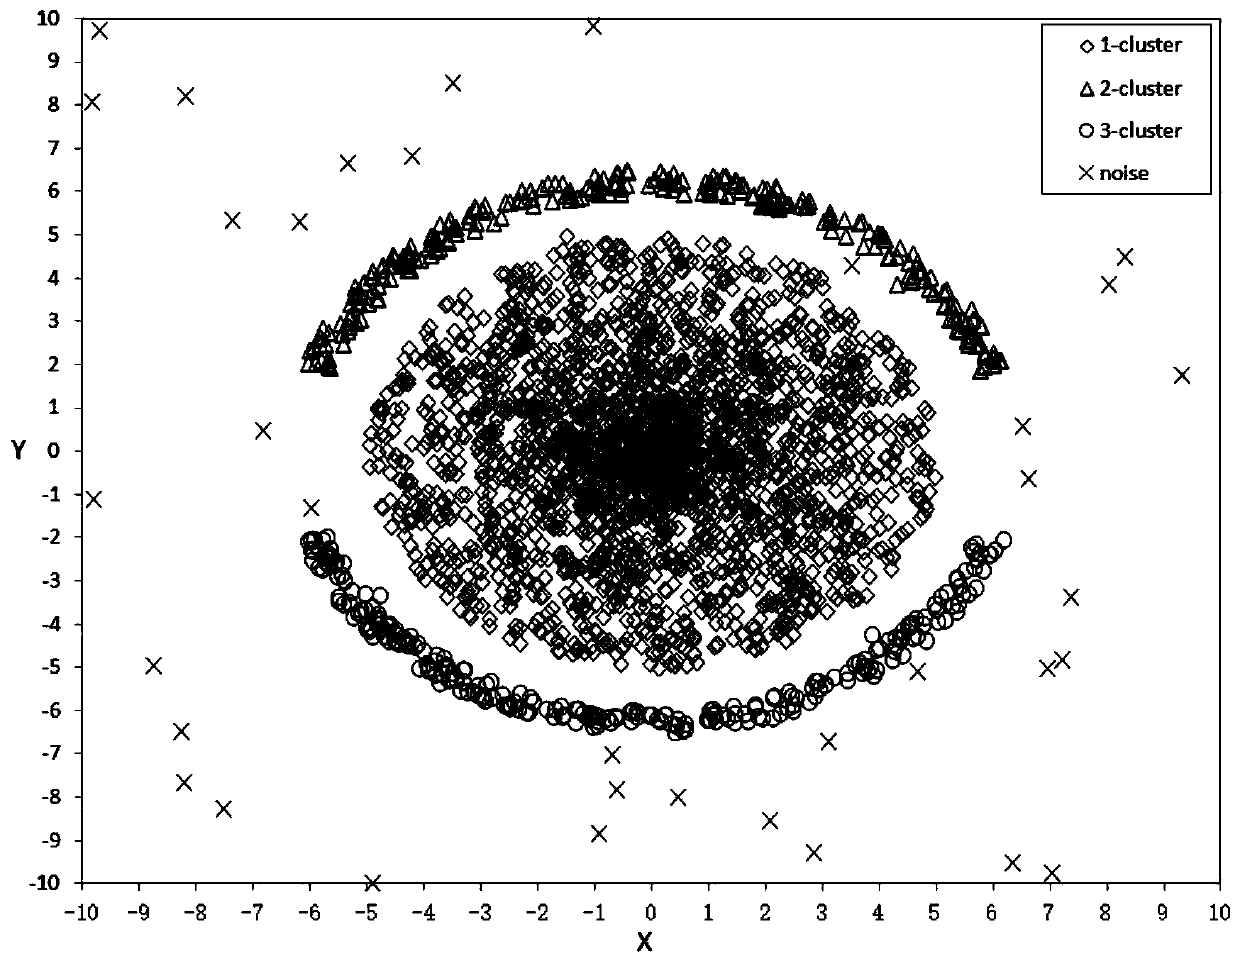
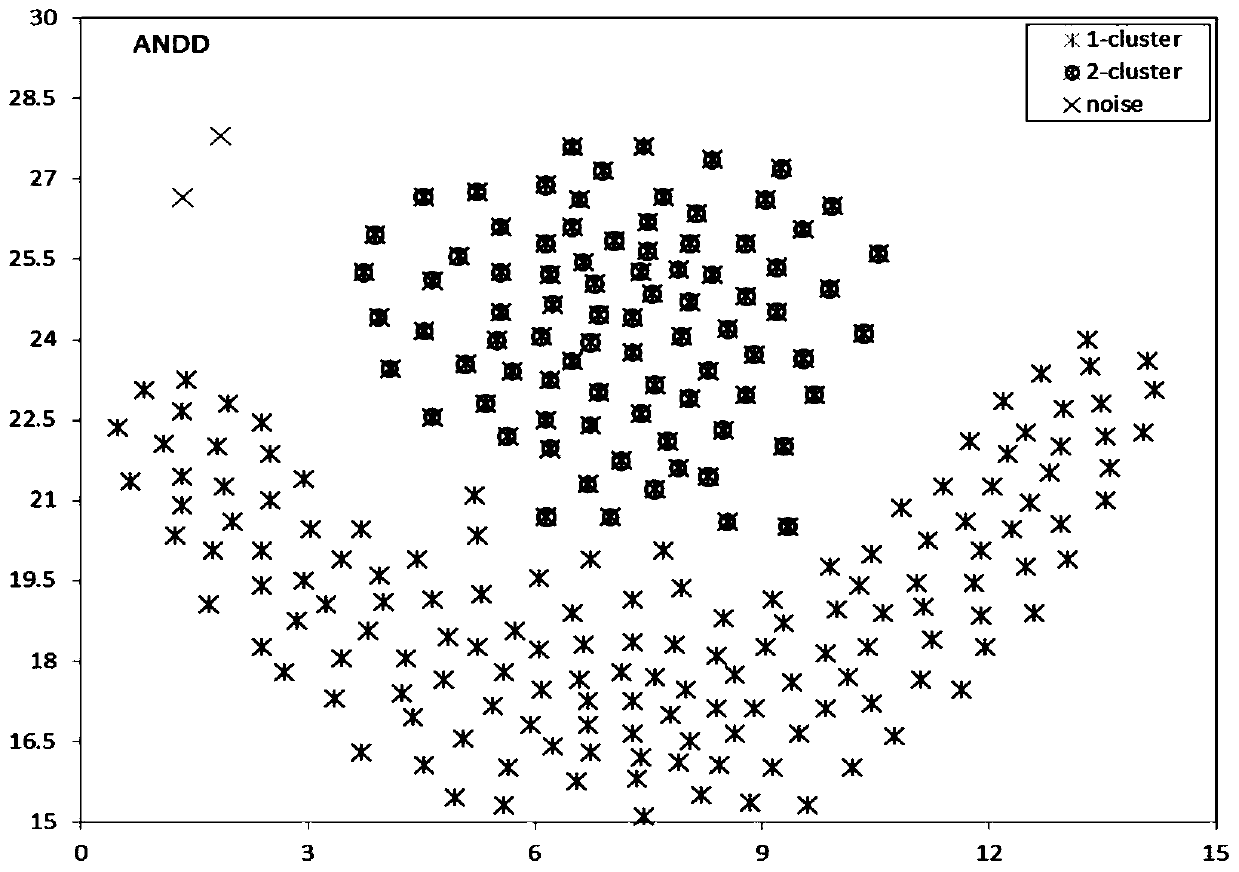
The invention discloses a multi-source atmospheric data clustering method based on distribution density. The method comprises the following steps: firstly constructing a data set DS which is composedof M-dimensional data and is N in data size, and judging the clustering trend of the data set DS; secondly, generating a full neighborhood distribution density matrix DDM of a distance matrix DM of the data set; then, taking a distribution density threshold ddth as a parameter, and dividing a density peak value and discrete points of the full neighborhood distribution density matrix DDM; and finally, intercepting an edge matrix E of all the data, and merging part of discrete point into the density peak value to obtain a clustering result. The clustering result is controlled only by using a single parameter of the distribution density threshold, and data with any distribution shape and distribution uniformity can be clustered; and noisy points can be automatically separated.

Description

technical field [0001] The invention belongs to the field of data mining, and in particular relates to a multi-source atmospheric data clustering method based on distribution density. Background technique [0002] In the practical application of big data mining and analysis, data is collected from different sources in different fields or acquired from different feature collectors. For example, a certain image shared on a website often has text tags and descriptions from different sources; a specific news is reported by multiple news organizations; the same semantics (such as hello) is represented in multiple languages; images are described by different types of features . All of these are called multi-source data (or multi-view data). These data show heterogeneity, yet potential associations. In other words, each individual source (or view) in these data has its specific properties for the knowledge discovery task, while different sources usually contain complementary inf...

Claims


Application Information

Patent Timeline
IPC IPC(8): G06K9/62G06F17/16G06F16/901G06F16/906
CPCG06F17/16G06F16/9024G06F16/906G06F18/23Y02A90/10
Inventor 樊仲欣
Owner NANJING UNIV OF INFORMATION SCI & TECH
Learn More