
Method for Quantitative Calculation of Concentration of Complex Spectral Components

A complex spectrum and quantitative calculation technology, applied in the field of quantitative calculation of the concentration of complex spectral components, can solve problems such as large amount of calculation, large deviation of complex system, and inability to meet the needs of data output, so as to improve the calculation speed, speed up the calculation speed, The effect of speeding up calculation speed and accuracy

Active Publication Date: 2021-03-16
近通物联网(苏州)有限公司
View PDF13 Cites 0 Cited by
  • Summary
  • Abstract
  • Description
  • Claims
  • Application Information

AI Technical Summary

Problems solved by technology

Spectral preprocessing generally includes four steps: baseline correction, scattering correction, smoothing and normalization. The correction model is generally carried out by the least square method or multiple linear regression method. For simple systems, the least square method or multiple linear regression method are more effective. However, complex systems often have large deviations
[0003] With the development of artificial intelligence, the application of deep learning algorithms to qualitative and quantitative analysis of spectra has also received more attention. Neural networks can automatically learn the hidden multidimensional features in molecular spectra from raw data, which is better for qualitative models. However, due to the large amount of parameters in the deep learning algorithm, the calculation amount is too large and the response is slow, which cannot meet the needs of the on-site monitoring spectrometer to output data immediately. At the same time, due to the large number of parameters, it is easy to cause overfitting, resulting in distortion

Method used


Image

  • Method for Quantitative Calculation of Concentration of Complex Spectral Components
  • Method for Quantitative Calculation of Concentration of Complex Spectral Components
  • Method for Quantitative Calculation of Concentration of Complex Spectral Components

Examples


Embodiment Construction

[0042] In order to make the object, technical solution and advantages of the present invention clearer, the present invention will be further described in detail below in conjunction with the accompanying drawings and embodiments.

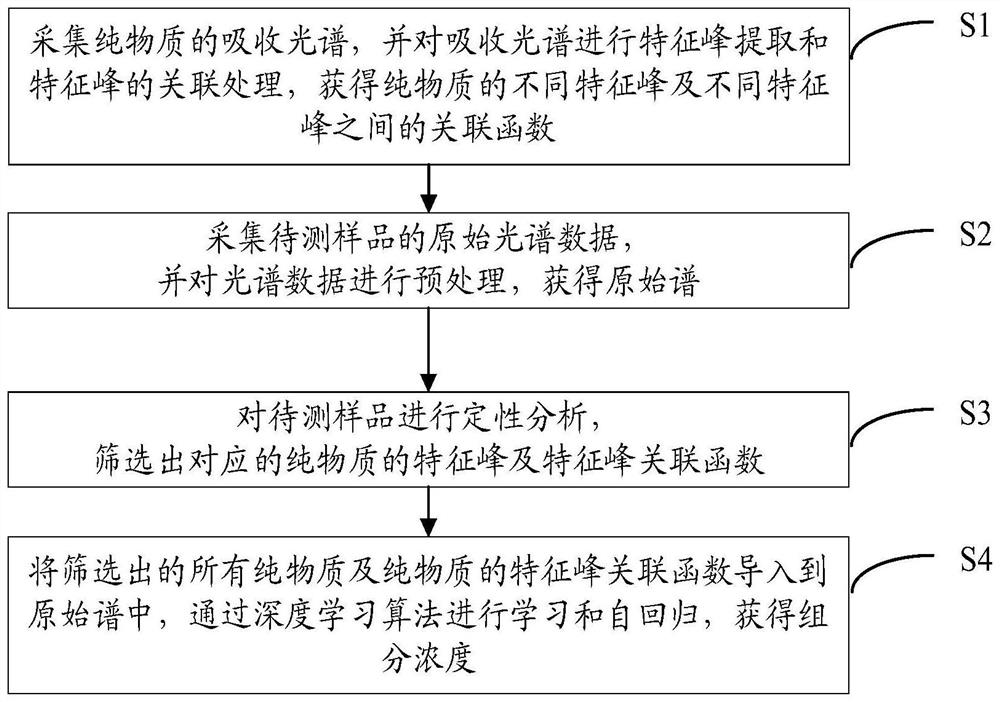
[0043] figure 1 The method for quantitatively calculating the concentration of complex spectral components of the present invention is schematically provided, including the following steps,

[0044] Step S1: collect the absorption spectrum of the pure substance, and perform characteristic peak extraction and correlation processing on the absorption spectrum to obtain different characteristic peaks of the pure substance and correlation functions between different characteristic peaks;

[0045] Therefore, the correlation processing is performed on the characteristic peaks of pure substances, so that the characteristic peaks of substances on the spectrum are no longer isolated factors, which is beneficial to speed up the calculation, and can eliminate...


PUM


Abstract

The invention discloses a method for quantitatively calculating complex spectral component concentration. The method comprises the following steps of: acquiring an absorption spectrum of a pure substance to obtain different characteristic peaks of the pure substance and correlation functions among the different characteristic peaks; collecting spectral data of a to-be-detected sample to obtain anoriginal spectrum; carrying out qualitative analysis on the to-be-detected sample, and screening out the corresponding characteristic peaks and characteristic peak correlation functions of the pure substance; and importing all the screened pure substance and the characteristic peak correlation functions of the pure substance into the original spectrum, and performing learning and autoregression through adopting a deep learning algorithm to obtain the component concentration. According to the method, different characteristic peaks of the single pure substance are associated, so that the calculation speed is effectively increased; deep learning algorithm regression can be carried out on all characteristic peak concentrations of different components on the spectrum at the same time, so that the calculation speed and accuracy are improved; and a deep learning algorithm is adopted for concentration regression analysis instead of substance identification, the calculation speed is further increased, and calculation data can be output in real time.

Description

technical field [0001] The invention relates to the field of spectral data processing, in particular to a method for quantitatively calculating the concentration of complex spectral components. Background technique [0002] The development of chemometrics has promoted the development of spectral analysis in environmental analysis and other fields. At present, it is widely used in the qualitative and quantitative analysis of infrared spectroscopy and Lapp spectroscopy. The general analysis process includes two steps of spectral preprocessing and calibration model. Spectral preprocessing generally includes four steps: baseline correction, scattering correction, smoothing and normalization. The correction model is generally carried out by the least square method or multiple linear regression method. For simple systems, the least square method or multiple linear regression method are more effective. However, complex systems often have large deviations. [0003] With the devel...

Claims


Application Information

Patent Timeline
Patent Type & Authority Patents(China)
IPC IPC(8): G01N21/31
CPCG01N21/31
Inventor 李扬刘晓海
Owner 近通物联网(苏州)有限公司
Learn More