A multifactorial co 2 Corrosion Prediction Chart Establishment Method

A technology for establishing methods and predicting graphs, applied in design optimization/simulation, etc., can solve problems such as corrosion, achieve accurate prediction, overcome incomplete consideration of factors, and break through the effect of narrow effective input range

Active Publication Date: 2022-02-22
SOUTHWEST PETROLEUM UNIV
View PDF8 Cites 0 Cited by
  • Summary
  • Abstract
  • Description
  • Claims
  • Application Information

AI Technical Summary

Problems solved by technology

[0005] The purpose of the present invention is to provide a CO 2 Corrosion Prediction Chart Establishes Methodology to Address Existing CO 2 Corrosion prediction problems, and while achieving the above objectives, for the CO 2 Corrosion prediction provides the basis

Method used


Image

  • A multifactorial co  <sub>2</sub> Corrosion Prediction Chart Establishment Method
  • A multifactorial co  <sub>2</sub> Corrosion Prediction Chart Establishment Method
  • A multifactorial co  <sub>2</sub> Corrosion Prediction Chart Establishment Method

Examples


Embodiment example

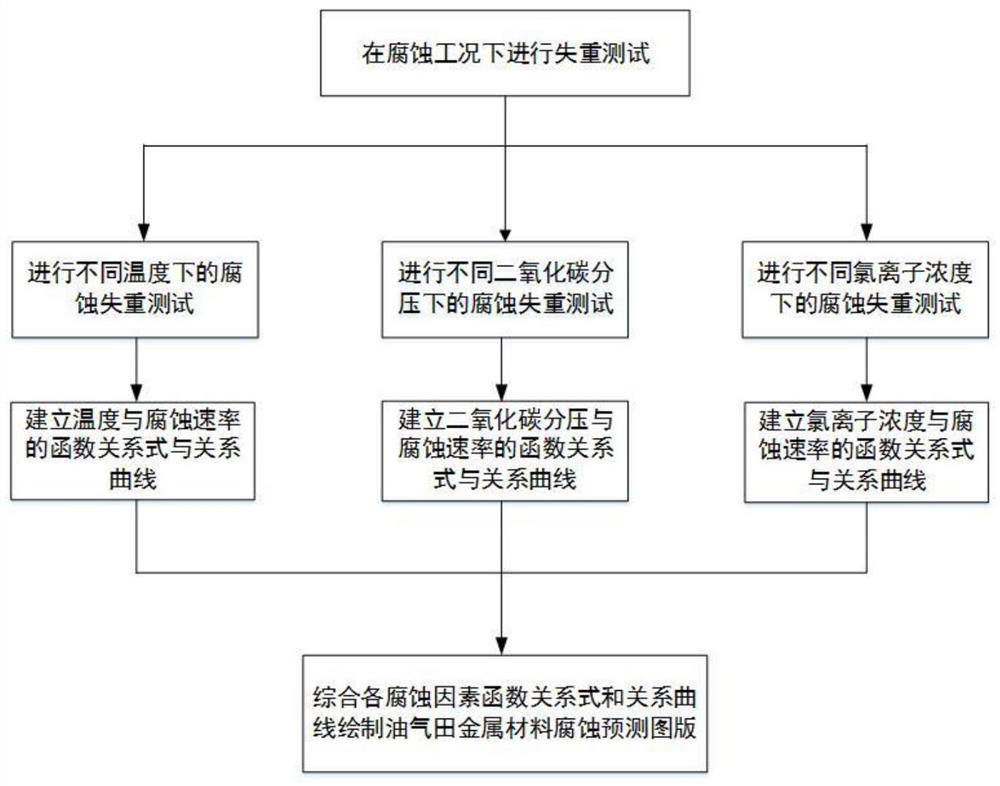
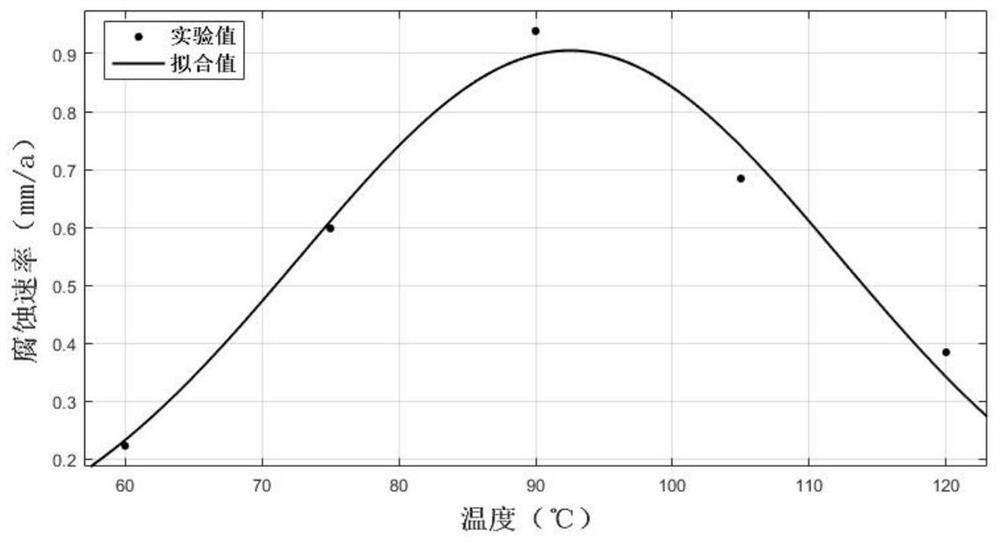
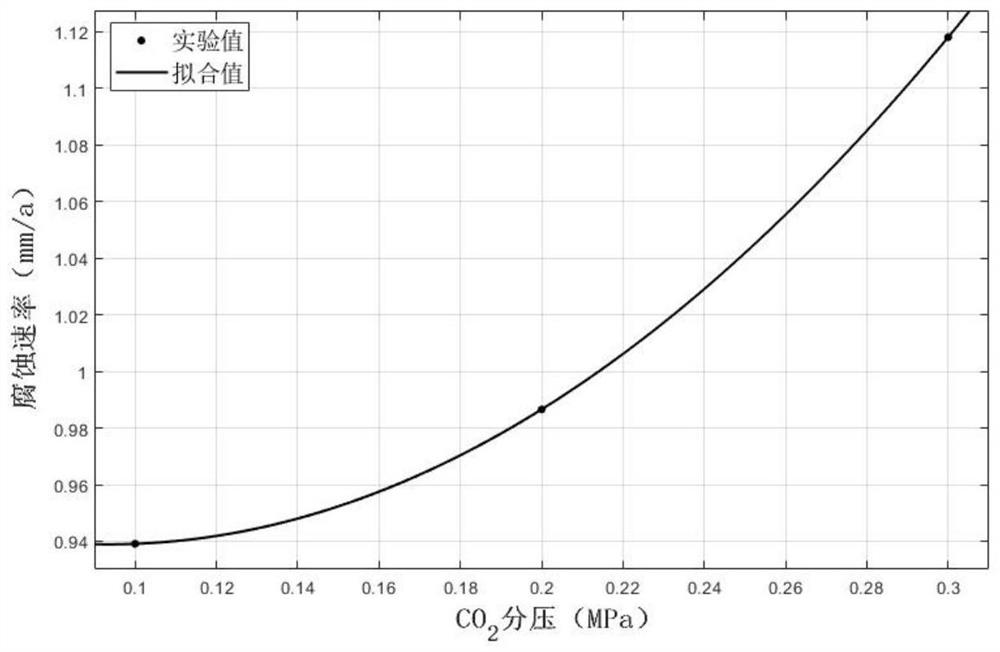
[0035] Simulate the actual working conditions of the XX oilfield, and draw a corrosion prediction chart for the D-grade rod steel. The working conditions are as follows: the wellbore temperature ranges from 60°C to 120°C, the CO 2 The partial pressure range is 0.1MPa~0.3MPa, and the chloride ion concentration range is 1000ppm~3000ppm. The specific implementation steps are as follows:

[0036] Step 1: Determine the parameter ranges of various influencing factors according to the actual working conditions of XX Oilfield, where the temperature parameters are 60°C, 75°C, 90°C, 105°C, 120°C, CO 2 Partial pressure parameters are 0.1MPa, 0.2MP, 0.3MPa and chloride ion concentration parameters are 1000ppm, 2000ppm, 3000ppm;


PUM


Abstract

The invention discloses a CO that considers multiple factors 2 The invention discloses a method for establishing a corrosion prediction chart, belonging to the technical field of corrosion protection of oil and gas fields. The method includes: first, at different temperatures, CO 2 Under the partial pressure and chloride ion concentration, the corrosion weight loss test of steel was carried out in a high temperature autoclave to obtain the measured value of the corrosion rate; then the nonlinear fitting method was used to establish the relationship between the corrosion rate and temperature, CO 2 The functional relationship and relationship curve of partial pressure and chloride ion concentration; finally, the measured value of corrosion rate, functional relationship and relationship curve obtained above are combined to draw CO 2 Corrosion prediction chart. This method takes into account a variety of factors for CO 2 The impact of corrosion has high prediction accuracy and practicability, which provides a reference for preventing corrosion failure of metal facilities in oilfields, and provides a technical guarantee for the safe use of materials.

Description

technical field [0001] The invention belongs to the technical field of oil and gas field corrosion protection, and specifically relates to a CO 2 Corrosion prediction chart building method. Background technique [0002] During oil and gas field development, CO 2 The gas will cause serious corrosion to the pipes in the wellbore and surface equipment, causing corrosion failure of metal equipment, and even causing safety accidents. Indoor corrosion simulation is the main method to evaluate the corrosion resistance of materials, but how to obtain the corrosion law of materials through the limited test data of indoor experiments is the key to predicting the applicability of materials and preventing equipment failure. , it is necessary to draw a reliable CO 2 The corrosion prediction chart is used to predict the corrosion life of metal pipes. [0003] At present, for the corrosion prediction of metal facilities in oil and gas fields, Zhao Yongtao of CNPC and others proposed "a...

Claims


Application Information

Patent Timeline
Patent Type & Authority Patents(China)
IPC IPC(8): G06F30/20
Inventor 曾德智韩雪喻智明董宝军于晓雨张新杨建起蔡乐乐
Owner SOUTHWEST PETROLEUM UNIV
Why Eureka
Try Eureka