Method and device for specifying center of rotation based on optical projection tomography sinogram

An optical projection tomography and sinogram technology, which is used in material analysis, measuring devices, scientific instruments, etc. by optical means, can solve the problems of image artifacts, slow running speed, etc., and achieves the goal of reducing artifacts and improving imaging quality. Effect

Active Publication Date: 2021-06-29
FOSHAN UNIVERSITY
View PDF0 Cites 0 Cited by
  • Summary
  • Abstract
  • Description
  • Claims
  • Application Information

AI Technical Summary

Problems solved by technology

[0004] For the iterative method, this method runs slowly; while the method based on the projection address averaging method obtains a high accuracy of the projection rotation center, but it cannot accurately locate the projection rotation center when the projected sinogram loses information.
[0005] In the filter back projection reconstruction algorithm (Zhang Shunli, Li Weibin, Tang Gaofeng. Research on filter back projection image reconstruction algorithm [J]. Journal of Xianyang Normal University, 2008, 23(4)), the data collected by the sample at a certain angle is For the ray projection value at this angle, the reconstructed value of a certain point in the fault plane is the average value of all the ray projection values ​​passing through the point at different angles in the plane, and the projection information of the sample at different angles is collected, and all the ray projection values ​​of the same fault plane are collected The projection information of the corresponding angle difference is arranged to form the corresponding sinusoidal image, then the projection position of a point on the sample in space at different angles corresponds to a sinusoidal line (discrete) on the sinusoidal image, and the horizontal axis corresponding to the center line of the sinusoidal line is the projection information of the sample rotation center point at different angles. In the back projection process, the position information at different angles is evenly wiped back according to the projection angle, and the algorithm defaults the central horizontal axis of the sinusoidal image as the sample rotation center point at different angles. However, in the actual experimental operation, due to the inevitable deviation of the sample projection rotation center, the sinusoidal line in the sinusoidal image formed by the sample will move up or down as a whole, that is, the center of the sinusoidal image The information corresponding to the horizontal axis is not always the projection rotation center information of the sample, which causes obvious artifacts in the back-projected image

Method used


Image

  • Method and device for specifying center of rotation based on optical projection tomography sinogram
  • Method and device for specifying center of rotation based on optical projection tomography sinogram
  • Method and device for specifying center of rotation based on optical projection tomography sinogram

Examples


Embodiment 1

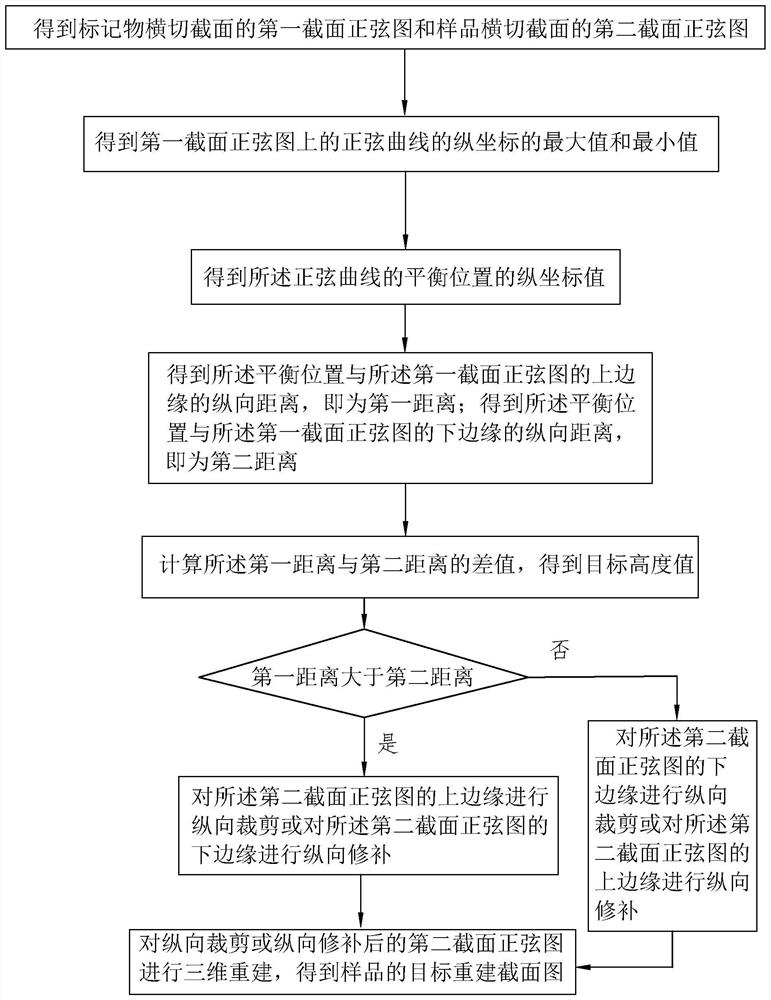
[0049] Embodiment 1, with reference to figure 1, a method for denoting the center of rotation based on an optical projection tomography sinogram, the method comprising:

[0050] The projected centers of rotation of the marker and the sample are the same;

[0051] Obtaining a first cross-section sinogram of the cross-section of the marker and a second cross-section sinogram of the cross-section of the sample;

[0052] Obtain the maximum value and minimum value of the ordinate of the sinusoidal curve on the first section sinogram;

[0053] Obtain the ordinate value of the equilibrium position of the sine curve through the maximum value and the minimum value;

[0054] Obtain the longitudinal distance between the equilibrium position and the upper edge of the first section sinogram, which is recorded as the first distance;

[0055] Obtain the longitudinal distance between the equilibrium position and the lower edge of the first section sinogram, which is recorded as the second ...

specific Embodiment approach

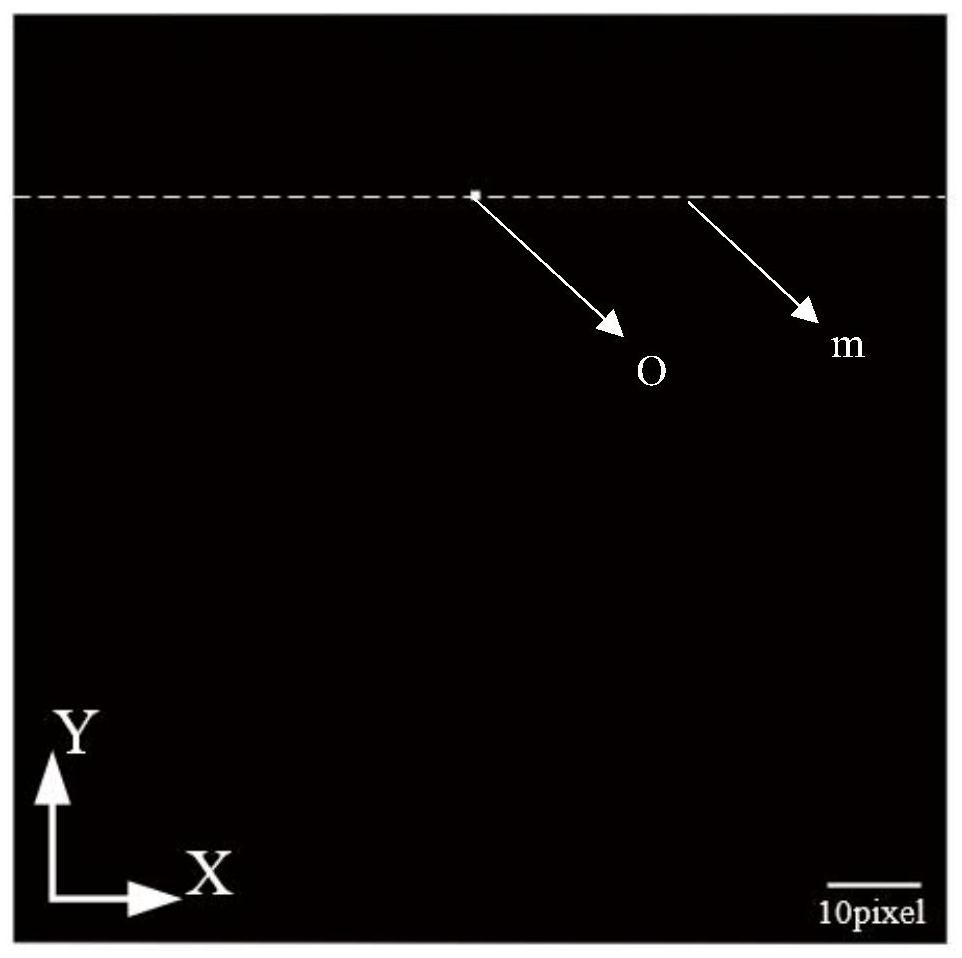
[0076] refer to figure 2 , create a 100*100 zero matrix, and assign a point of the matrix to "1", which is figure 2 Point O in , the cross-section of the simulated marker in this experiment is approximately a point, and the O point is taken as the cross-section of the simulated marker. Among them, the vertical coordinate of point O is a1, and the vertical coordinates of all points on the line m are a1.

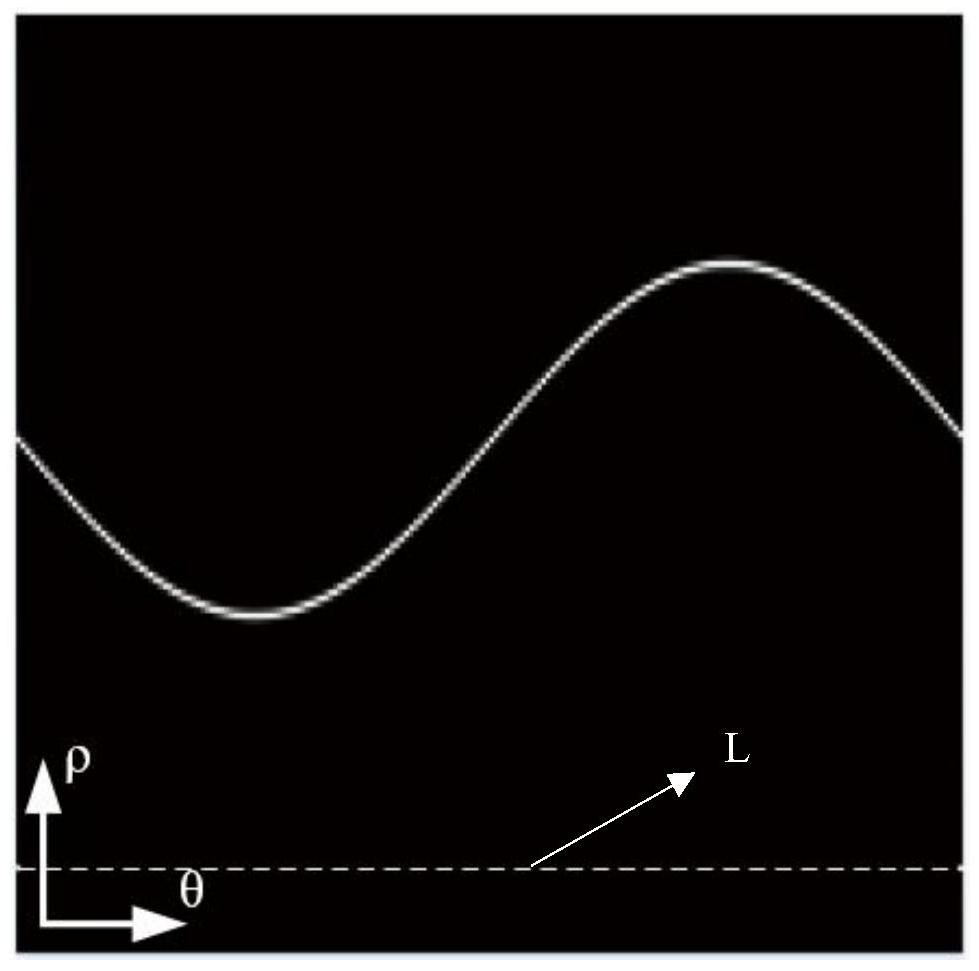
[0077] refer to image 3 , performing a radon transformation on the simulated marker, simulating and obtaining projection information at different angles during the 360° rotation of the simulated marker, and obtaining a first simulated sinogram of a cross-section of the simulated marker. After binarizing the first simulated sinogram, use the find function to obtain all the ordinate values ​​of the sinusoidal curve on the first simulated sinogram, and then use the max function and the min function to find the maximum value in these ordinates and the minimum value, by calcu...


PUM


Abstract

The invention discloses a method and device for marking the center of rotation based on an optical projection tomography sinogram. The method includes: the projection rotation center of the marker and the sample is the same, the first section sinogram and the second section sinogram are obtained, and the calculation The balance position of the first section sinogram is calculated by calculating the distance from the balance position to the upper edge and the lower edge of the first section sinogram to obtain the target height value, and the second section sinogram is longitudinally cut or longitudinally repaired, so The height values ​​of the longitudinal cropping and the longitudinal repairing are the target height values, and the back projection reconstruction is performed on the sinogram of the second section after the longitudinal cutting or longitudinal repairing to obtain the target reconstructed cross-sectional view of the sample. The invention quickly calculates the projection rotation center of the sample by introducing markers as reference objects without being affected by the complexity of the sample structure, realizes the correction of the projection rotation center, reduces the artifacts of the reconstruction section, and improves the imaging quality.

Description

technical field [0001] The present invention relates to the technical field of optical projection tomography, and more specifically relates to a method and a device for marking a center of rotation based on an optical projection tomography sinogram. Background technique [0002] Optical projection tomography OPT (optical projection tomography) is a new three-dimensional imaging technology, which has the advantages of non-contact, large detection depth and high resolution. It uses the projection information of the sample at different angles, and reconstructs the fault structure of the sample through the filtered back projection reconstruction algorithm, and then obtains the three-dimensional structure information of the sample. During the OPT imaging process, the deviation of the projected rotation center will lead to relatively serious artifacts in the reconstructed slices, which will degrade the quality of the reconstructed slices. Therefore, correcting the projection rota...

Claims


Application Information

Patent Timeline
Patent Type & Authority Patents(China)
IPC IPC(8): G01N21/84
CPCG01N21/84
Inventor 张艳婷林秋萍李秉尧韩定安易俊王雪花曾亚光王茗祎熊红莲
Owner FOSHAN UNIVERSITY
Why Eureka
Try Eureka