
A topological map drawing method based on big data

A topology map and big data technology, which is applied in the field of topological map drawing in Taiwan area, can solve problems such as unclear structure and irregular data, so as to solve the problem of irregular data, simplify structure, prevent and manage three-phase imbalance in Taiwan area. effect of the problem

Active Publication Date: 2019-03-01
STATE GRID SHANDONG ELECTRIC POWER +1
View PDF8 Cites 13 Cited by
  • Summary
  • Abstract
  • Description
  • Claims
  • Application Information

AI Technical Summary

Problems solved by technology

[0004] In order to solve the problems existing in the prior art of drawing the topological map of the station area, the present invention innovatively applies graph theory and big data mining technology a priori algorithm (apriori algorithm) to the low-voltage station area "transformer-line-metering box-electric energy meter-customer In drawing the topological map, the minimum spanning tree algorithm is used to realize the automatic drawing of the topological map of the station area and the display of a chart with the key information of customers. , automatic calibration” mode change, saving costs, improving the accuracy of drawing, work efficiency and the consistency rate of distribution in low-voltage station areas, and effectively solving the status quo of non-standard data and unclear structures at the end of the power grid; on the other hand, making full use of A large number of valuable data resources in the marketing system have been collected, providing strong support for the visual and accurate service of the station manager, the phase sequence of the household meter is more clear, and the in-depth application related to the phase-separated load forecasting has been fully developed.

Method used


Image

  • A topological map drawing method based on big data
  • A topological map drawing method based on big data
  • A topological map drawing method based on big data

Examples


Embodiment 1

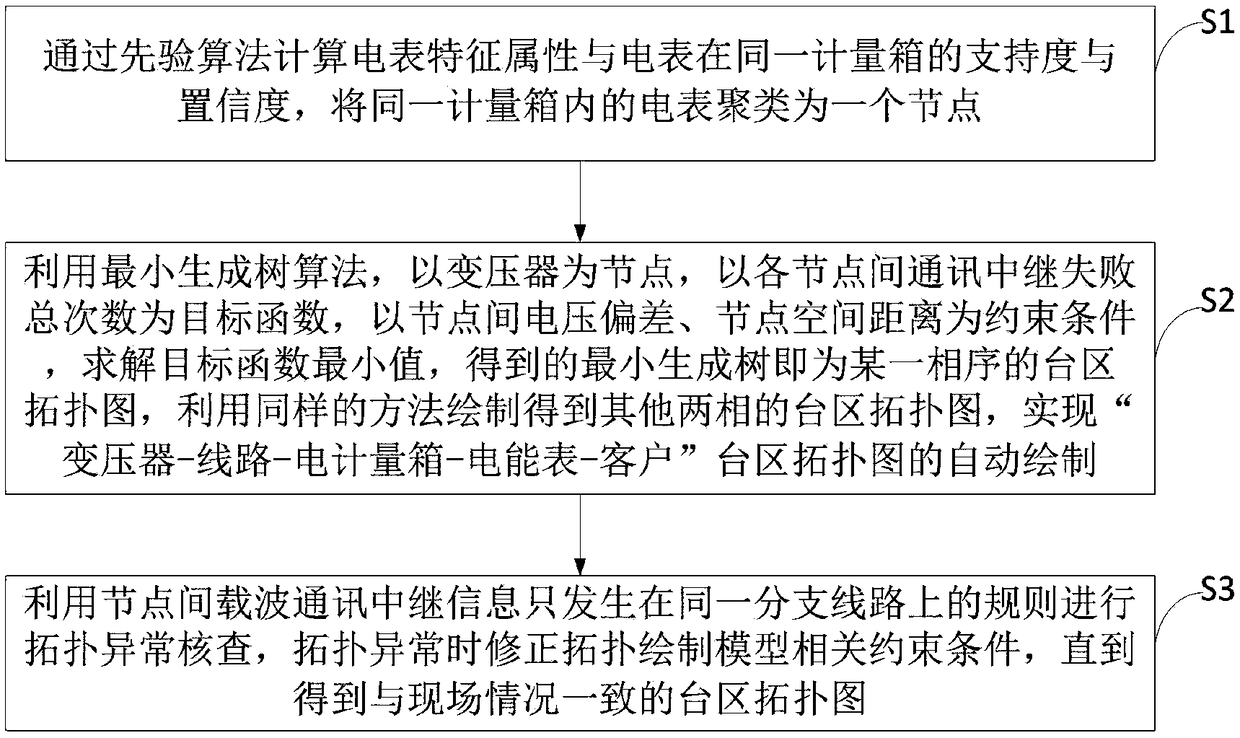
[0060] Such as figure 1 As shown, in the technical solution of the present invention, a method for drawing a topological map of a station area based on big data includes the following steps:

[0061] S1. Calculate the support and confidence of the meter feature attribute and the meter in the same metering box through a priori algorithm, and cluster the meters in the same metering box into a node.

[0062] S2, using the minimum spanning tree algorithm, using the transformer as a node, taking the total number of communication relay failures between nodes as the objective function, taking the voltage deviation between nodes and the node space distance as constraints, to solve the minimum value of the objective function, and the obtained minimum generation The tree is the topological map of a certain phase sequence. Use the same method to draw the topological map of the other two phases to realize the automatic drawing of the topological map of the "transformer-line-electric meter...

Embodiment 2

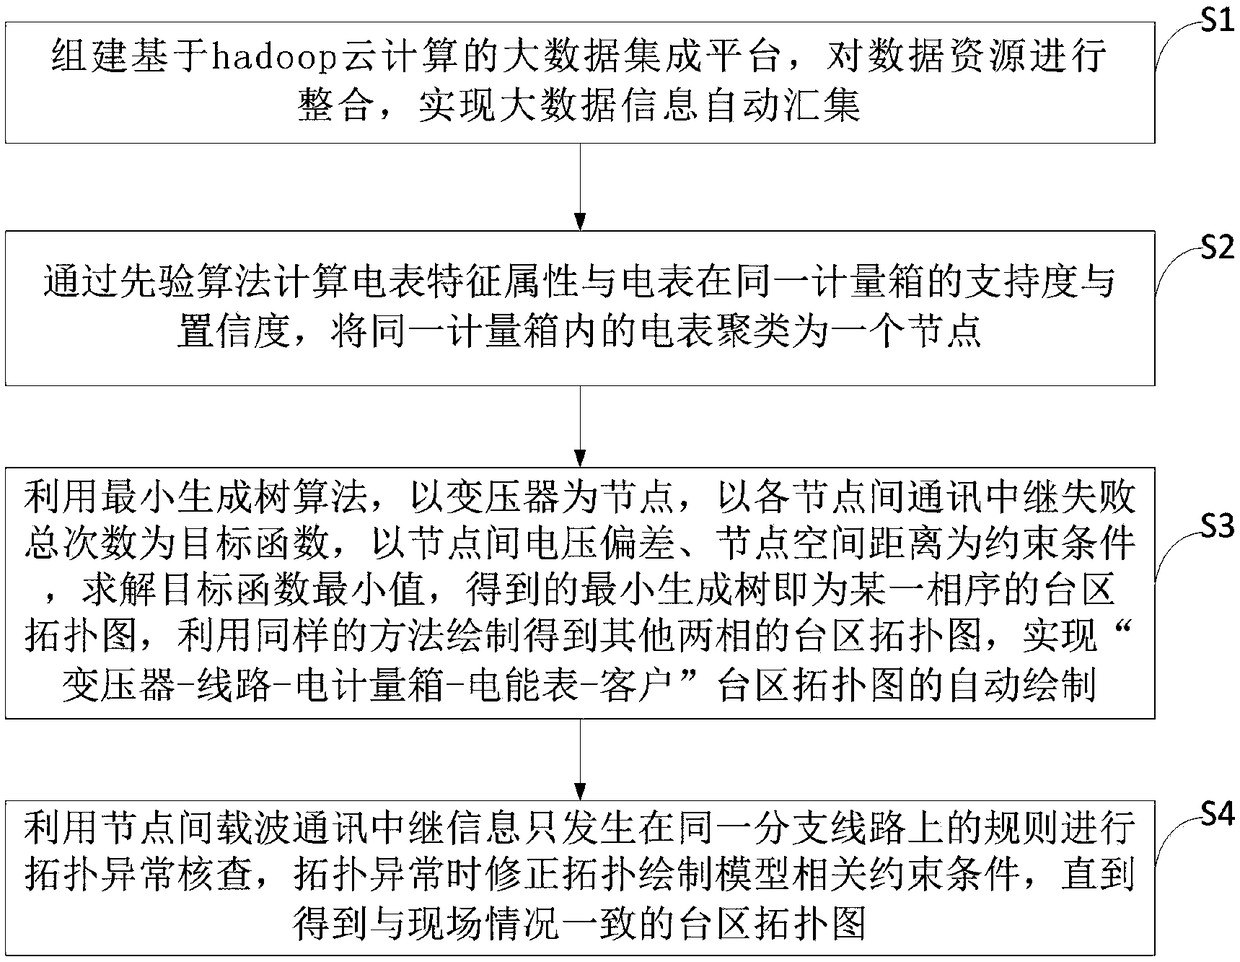
[0101] Such as image 3 As shown, in the technical solution of the present invention, a method for drawing a topological map of a station area based on big data includes the following steps:

[0102] S1, set up a big data integration platform based on hadoop cloud computing, integrate data resources, and realize automatic collection of big data information.

[0103] S2. Calculate the support and confidence of the meter feature attribute and the meter in the same metering box through a priori algorithm, and cluster the meters in the same metering box into a node.

[0104] S3, using the minimum spanning tree algorithm, using the transformer as a node, taking the total number of communication relay failures between nodes as the objective function, taking the voltage deviation between nodes and the node space distance as constraints, to solve the minimum value of the objective function, and the obtained minimum generation The tree is the topological map of a certain phase sequenc...

Embodiment 3

[0111] Such as Figure 4 As shown, in the technical solution of the present invention, a method for drawing a topological map of a station area based on big data includes the following steps:

[0112] S1. Calculate the support and confidence of the meter feature attribute and the meter in the same metering box through a priori algorithm, and cluster the meters in the same metering box into a node.

[0113] S2, using the minimum spanning tree algorithm, using the transformer as a node, taking the total number of communication relay failures between nodes as the objective function, taking the voltage deviation between nodes and the node space distance as constraints, to solve the minimum value of the objective function, and the obtained minimum generation The tree is the topological map of a certain phase sequence. Use the same method to draw the topological map of the other two phases to realize the automatic drawing of the topological map of the "transformer-line-electric mete...


PUM


Abstract

In order to solve the problems existing in the prior art of station area topology drawing, the invention innovatively applies a priori algorithm (apriori algorithm) of graph theory and big data miningtechnology to a low-voltage station area transformer-line-meter box-electric energy meter-client, the minimum spanning tree algorithm is used to realize the automatic drawing of the topology diagramof the platform area and the display of a chart with the key information of the customer. On the one hand, the topology diagram is measured on the spot, The traditional mode of manual maintenance is transformed into automatic drawing and automatic checking mode, which saves the cost, improves the drawing accuracy, work efficiency and the level of matching consistency in low voltage platform area,and effectively solves the data non-standard and structure ambiguity at the end of the power network. On the other hand, it makes full use of a large number of precious data resources in the marketingsystem to provide strong support for the visualization and precision service of the manager of the station area, and makes the phase sequence of the household table more definite, so as to fully carry out the deep application related to the phase-separated load forecasting.

Description

technical field [0001] The invention relates to a method for drawing a topological map of a station area, in particular to a method for drawing a topological map of a station area based on big data. Background technique [0002] As the end of the power grid, the low-voltage station area is an important foundation of the Energy Internet and a key link that affects the service level of power supply. With the deepening of the reform of the power system, the pressure of high-quality services for power companies continues to increase. How to accurately draw the topological map of the station area under the current conditions, realize the visualization of the emergency repair path, effectively reduce the length of emergency repairs of the distribution network, and reduce the length of outages. Accurately calculate phase-separated loads, continuously optimize the distribution network structure, continuously improve the quality and efficiency of business expansion, shorten the avera...

Claims


Application Information

Patent Timeline
Patent Type & Authority Applications(China)
IPC IPC(8): G06F16/29G06Q50/06
CPCG06Q50/06Y04S10/50Y02D10/00
Inventor 赵新贞李向奎黄光政韩为民杨阳李昊李欣马运马桂荣
Owner STATE GRID SHANDONG ELECTRIC POWER
Learn More