


Quick Research
Generate reliable direction feasibility study reports for your R&D in just a few steps.

Technical Q&A
Discover and master advanced knowledge NOW. Basics, ideas, possibilities, all at once.

Find Solutions
As an expert in R&D theories, this can generate solutions to your technical problems instantly.

Evaluate Feasibility
Analyze your overall solution with one click, know your potential R&D risks in advance.

Monitor Landscape
Get weekly tech updates, stay abreast of the latest tech innovations and key insights.
Method for determining the quantity of an hba1c in a blood sample
A technology of blood samples and liquids, applied in the field of volume suits, can solve the problems of cost reduction and increase of ease
- Summary
- Abstract
- Description
- Claims
- Application Information
AI Technical Summary
Problems solved by technology
Method used
Image

Examples
example 1
[0096] Example 1. HbA1c assay and calibration process
[0097] sample
[0098] Six calibrator samples (all representing different levels of HbAlc concentration in human blood) were purchased from the Lyphochek Hemoglobin Alc Linear Set (BIO-RAD). Six samples from this BIO-RAD kit were lysed according to the manufacturer's instructions.
[0099] The six linear samples and raw signal values for TRACE measurements are reported in Table 1 below.
[0100] Table 1
[0101]
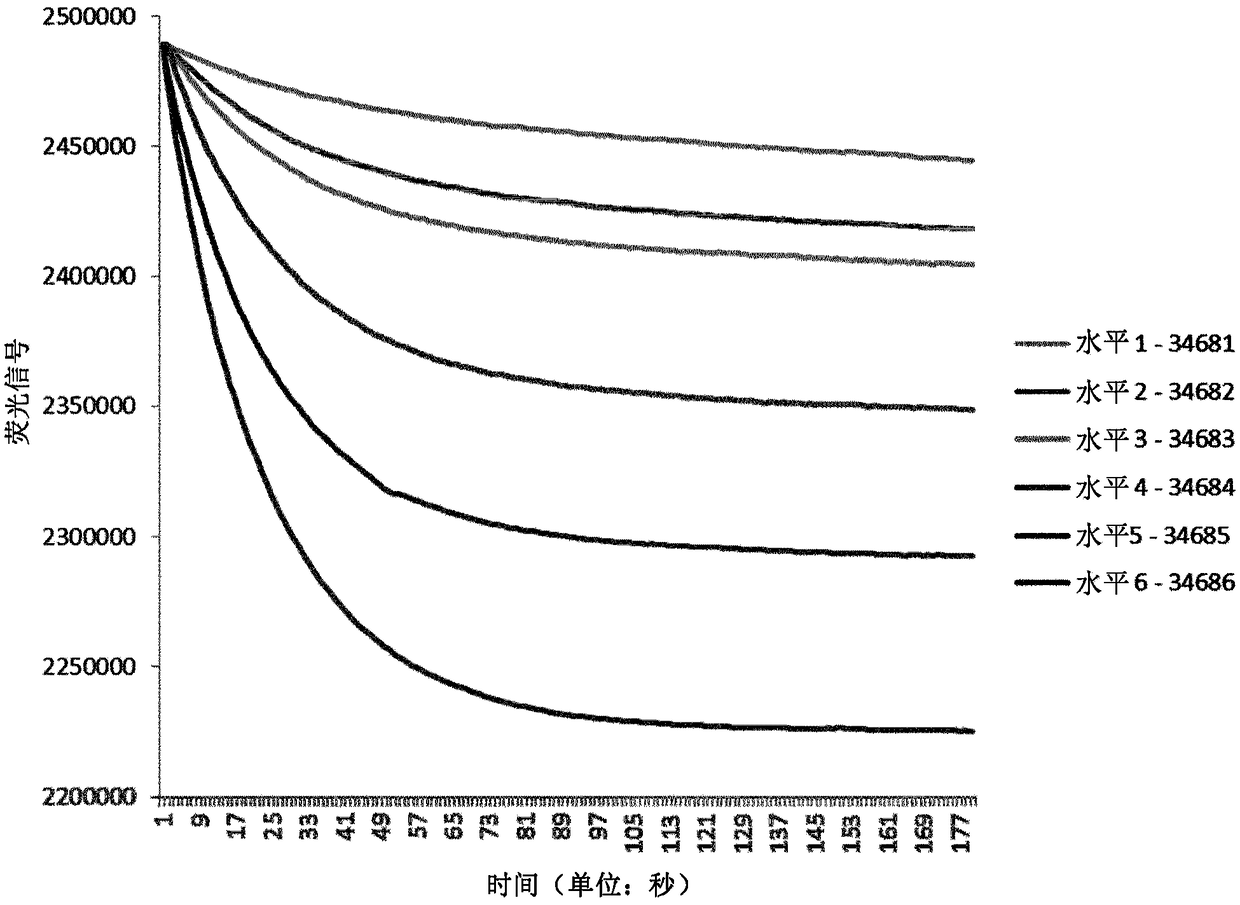
[0102] Table 1 shows the TRACE measurements of the six calibrators (BIO-RAD). In column 2, the TRACE fluorescence signal is shown. In column 3, the total hemoglobin signal is shown, while in column 4, the final TRACE HbA1c raw signal is shown. Column 1 shows six different levels of HbA1c, each level representing a specific HbA1c concentration. Column 2 shows the raw signal of HbAlc reported in the 510 nm fluorescence channel 20 seconds after the decrease in fluorescence was measured after the addition...
example 2
[0118] Example 2. HbA1c Accuracy Process
[0119] According to Example 1, a sample of 40 patients obtained from the Herlev Hospital was measured with respect to TRACE. Known values reported in NGSP format were obtained from the Roche cobas c system (Tina-quant HbA1c assay) for each sample.
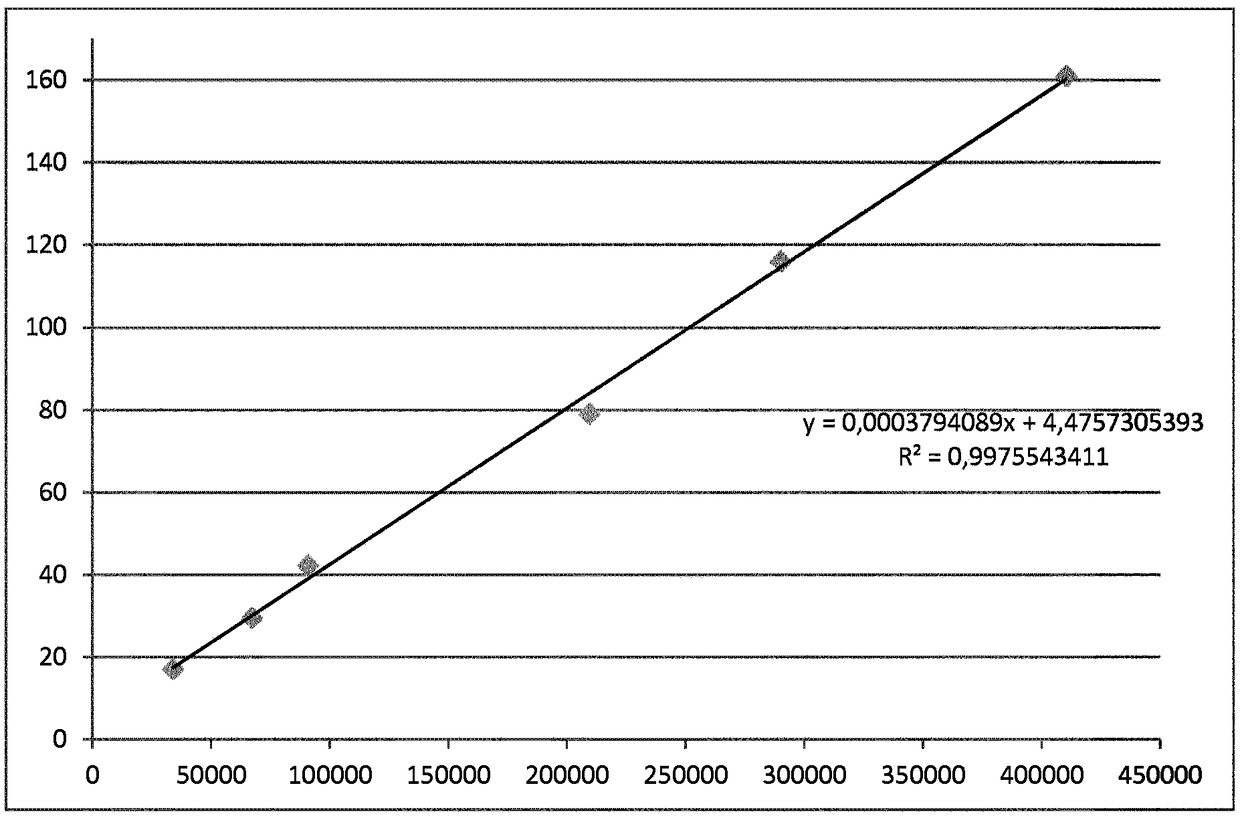
[0120] In Table 3, using Figure 4 The calibration algorithm shown in converts the TRACE raw signal for 40 patient samples into 40 NGSP values.
[0121] table 3
[0122]
[0123] Figure 5 The content of Table 3 is shown graphically, where the raw TRACE HbA1c signal from 40 patients is shown (x-axis) as a function of the final TRACE NGSP signal (y-axis).
[0124] In Table 4, samples from 40 patients run on TRACE are compared to samples from the same 40 patients run on the Roche cobas c system (Tina-quant HbA1c assay format).
[0125] Table 4
[0126]
[0127] Figure 6 The content of Table 4 is shown graphically, however, the TRACE HbA1c NGSP results from 40 patients are sho...
example 3
[0134] Example 3. HbA1c Accuracy Process
[0135] Liquichek diabetes control levels 1, 2 and 3 (BIO-RAD criteria) were measured on TRACE over five days. Each control was measured four times per day. A total of 3×4×5=60 measurements are performed according to examples 1 and 2.
[0136] Calibration was performed to the Tina-quant HbA1c assay format and values were reported in NGSP units.
[0137] Table 6 shows the means as well as the within and between %CV displays.
[0138] Table 6
[0139]
[0140] According to the NGSP plan, the recommendation for the accuracy of the HbA1c assay should be less than 3.5%. As shown in Table 6, the method according to the present invention brings this standard into compliance with the NGSP recommendation for accuracy standards.
PUM
 Abstract
Description
Claims
Application Information
 - R&D Engineer
- R&D Manager
- IP Professional
- Industry Leading Data Capabilities
- Powerful AI technology
- Patent DNA Extraction
Browse by: Latest US Patents, China's latest patents, Technical Efficacy Thesaurus, Application Domain, Technology Topic, Popular Technical Reports.
© 2024 PatSnap. All rights reserved.Legal|Privacy policy|Modern Slavery Act Transparency Statement|Sitemap|About US| Contact US: help@patsnap.com