Self-adaptive anisotropic divided frequency partition filtering method based on energy frequency band distribution
An anisotropic and partitioned filtering technology, which is applied in the direction of measuring devices, geophysical surveys, instruments, etc., can solve the problems of difficult and insufficient threshold selection of CL models, so as to improve denoising and boundary restoration capabilities, improve quality, and filter out The effect of noise protection
- Summary
- Abstract
- Description
- Claims
- Application Information
AI Technical Summary
Problems solved by technology
Method used
Image
Examples
Embodiment 1
[0041] Embodiment 1: see figure 1 , an adaptive anisotropic frequency division and partition filtering method based on energy frequency band distribution, comprising the following steps:
[0042] (1) Input two-dimensional post-stack seismic data u;
[0043] (2) Use VMD to decompose the two-dimensional post-stack seismic data in the frequency domain to obtain IMF profiles u in different frequency ranges k (k=1,2,...,n), n is an integer; in step (2), the method for VMD to decompose the two-dimensional post-stack seismic data in the frequency domain is,
[0044] Calculate u according to the following formula k (k=1,2,...,n)
[0045]
[0046] Among them, δ(t) is the Dirac function, ω k Indicates the center frequency of each frequency band range;
[0047] (3) Each decomposed IMF profile u k (k=1,2,...,n) are respectively subjected to multiple iterative processing through an adaptive threshold anisotropic filtering algorithm, and a reconstructed final result u is obtained a...
Embodiment 2
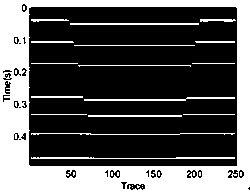
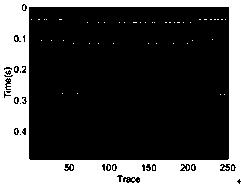
[0082] Such as figure 2 The artificially synthesized two-dimensional graben geological model is shown, in which the model contains 250 traces, each trace contains 490 sampling points, and the sampling frequency is 1ms. Two main faults are designed in the figure, and each fault contains breakpoints with different fault throws.
[0083] Such as image 3 as shown, image 3 yes figure 2 Section of the graben model after adding random Gaussian noise with a signal-to-noise ratio of -1db. Due to the influence of noise, the distance and breakpoints become blurred and difficult to distinguish clearly.
[0084] Figure 4 for will image 3 The sectional view after being processed for the method of the present invention; From Figure 4 The upper part and strata are visible, the breakpoints are recovered clearly, the lateral boundaries are clear, the weak amplitude is strengthened, the signal-to-noise ratio is also increased from -1dB to 13.4575dB, and the similarity is increased ...
Embodiment 3
[0086] Such as Figure 5 , Image 6 Shown are local raw actual data profiles and their processed profiles. Figure 5 It can be seen that the actual data often contain different types of noise. Due to the existence of noise, many weak amplitudes are covered by noise, small fault throws disappear, and the lateral continuity of formations is poor. Figure 5 and Image 6 It can be seen from the comparison that after being processed by the method of the present invention, the weak amplitude covered by the noise is restored and strengthened, the fault distance is clear, and the lateral continuity of the formation is strengthened.
PUM
 Abstract
Description
Claims
Application Information
 - R&D
- Intellectual Property
- Life Sciences
- Materials
- Tech Scout
- Unparalleled Data Quality
- Higher Quality Content
- 60% Fewer Hallucinations
Browse by: Latest US Patents, China's latest patents, Technical Efficacy Thesaurus, Application Domain, Technology Topic, Popular Technical Reports.
© 2025 PatSnap. All rights reserved.Legal|Privacy policy|Modern Slavery Act Transparency Statement|Sitemap|About US| Contact US: help@patsnap.com


