A method of online visual analysis ppt based on custom dynamic data
A dynamic data, self-defined technology, applied in the PPT field, can solve the problems of high-quality service supervision, high labor cost, frequent changes in caliber, etc., to improve the timeliness of demand response, strong adaptability, and improved experience.
- Summary
- Abstract
- Description
- Claims
- Application Information
AI Technical Summary
Problems solved by technology
Method used
Image
Examples
Embodiment Construction
[0063] The technical solution of the present invention will be further described in detail below in conjunction with the accompanying drawings.
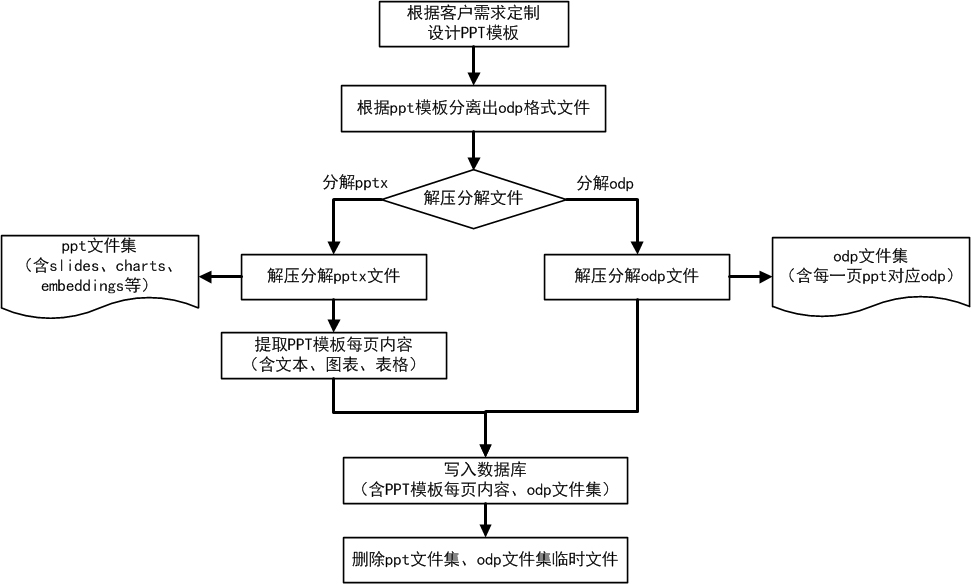
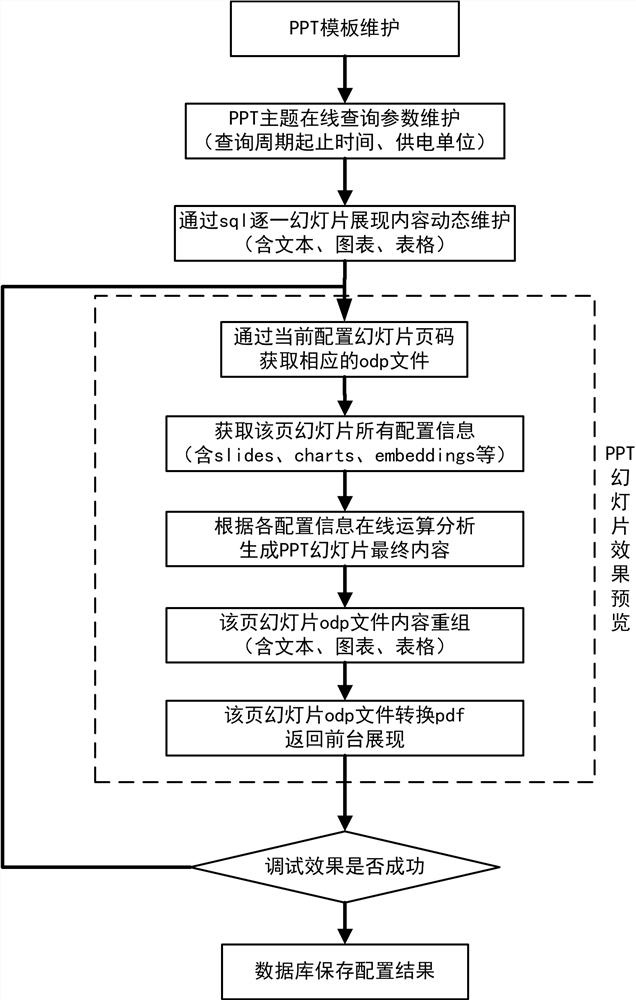
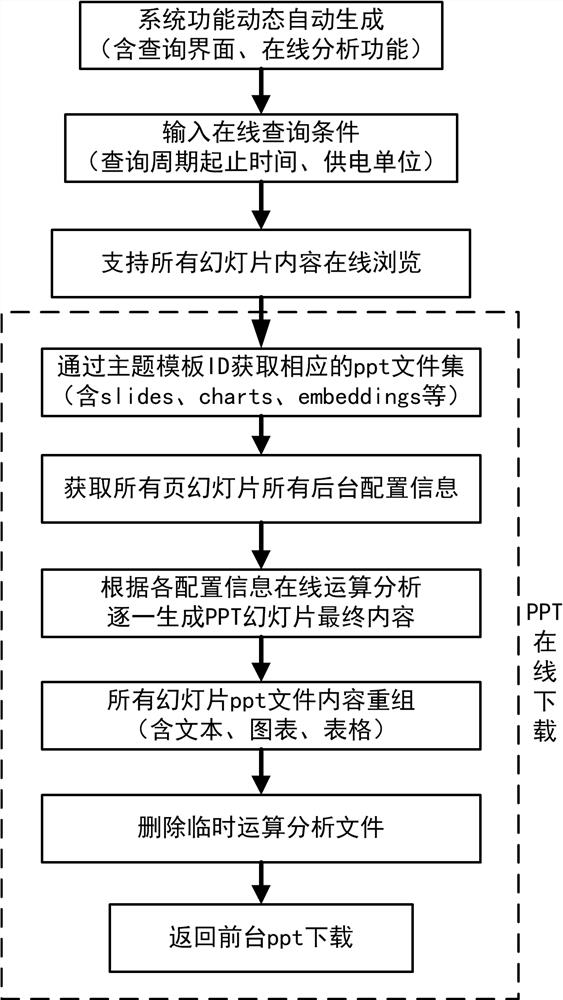
[0064] At present, the normalized work analysis report has the characteristics of a wide range of indicators, a large amount of data, high timeliness, and frequent caliber changes in business requirements. On the one hand, it needs an expressive carrier like PPT, and fully considers PPT in addition to commonly used texts. , table form, also supports column chart, stacked column chart, clustered column chart, clustered column chart, stacked line chart, three-dimensional pie chart, compound pie chart, compound bar pie chart, clustered bar chart, stacked bar Bar charts, area charts, scatter charts, stock charts, donut charts, 3D bubble charts, radar charts, etc. On the other hand, it needs to be compatible with timely demand response and efficient, accurate, and online index analysis. In order to solve this series of problems, the pres...
PUM
 Abstract
Description
Claims
Application Information
 - Generate Ideas
- Intellectual Property
- Life Sciences
- Materials
- Tech Scout
- Unparalleled Data Quality
- Higher Quality Content
- 60% Fewer Hallucinations
Browse by: Latest US Patents, China's latest patents, Technical Efficacy Thesaurus, Application Domain, Technology Topic, Popular Technical Reports.
© 2025 PatSnap. All rights reserved.Legal|Privacy policy|Modern Slavery Act Transparency Statement|Sitemap|About US| Contact US: help@patsnap.com


