
Transmission analysis-based graphical expressing method

An expression method and graphical technology, applied in special data processing applications, instruments, electrical digital data processing, etc., can solve the difficulty of positioning and troubleshooting for substation operation and maintenance personnel, and the interactive expression of IED equipment events is not intuitive and graphical enough, and cannot be guaranteed Substation safe and stable operation and other issues, to achieve the effect of easy to grasp the mapping rate and high application value

Inactive Publication Date: 2017-05-31
STATE GRID FUJIAN ELECTRIC POWER CO LTD +3
View PDF4 Cites 0 Cited by
  • Summary
  • Abstract
  • Description
  • Claims
  • Application Information

AI Technical Summary

Problems solved by technology

Due to the invisibility of the loop, it is difficult for substation operation and maintenance personnel to locate and troubleshoot the abnormal message communication caused by the failure of secondary devices and network equipment; the existing message recording products and solutions lack The information interaction process between IED devices is displayed in a graphical way, which brings a lot of difficulties to technical personnel, especially technical personnel with experience in traditional substation operation and maintenance background, in terms of understanding, operation, fault analysis and positioning, etc. It is conducive to the rapid diagnosis and positioning of faults, and it cannot guarantee the safe and stable operation of substations
[0004] Aiming at the above-mentioned problem that the interactive expression of IED equipment events in substation operation is not intuitive and graphical enough, a technical research is sought to capture, filter, store and translate substation messages, and finally express them in a dynamic and progressive graphical way , it is extremely meaningful; and through a period of theoretical research and based on the mastery of existing technologies, on the basis of detailed analysis, the research of substation-related events through graphical display is achievable

Method used


Image

  • Transmission analysis-based graphical expressing method

Examples


Embodiment Construction

[0031] The present invention will be further described below in conjunction with the accompanying drawings and embodiments.

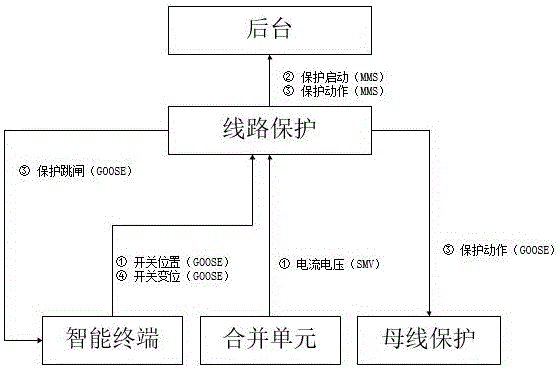
[0032] like figure 1 As shown, this embodiment provides a graphical expression method based on transmission analysis, which completes the transmission analysis among line protection, intelligent terminal, merging unit, busbar protection and background, and expresses it graphically, including the following step:

[0033] Step S1: analyzing the SCD file to obtain SCD information;

[0034] Step S2: Classifying, storing and indexing the analyzed SCD information;

[0035] Step S3: Access the substation data and analyze it;

[0036] Step S4: Express the analyzed data graphically.

[0037] In this embodiment, the step S1 is specifically: according to the schema, use the JAXB JAVA library to parse the SCD file, and the parsed content includes IED, data set, Inputs, DO, DA and description information for graphical display Extract the relevant information ne...


PUM


Abstract

The invention relates to a transmission analysis-based graphical expressing method. The transmission analysis-based graphical expressing method comprises the following steps of S1, analyzing an SCD file to obtain SCD information; S2, performing sorting and storing on the analyzed SCD information to establish index; S3, connecting substation data and analyzing the data; and S4, performing graphical expressing on the data obtained by analysis. By adoption of the transmission analysis-based graphical expressing method, virtual secondary loop graphical form and secondary loop restoration can be realized; in addition, an interaction process of a whole event can be described exhaustively in a dynamic form through a progressive expressing way, so that checking of the event and verification of the secondary loop can be performed conveniently, and quick fault positioning by an operation and maintenance staff can be realized conveniently.

Description

technical field [0001] The invention relates to the technical field of power system automation, in particular to a graphical expression method based on transmission analysis. Background technique [0002] The introduction of smart substation has brought many technical breakthroughs to traditional substation technology, which greatly simplifies the deployment and commissioning of substations, improves the reliability of secondary systems, and provides information for the reference of various intelligent electronic devices. The shared foundation makes the intercommunication and interoperability between secondary devices from different manufacturers easier. At the same time, the digitization of information brings up some new topics for system analysis. [0003] With the networking and signaling of smart substation information, traditional connections and terminals become invisible and intangible. Due to the invisibility of the loop, it is difficult for substation operation an...

Claims


Application Information

Patent Timeline
IPC IPC(8): H02J13/00G06F17/30
CPCG06F16/2228G06F16/248H02J13/00001
Inventor 唐志军林国栋翟博龙晁武杰石吉银郭健生林少真邹焕雄戴太文李涛
Owner STATE GRID FUJIAN ELECTRIC POWER CO LTD
Learn More