Application of a Molecular Marker in Association Analysis of Milk Yield and Protein Content Traits in Dairy Cows
A technology of protein content and molecular markers, applied in biochemical equipment and methods, microbiological determination/inspection, DNA/RNA fragments, etc., can solve problems such as not identifying SNPs, achieve shortened generation intervals, low cost, and intuitive pictures Effect
- Summary
- Abstract
- Description
- Claims
- Application Information
AI Technical Summary
Problems solved by technology
Method used
Image
Examples
Embodiment 1
[0037] Implementation example 1: application example
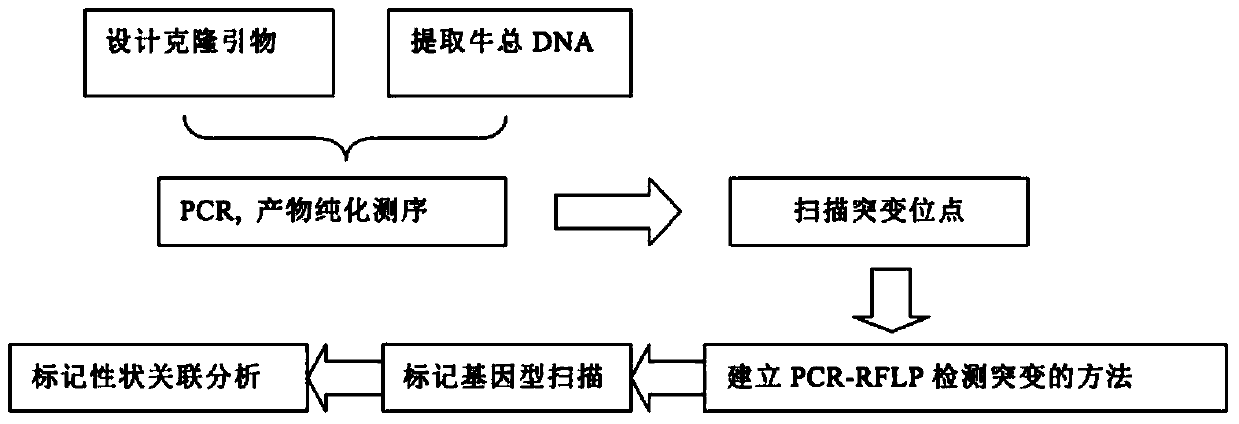
[0038] An application of a molecular marker MAP4K4 fragment in the correlation analysis of milk yield and protein content traits of dairy cows, the application steps are as follows:
[0039] 1) Primer design:
[0040] According to the partial sequence of the 18th exon of the MAP4K4 gene in the NCBI website (GenBank sequence number AC_000168.1), the applicant designed amplification primers containing the partial sequence, and the primer synthesis was completed by Shanghai Bioengineering Technology Service Co., Ltd. The DNA sequence is as follows:
[0041] P1 forward primer: 5'GGCTCCACTTCACAATACC 3',
[0042] P2 reverse primer: 5'TCTGACTCTGTGCAACCC 3'.
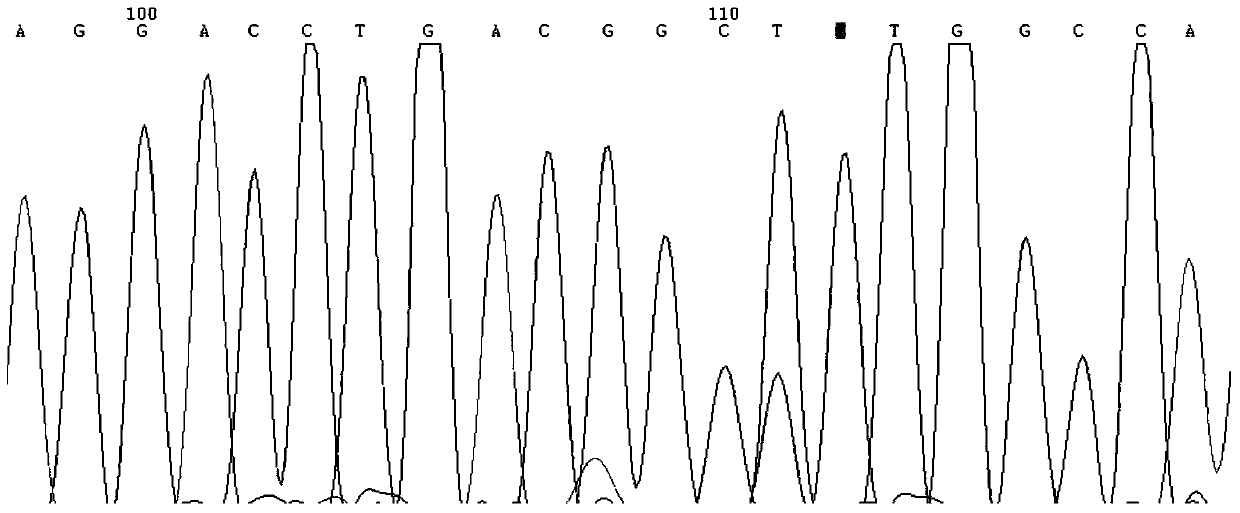
[0043] 2) Purification and sequencing of PCR products:
[0044] PCR amplification reaction system 20ul, including 500ng DNA, 2.0ul 10×PCR buffer, 0.6ul 10mMdNTP, 0.8ul of each primer (10uM) and 1U Ampli Taq DNA polymerase (Shanghai Sangon Bioengineering Technology Servic...
Embodiment 2
[0051] Implementation example 2: association analysis of traits such as dairy cow milk production and protein content related to MAP4K4 gene polymorphism site T156-G156
[0052] After detecting the genotypes of the molecular marker T156-G156 in 413 Holstein dairy cows by PCR-RFLP, statistical methods were used to analyze the correlation between the loci and the milk production and protein content of the cows. Statistical analysis uses R language, using the least multiplication to fit the linear model, the formula is as follows:
[0053] Y ijk =u+F i +P j +SNP k +e ijk
[0054] where Y ijk is the phenotype value, u is the population mean, F i is the site effect results show that P j is a sex effect, the SNP k is the SNP effect, e ijk is a random error.
[0055] Correlation analysis showed that the protein content of individuals with TT genotype was significantly higher (P=0.015) than that of GG genotype, and the milk production of individuals with GG genotype was sig...
PUM
 Abstract
Description
Claims
Application Information
 - R&D
- Intellectual Property
- Life Sciences
- Materials
- Tech Scout
- Unparalleled Data Quality
- Higher Quality Content
- 60% Fewer Hallucinations
Browse by: Latest US Patents, China's latest patents, Technical Efficacy Thesaurus, Application Domain, Technology Topic, Popular Technical Reports.
© 2025 PatSnap. All rights reserved.Legal|Privacy policy|Modern Slavery Act Transparency Statement|Sitemap|About US| Contact US: help@patsnap.com


