
Large-scale taxi OD data visual analysis method

An analysis method and taxi technology, applied in relational databases, database models, structured data retrieval, etc., can solve the problems of inability to compare and analyze, increase the difficulty of user analysis, etc., and achieve the effect of easy acquisition

Active Publication Date: 2015-11-25
ZHEJIANG UNIV OF TECH +1
View PDF3 Cites 32 Cited by
  • Summary
  • Abstract
  • Description
  • Claims
  • Application Information

AI Technical Summary

Problems solved by technology

[0007] Take taxi OD data as an example to illustrate the shortcomings of the visual analysis method: although it can be analyzed through a separate graph, it generally cannot be compared and analyzed on one graph, which will increase the difficulty of user analysis

Method used


Image

  • Large-scale taxi OD data visual analysis method
  • Large-scale taxi OD data visual analysis method
  • Large-scale taxi OD data visual analysis method

Examples


Embodiment Construction

[0036] The design of the present invention uses d3.js to draw the front-end visualization components, and the data processing is mainly written in java.

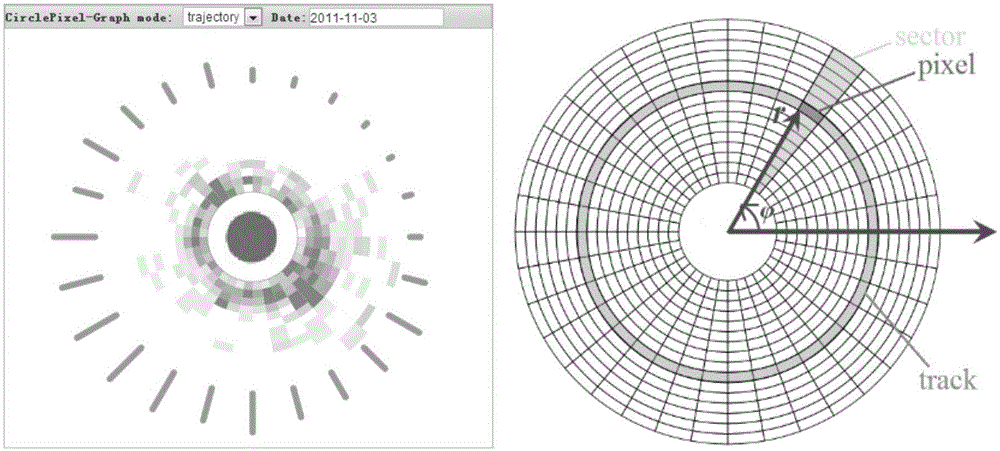
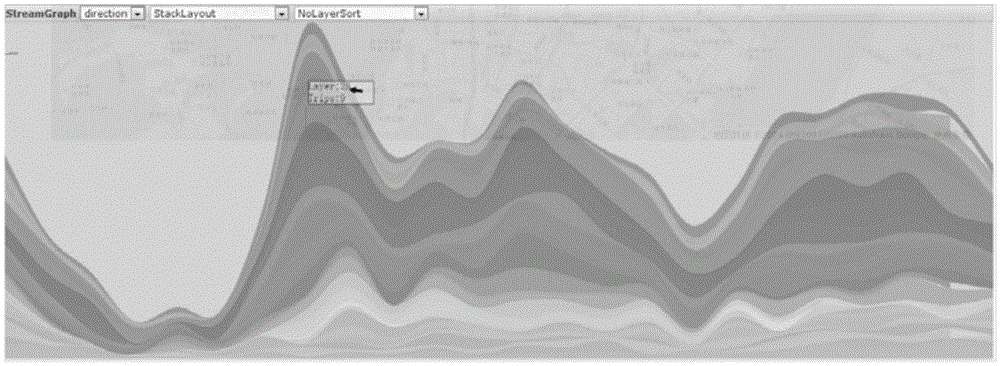
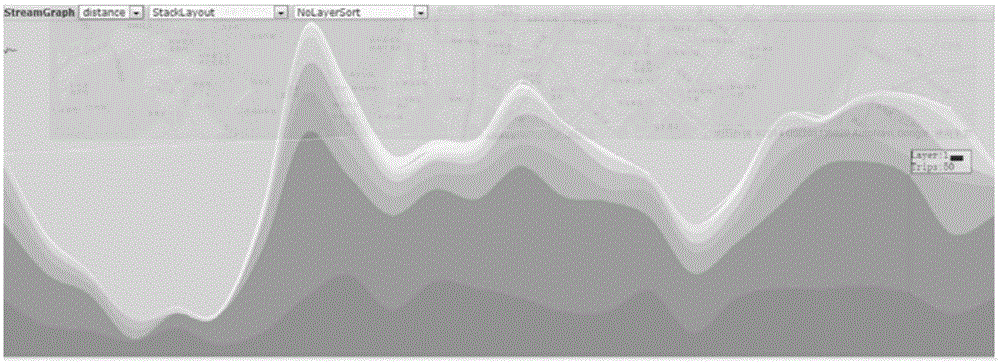
[0037] refer to figure 1 , 2, 3, 4, 5, 6

[0038] The large-scale taxi OD data visual analysis method designed by the present invention comprises the following steps:

[0039] 1) Eliminate the noise in the original GPS data, and ensure that the latitude and longitude coordinates of GPS points are consistent with the geographic coordinate system of the online map;

[0040] 2) Match the GPS points of the taxi track to the corresponding roads through the ST-matching algorithm to calibrate the GPS points;

[0041] 3) Use the on-board signs to extract the information of taxi pick-up and drop-off (that is, the starting point / end point of the taxi passenger trajectory), and use the grid index technology to store the trajectory data in a grid;

[0042] 4) Using bin clustering, after the clustering is completed, heat maps and clu...


PUM


Abstract

A large-scale taxi OD data visual analysis method comprises the following steps that noise in GPS original data is eliminated, and it is guaranteed that the longitude and latitude coordinates of a GPS point are consistent with a geographic coordinate system of an online map; the GPS point of a taxi track are matched to a corresponding road through an ST-matching algorithm to be calibrated; taxi taking passenger get-on and get-off information is extracted through a vehicle-mounted mark, and grid storage is carried out on track data based on a grid index technology; bin clustering is adopted, and after clustering is completed, a heat map and a clustering map are generated; an interested area or a distinctive area is selected through the heat map and the clustering map; after the interested area is selected, an O / D-mode spatio-temporal analysis view is shown through annular pixel maps and space-time stacking maps of visual assemblies; the space-time stacking maps are opened through distance projection or direction projection, and a pair of starting and ending areas is selected by highlighting one or more adjacent pixels of the annular pixel maps or layers in the space-time stacking maps.

Description

technical field [0001] The present invention designs a large-scale taxi OD (Origin-Destination) data visual analysis method. Background technique [0002] With the development of urbanization and the increase of urban population, modern metropolises are facing serious urban diseases, such as traffic congestion and unsatisfactory urban planning, etc. Traffic congestion causes many negative effects, such as wasted time, rising costs, air pollution and so on. Over the years, government agencies have tried to address these problems, but, sometimes, with only modest success. In recent years, with the rapid advancement and widespread penetration of different sensing technologies, a large amount of data has been successfully collected to record the status of various aspects of the city. This brings new opportunities to solve urban problems and create smart cities based on urban big data analysis. Taking urban planning and traffic management as examples, road traffic conditions r...

Claims


Application Information

Patent Timeline
IPC IPC(8): G06F17/30
CPCG06F16/285G06F16/29
Inventor 梁荣华胡亚娟姜晓睿郑春益贡伟
Owner ZHEJIANG UNIV OF TECH
Learn More