Multifunctional climate data model and application thereof
A data model, multi-functional technology, applied in special data processing applications, electrical digital data processing, instruments, etc., can solve the problems of few climate variables, inability to dynamically downscale, occupying large storage space, etc.
- Summary
- Abstract
- Description
- Claims
- Application Information
AI Technical Summary
Problems solved by technology
Method used
Image
Examples
Embodiment 1
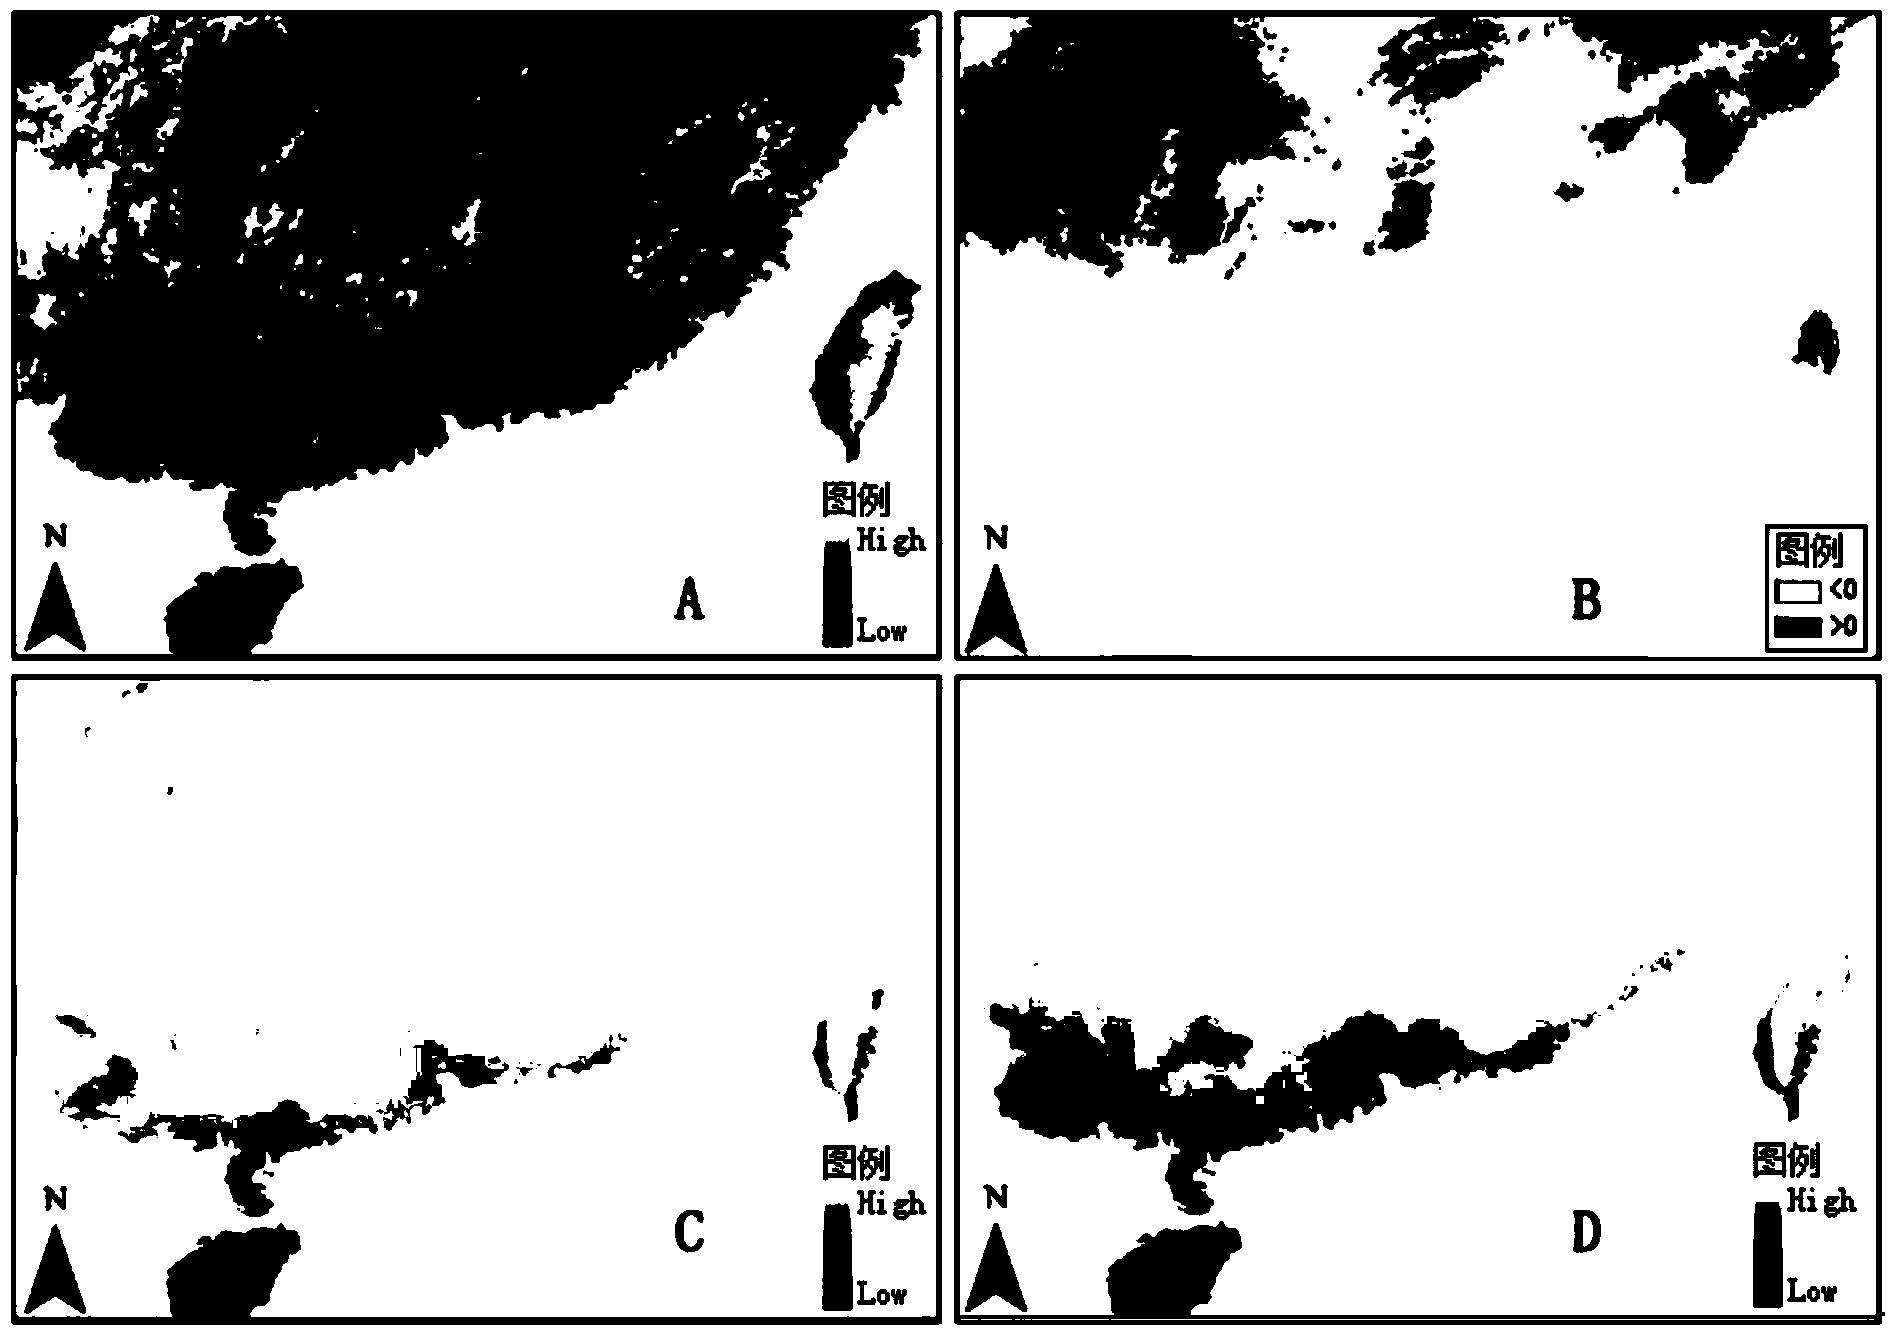
[0064] Obtain the downloadable public meteorological station observation data in the man-earth system subject database (http: / / www.data.ac.cn / index.asp), including the annual average monthly temperature, the annual average monthly minimum temperature, The average monthly maximum temperature and annual precipitation over the years; form the observation value of the weather station. Substitute the latitude and longitude values of each weather station into the bilinear distance weighted interpolation algorithm (such as figure 1 ), on the cumulative baseline climate grid surface and baseline digital elevation grid surface from 1961 to 1990 (the baseline air temperature grid surface includes monthly average temperature, monthly average minimum temperature, and monthly average maximum temperature, with a spatial resolution of 0.5°, from CRU TS3.21 at http: / / www.cru.uea.ac.uk / cru / data / hrg / , the baseline precipitation grid surface spatial resolution is 1km, from the Human-Earth Syst...
Embodiment 2
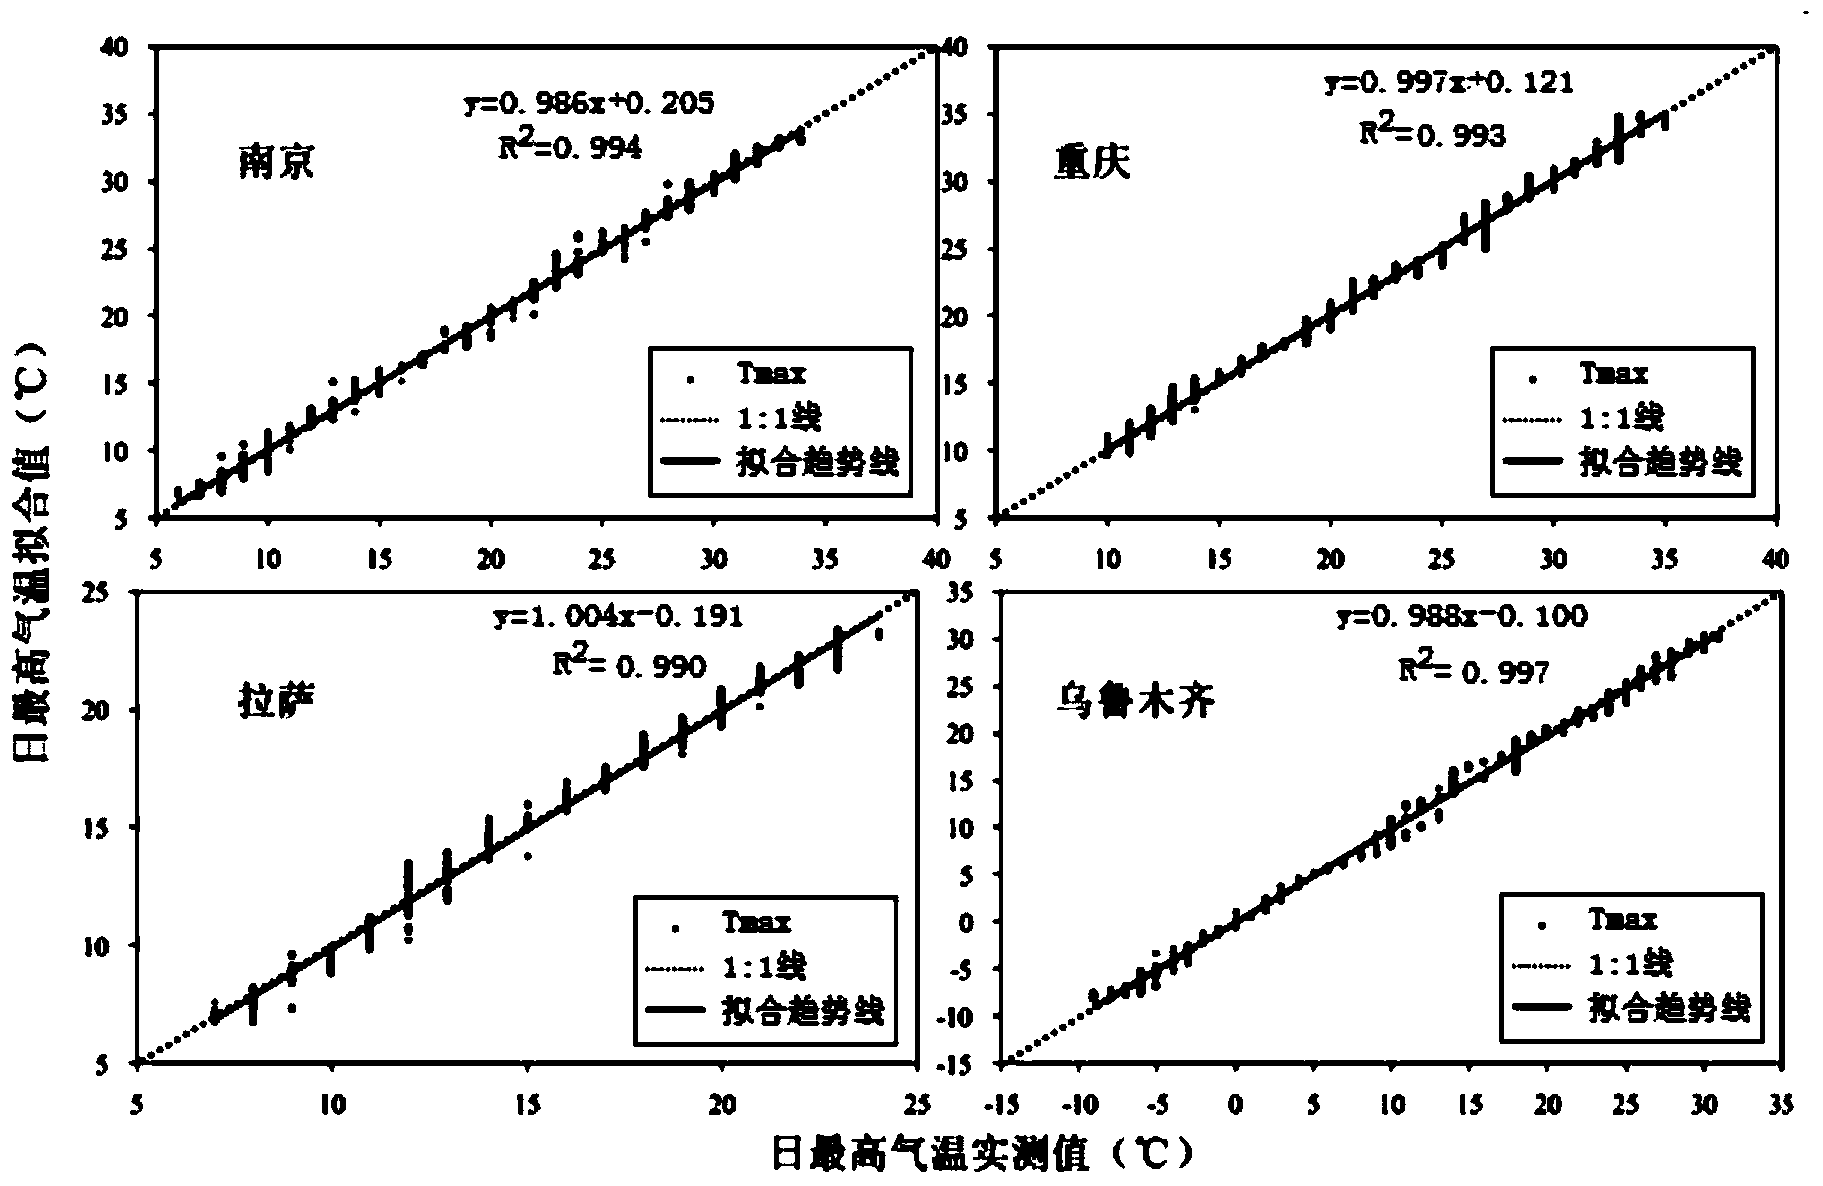
[0078] By collecting the annual average daily temperature observation data of 32 cities across the country, the monthly average temperature, monthly average maximum temperature and monthly average minimum temperature are obtained through monthly statistics, and the monthly average values of these three temperature variables are respectively substituted into the following formula to calculate daily Fitting value of air temperature data,
[0079]
[0080] In the formula, t is the time; T is the month semicolon (1 to 12); D is the number of days in each month; m is the day of the month; Y T Monthly averages of relevant climate variables;
[0081] a j = [ ( πj 12 ) / sin ( πj 12 ) ] Σ T [ ...
Embodiment 3
[0091] A set of daily maximum temperature, daily minimum temperature and photosynthetically active radiation data from southeastern Australia in 2006 was used, and the latitude of the sample plot was -42.9°. Firstly, the monthly average minimum temperature and monthly average maximum temperature are obtained by monthly statistics; the monthly average values of these two temperature variables are respectively substituted into the following formula to calculate the daily daily minimum temperature and daily maximum temperature;
[0092]
[0093] In the formula, t is the time; T is the month semicolon; D is the number of days in each month; m is the day of the month; Y T Monthly averages of relevant climate variables;
[0094] a j = [ ( πj 12 ) / sin ( πj 12 ...
PUM
 Abstract
Description
Claims
Application Information
 - R&D
- Intellectual Property
- Life Sciences
- Materials
- Tech Scout
- Unparalleled Data Quality
- Higher Quality Content
- 60% Fewer Hallucinations
Browse by: Latest US Patents, China's latest patents, Technical Efficacy Thesaurus, Application Domain, Technology Topic, Popular Technical Reports.
© 2025 PatSnap. All rights reserved.Legal|Privacy policy|Modern Slavery Act Transparency Statement|Sitemap|About US| Contact US: help@patsnap.com


