
Method for reconstructing interval transit time curve by virtue of multiple logging curves

A technology of sonic time difference curve and logging curve, which is applied in the directions of earthwork drilling, wellbore/well components, etc., can solve the problems of high coincidence, inability to accurately reflect the reservoir and surrounding rock, and inconsistent results.

Active Publication Date: 2014-06-11
BEIJING NORMAL UNIVERSITY
View PDF5 Cites 17 Cited by
  • Summary
  • Abstract
  • Description
  • Claims
  • Application Information

AI Technical Summary

Problems solved by technology

When the difference between the underground reservoir velocity and the mudstone velocity is small and the coincidence degree is high; the result of direct wave impedance inversion cannot accurately reflect the difference between the reservoir and surrounding rock, resulting in the inconsistency between the wave impedance inversion result and the drilling result

Method used


Image

  • Method for reconstructing interval transit time curve by virtue of multiple logging curves
  • Method for reconstructing interval transit time curve by virtue of multiple logging curves
  • Method for reconstructing interval transit time curve by virtue of multiple logging curves

Examples


Embodiment Construction

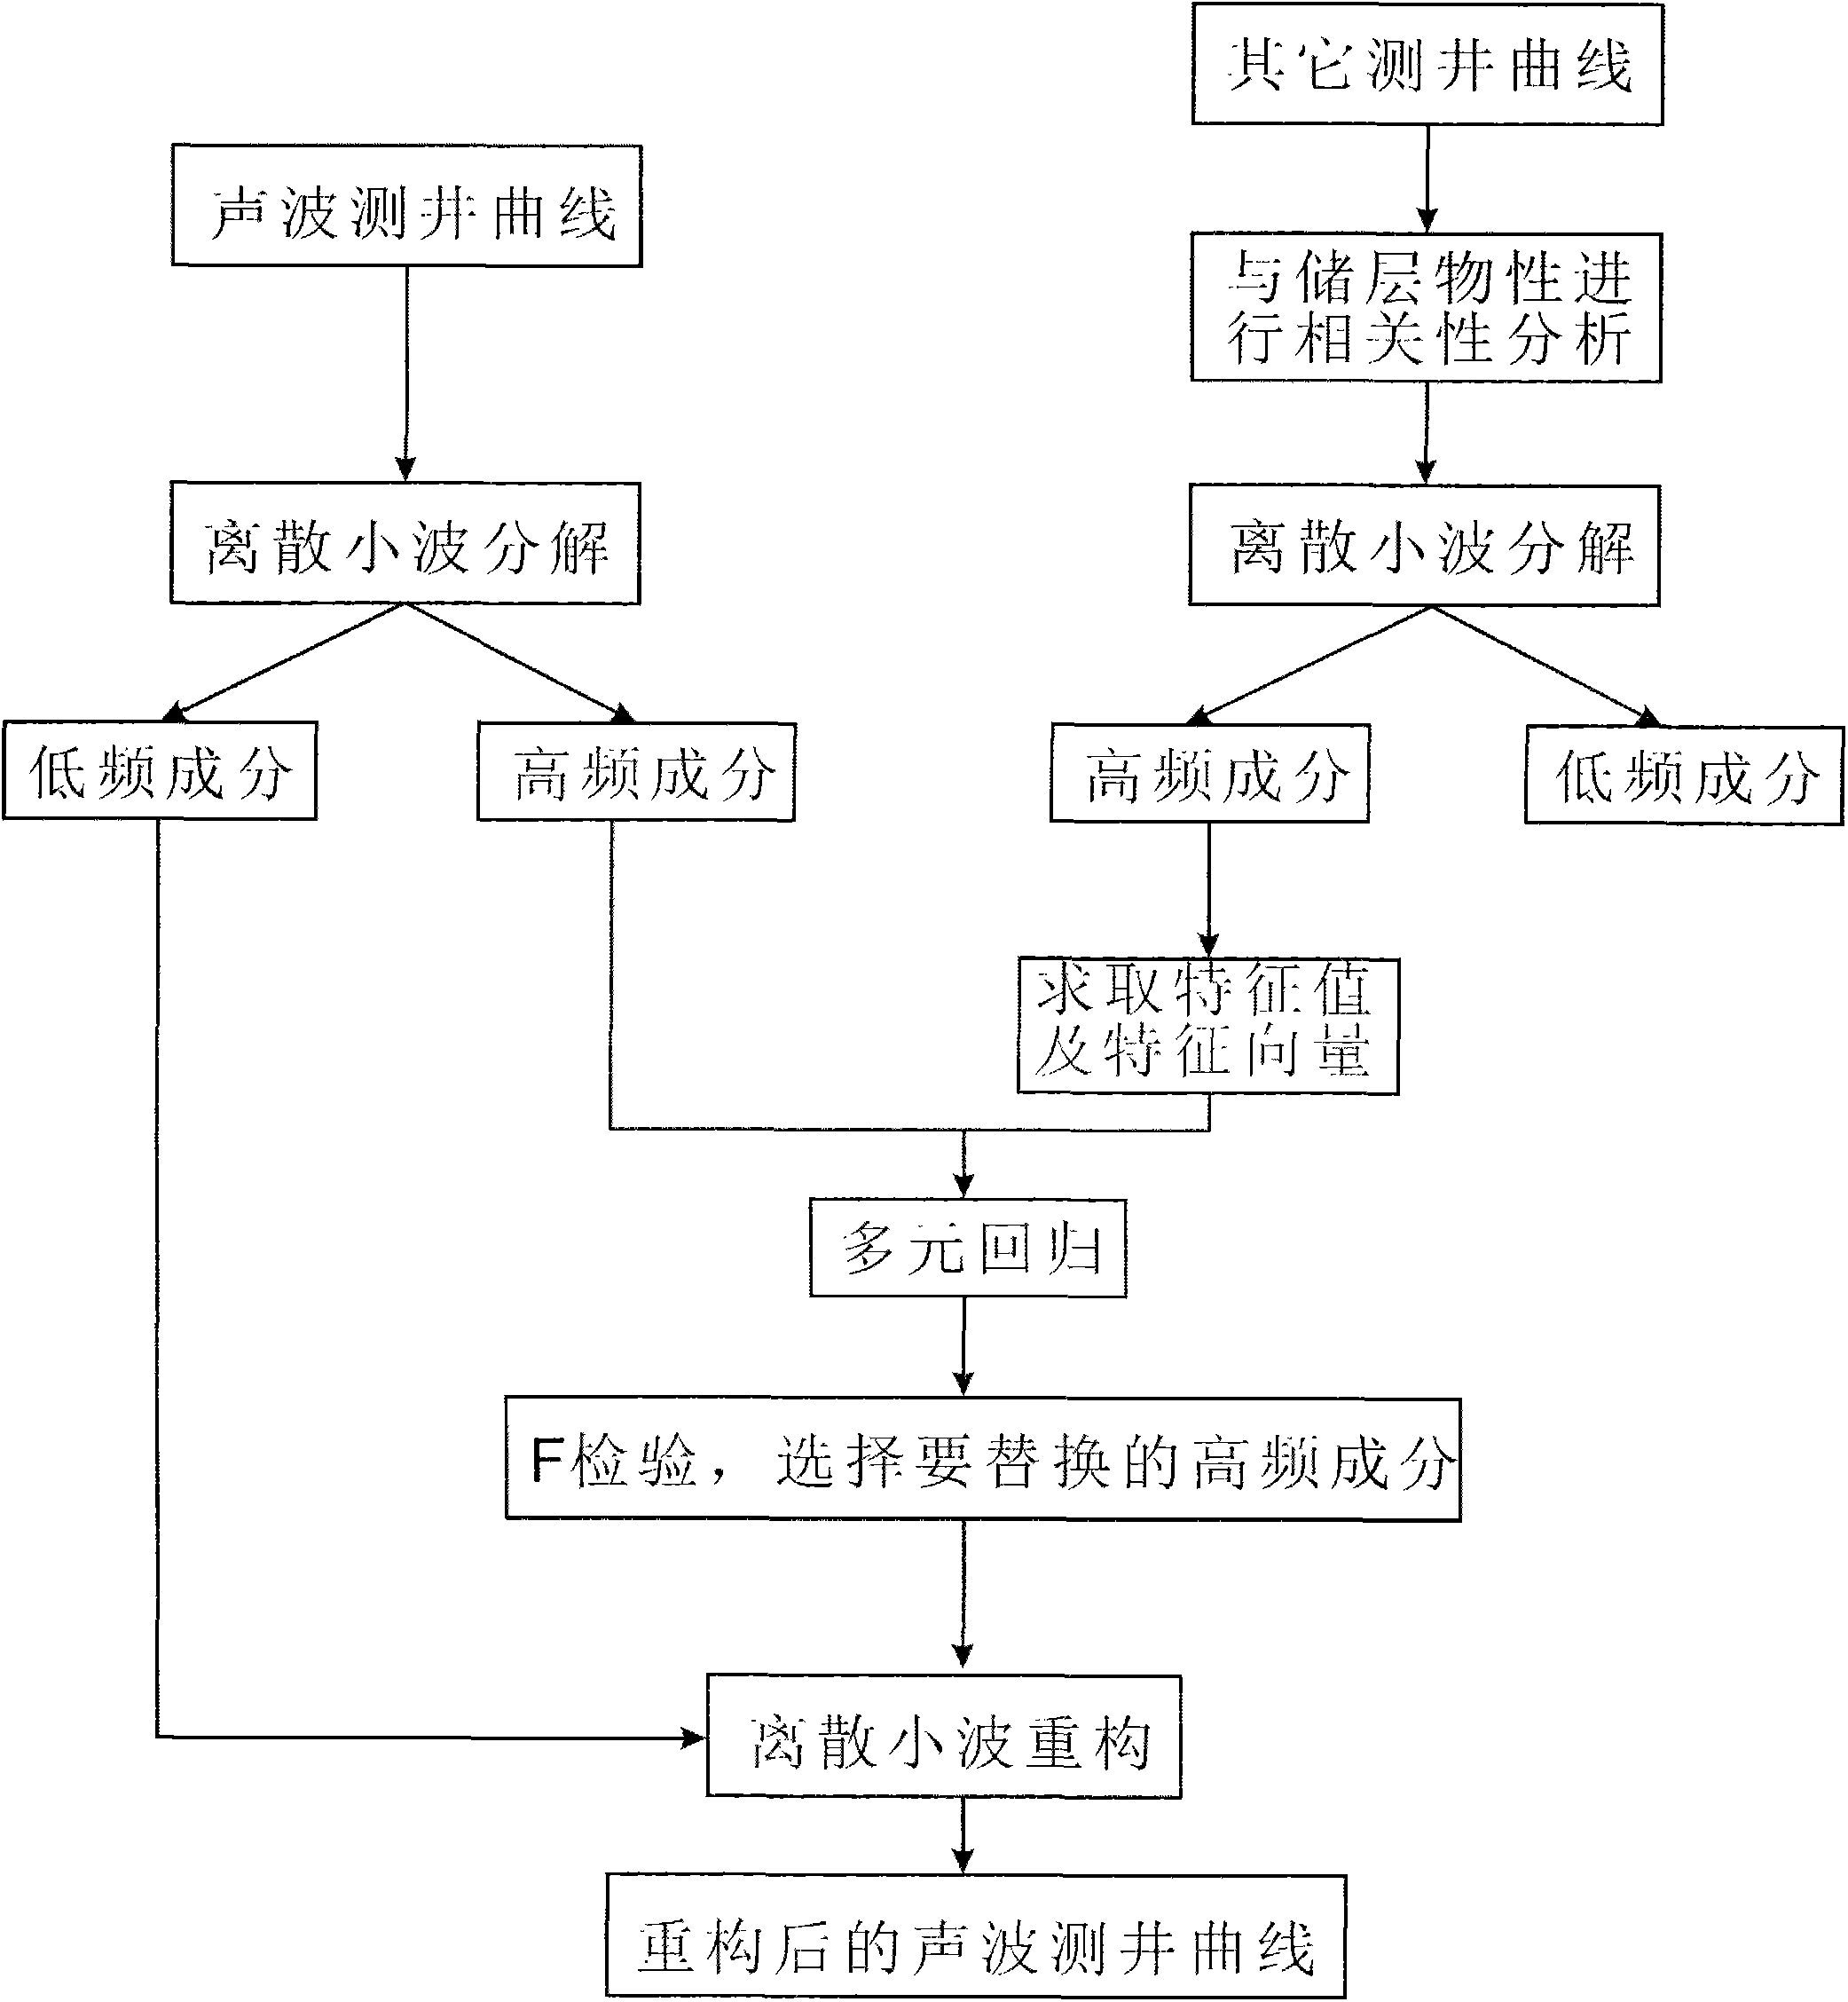
[0010] like figure 1 As shown, the implementation steps of the method are described in detail as follows:

[0011] Step 1, using the reservoir porosity, shale content data and logging curves for correlation analysis, and selecting the logging curves with higher correlation with shale content and porosity;

[0012] Step 2: Decompose the log curves with high correlation with shale content and porosity by db wavelet, and the number of decomposition layers is 8;

[0013] Step 3, the high-frequency decomposition results of each layer of logging curves other than acoustic waves are formed into a matrix, and the corresponding eigenvalues ​​and eigenvectors of the matrix are obtained, and the eigenvectors corresponding to different eigenvalues ​​are used as new components for signal reconstruction. When these components are orthogonal (uncorrelated);

[0014] Step 4: Use these eigenvectors to perform multiple regression analysis on the high-frequency components of the wavelet decomp...


PUM


Abstract

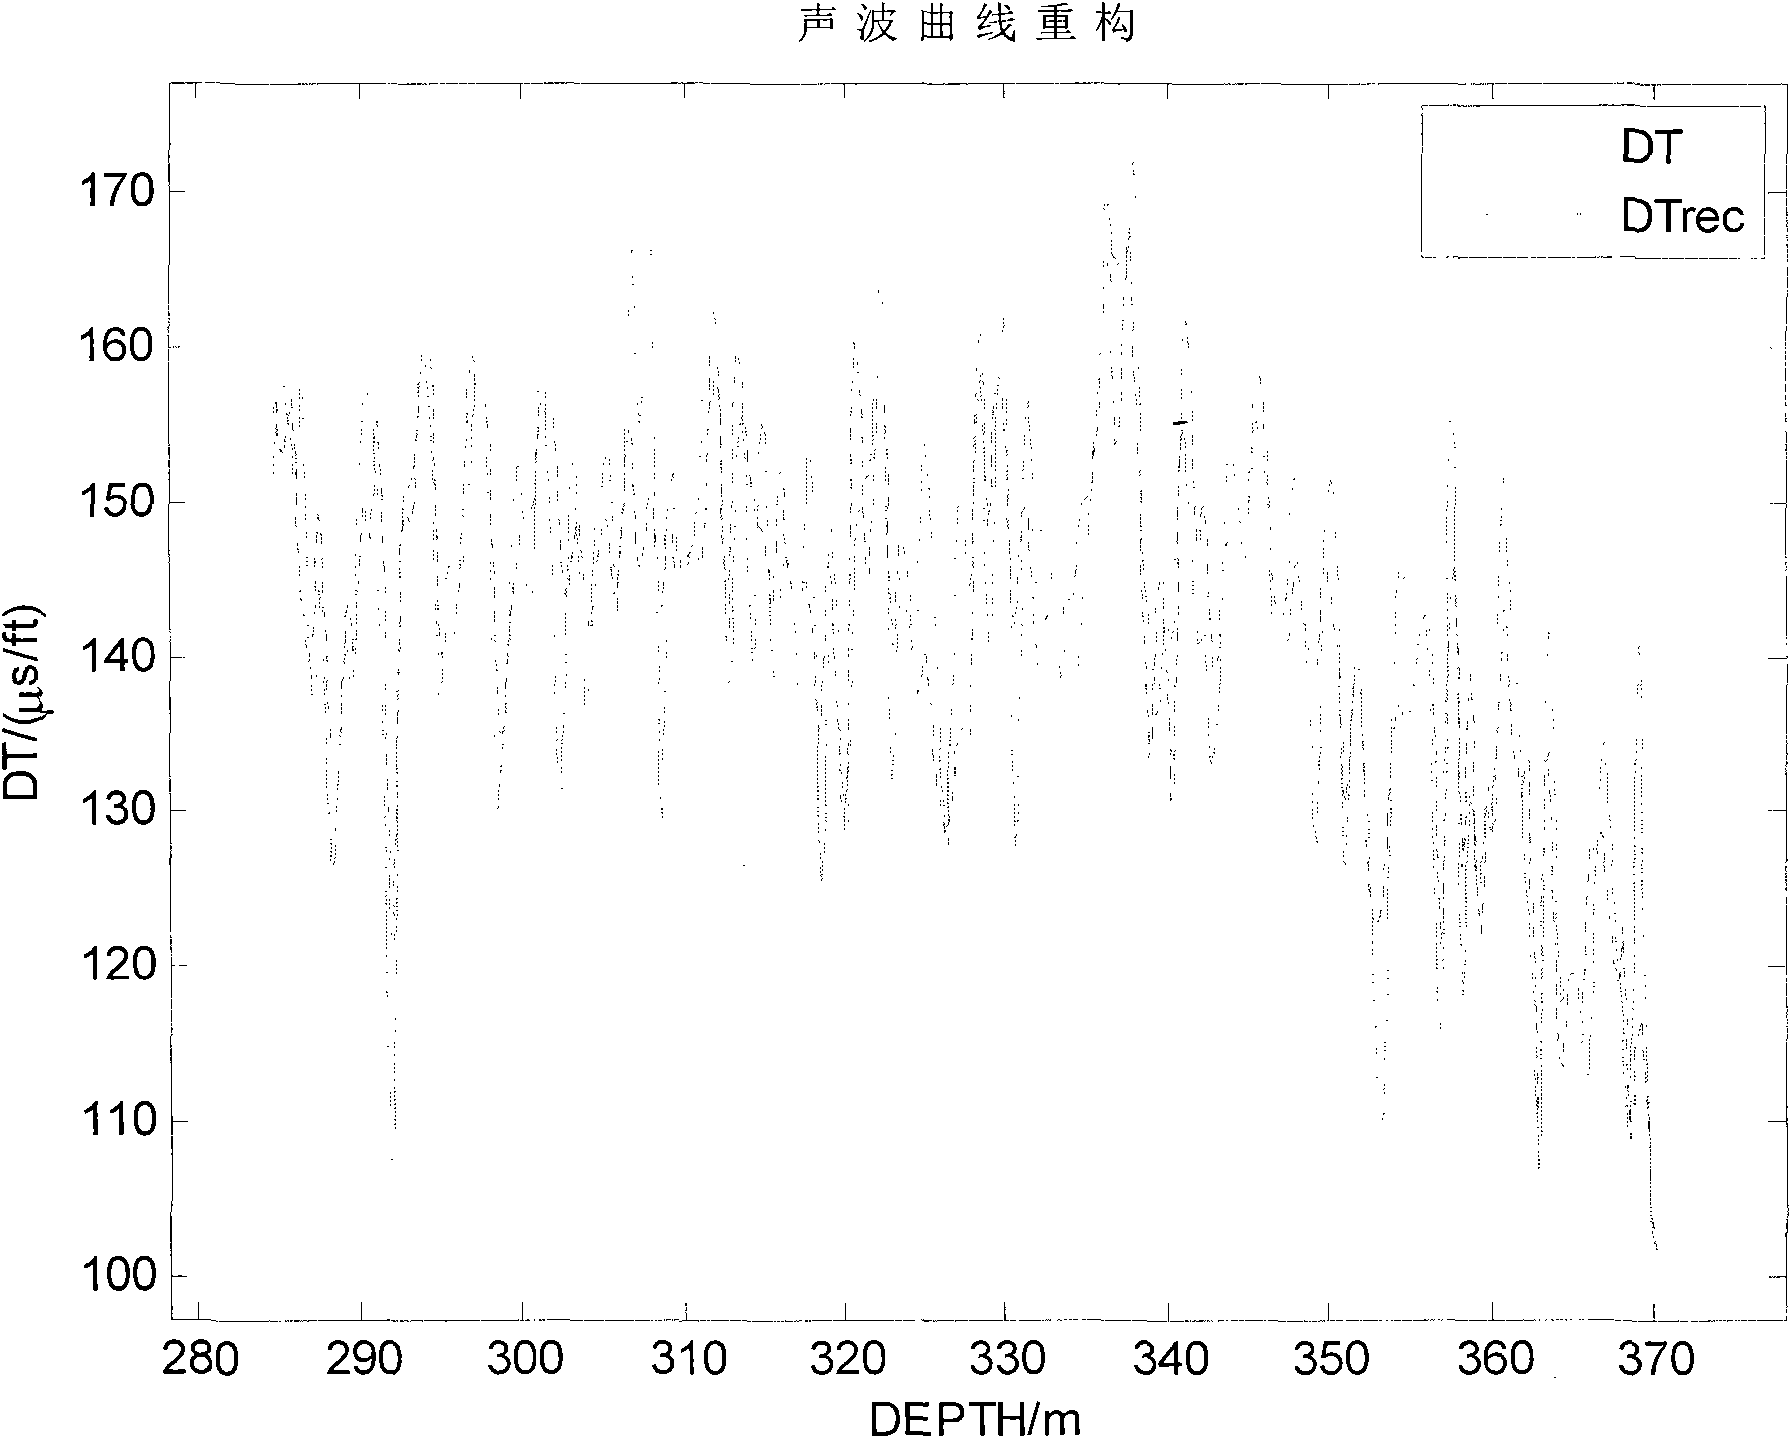
The invention relates to a method for reconstructing an interval transit time curve by virtue of multiple logging curves. The method mainly comprises the steps of selecting a plurality of logging curves obvious in response to reservoir characteristics by performing reservoir sensitivity and correlation analysis on the logging curves; performing discrete wavelet decomposition on the logging curves together with a sonic wave curve to form 8 decomposition layers; enabling all the layers of high-frequency decomposition results of other logging curves except the sonic curve to form matrices respectively, obtaining the corresponding characteristic values and characteristic vectors of the matrices; taking the characteristic vectors corresponding to different characteristic values as new components, which, at the moment, have orthogonality (correlation ); performing multivariate regression analysis on the high-frequency components of the corresponding layer of wavelet decomposition of the sonic curve by utilizing characteristic vectors of each layer, calculating a weighting coefficient corresponding to each vector, returning a regression significance analysis result and determining the quality of regression; next, determining the number of layers of the sonic high-frequency components to be reconstructed by virtue of the characteristic vectors according to the regression significance analysis result, selecting multiple regression results as the high-frequency components for a part having more layers than selected layers, and remaining the high-frequency decomposition results of the sonic logging curves for a part having less layers than the selected layer, and then carrying out curve reconstruction by using the low-frequency components of the sonic logging curves and the high-frequency components obtained through regression so as to obtain a final sonic reconstructed curve.

Description

Technical field: [0001] The invention relates to a method for reconstructing the acoustic wave time difference curve by using various logging curves. Background technique: [0002] Acoustic curve reconstruction is a common method in wave impedance inversion. When the difference between the underground reservoir velocity and the mudstone velocity is small and the coincidence degree is high; the result of direct wave impedance inversion cannot accurately reflect the difference between the reservoir and the surrounding rock, resulting in a discrepancy between the wave impedance inversion result and the drilling result. Therefore, it is necessary to reconstruct the acoustic logging curves, add lithology information to the acoustic logging curves, and improve the recognition degree of the acoustic logging curves for lithology, so as to perform more accurate reservoir prediction. [0003] Multiple regression analysis is a regression analysis method to study the relationship betwe...

Claims


Application Information

Patent Timeline
IPC IPC(8): E21B49/00
Inventor 张金亮张明李景哲刘朋阳张鹏辉
Owner BEIJING NORMAL UNIVERSITY
Learn More