Spectroscopy technique using merged spectral data

A spectrum and spectrum measurement technology, applied in the field of spectroscopic devices, can solve problems such as weak spectral peaks, difficult detection, low brightness, etc.

Active Publication Date: 2014-02-12
FEI CO
View PDF4 Cites 2 Cited by
  • Summary
  • Abstract
  • Description
  • Claims
  • Application Information

AI Technical Summary

Problems solved by technology

This drop in turn makes it even more difficult to detect (weaker) spectral peaks efficiently due to elements with lower brightness

Method used


Image

  • Spectroscopy technique using merged spectral data
  • Spectroscopy technique using merged spectral data
  • Spectroscopy technique using merged spectral data

Examples


Embodiment 1

[0068] figure 1 A charged particle microscope 400 is shown, which in this case is a SEM. The microscope 400 includes a particle optics column 402 that generates a charged particle beam 404 (in this case an electron beam). The particle optics column 402 is mounted on the vacuum chamber 406, which includes a sample holder / stage 408 for holding the sample 410. A vacuum pump (not shown) is used to evacuate the vacuum chamber 406. With the help of the voltage source 422, the sample holder 408 or at least the sample 410 can be biased (floated) to a potential relative to ground.

[0069] The particle optics column 402 includes an electron source 412, compound lens systems 414 and 416 for focusing the electron beam 404 on the sample 410, and a deflection unit 418. Regarding the detector, the device is equipped with:

[0070] -A first detector 420 for detecting the flux of laser sub-radiation emitted from the sample 410 in response to the irradiation by the beam 404. In this example, th...

Embodiment 2

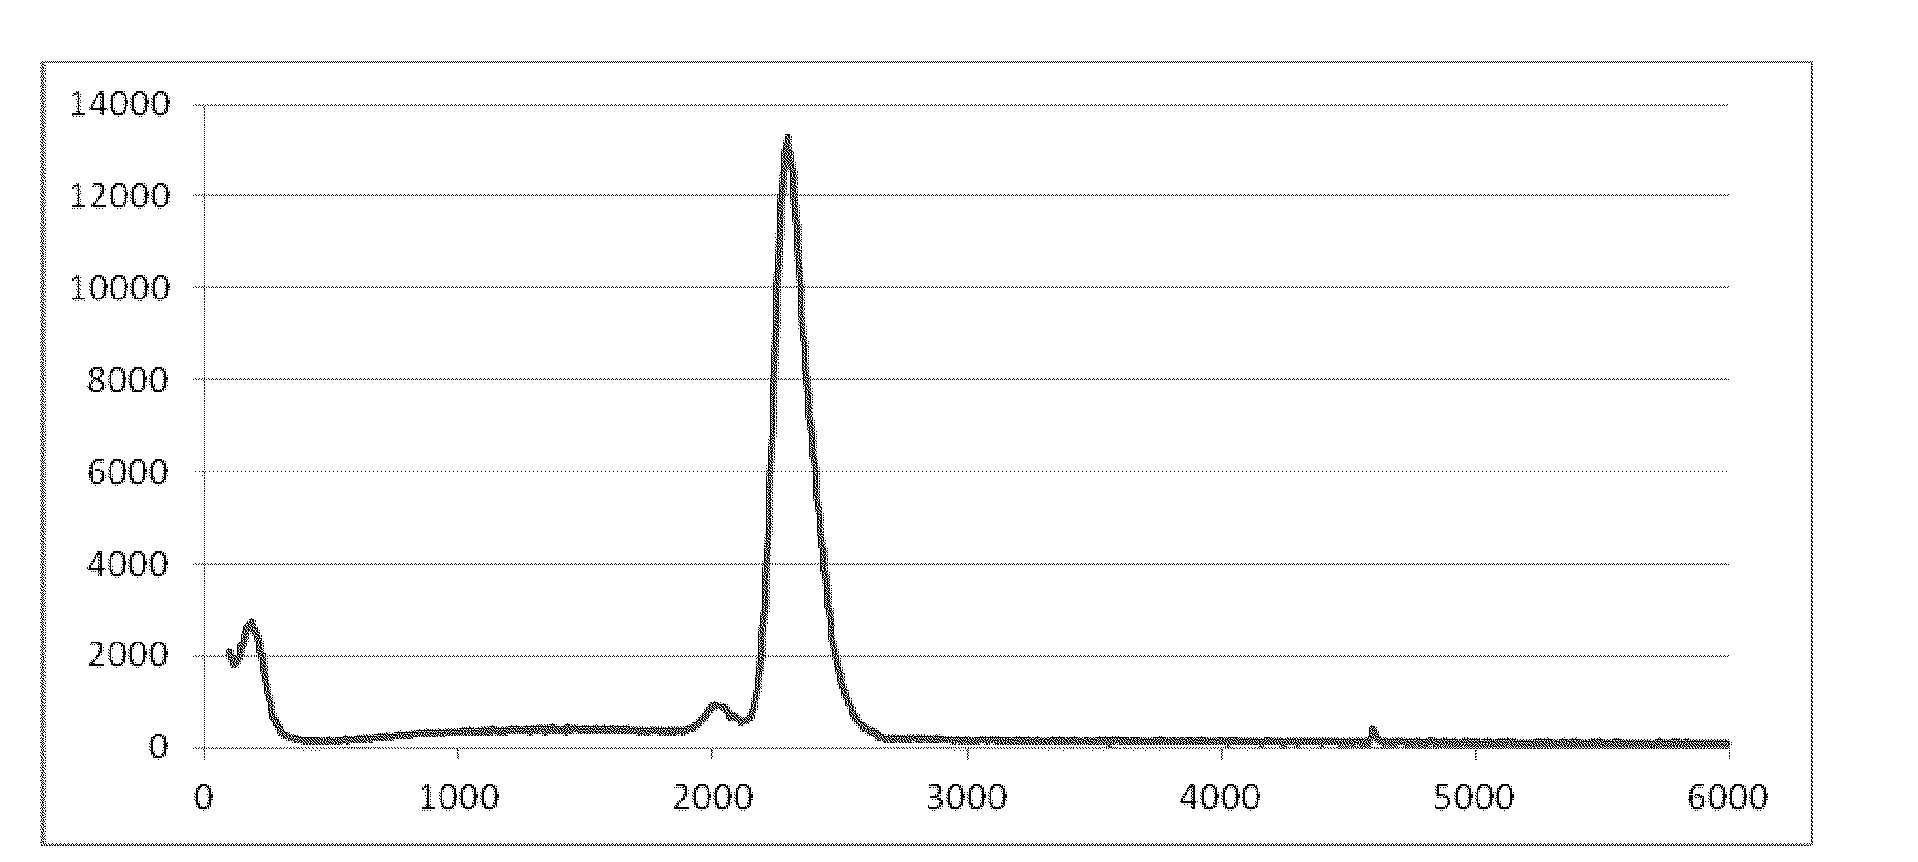
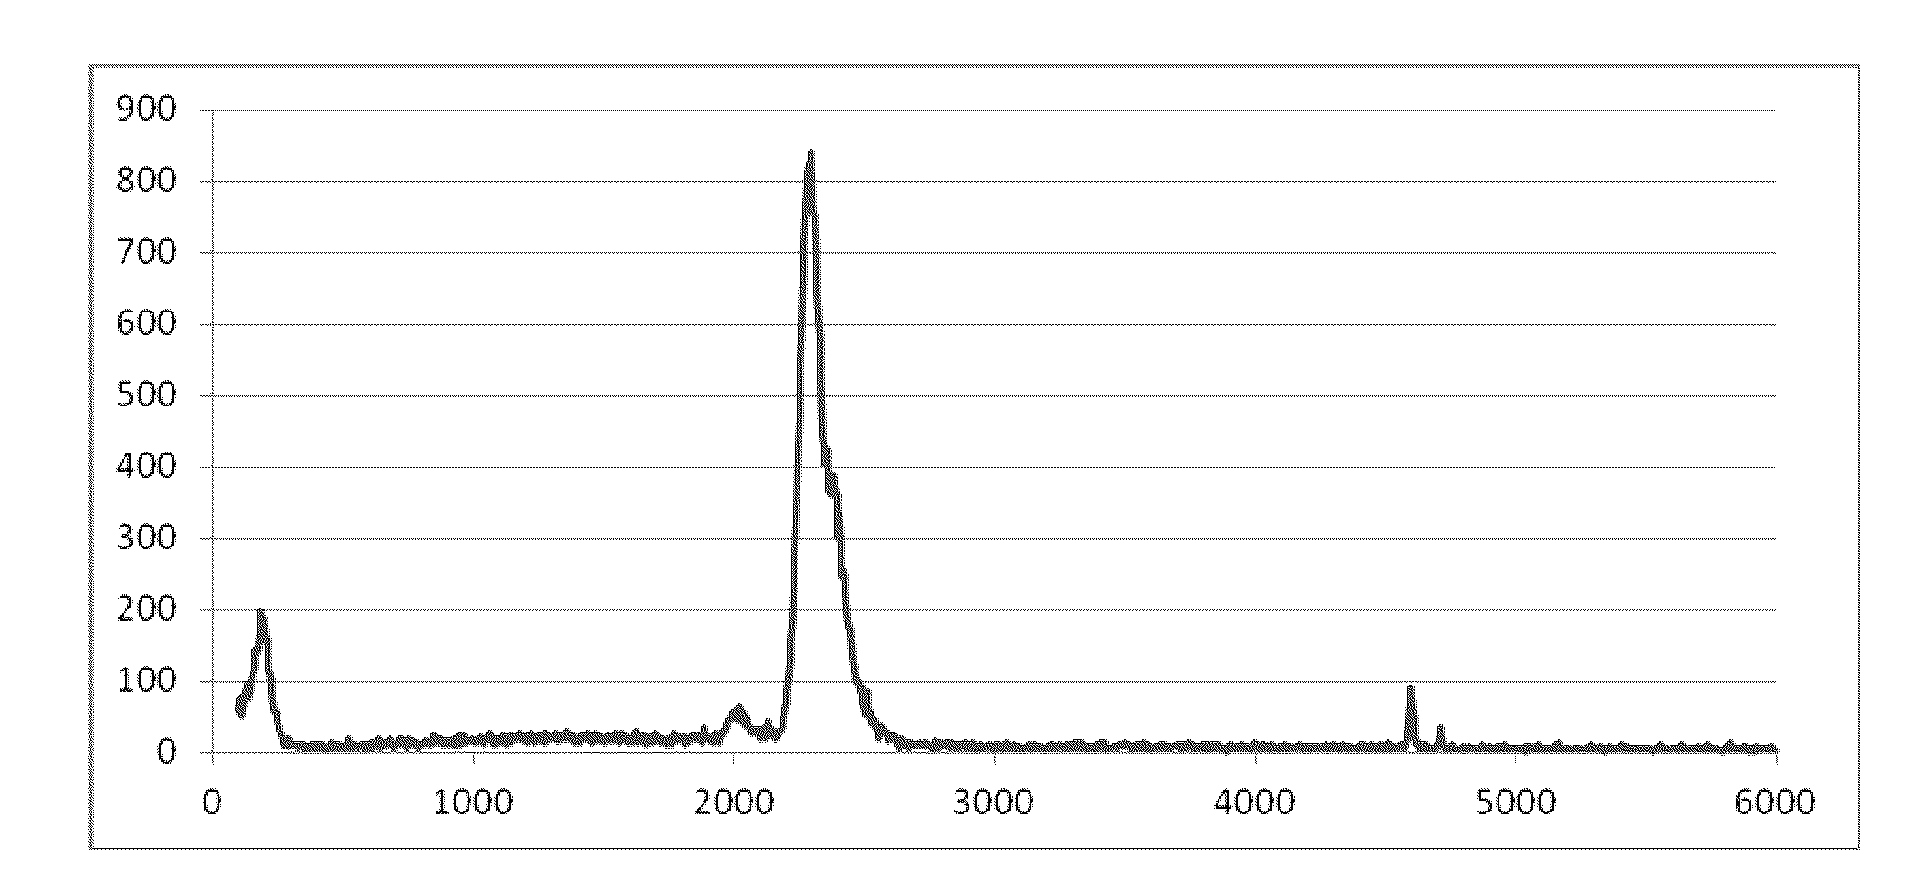
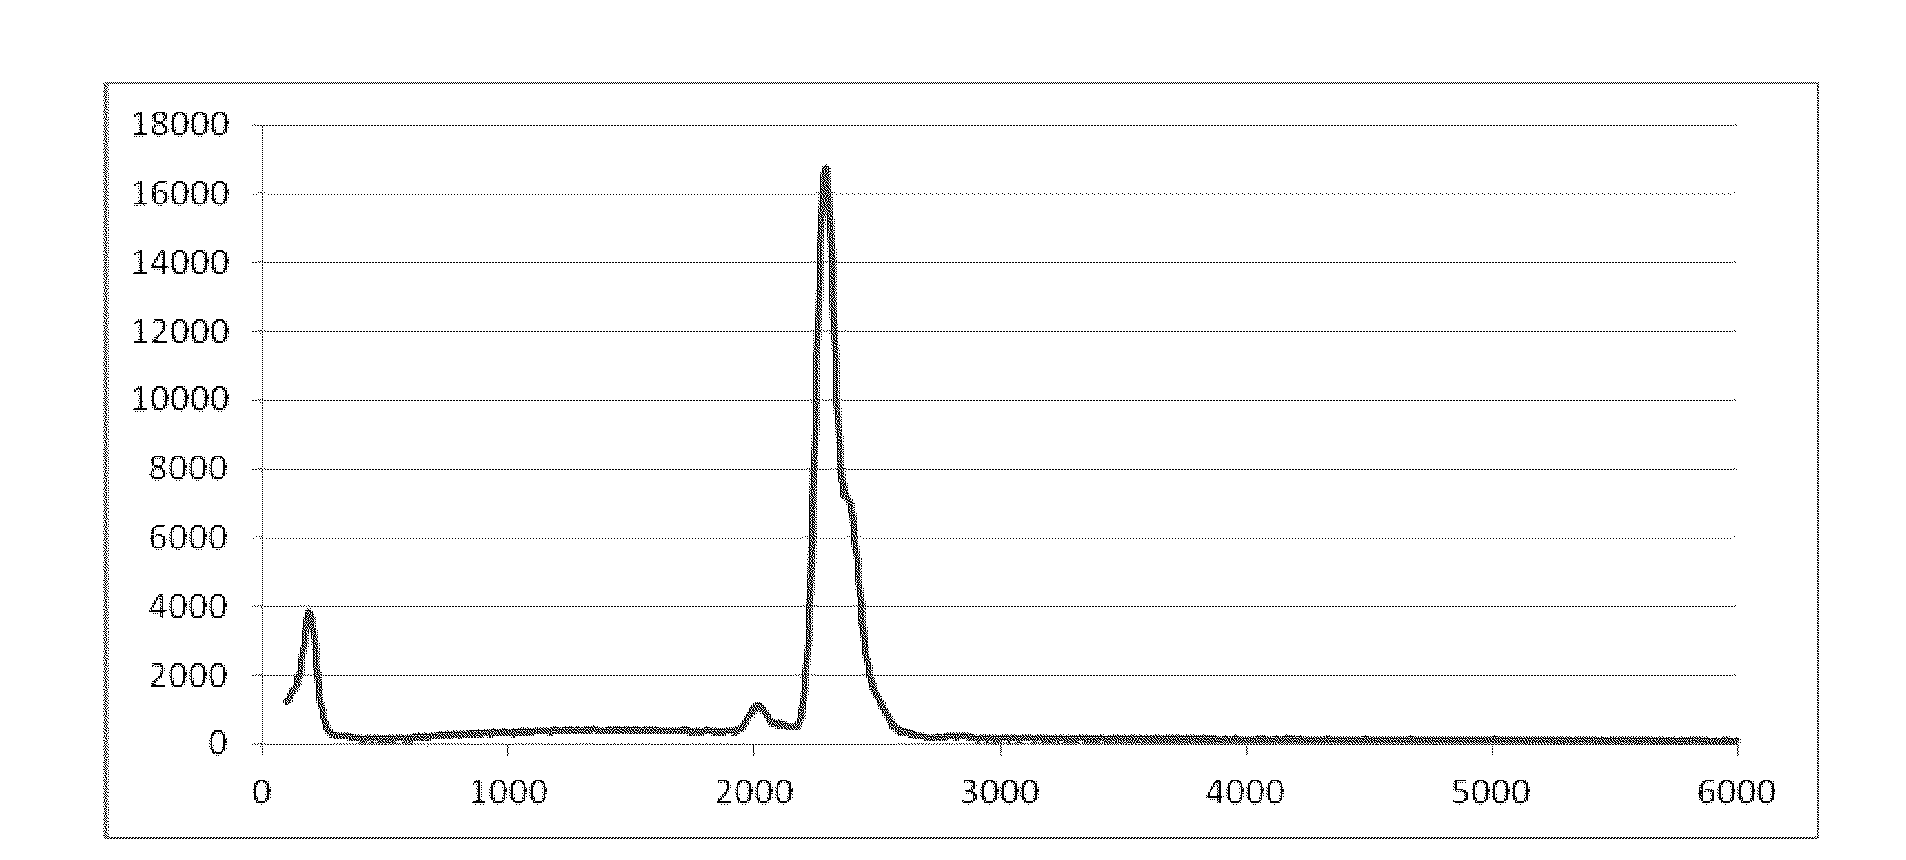
[0082] figure 2 The EDX / EDS spectra accumulated from metallurgical samples are shown. The spectrum is the measured intensity along the ordinate (proportional to the photon count of each channel) versus the photon energy in keV along the abscissa (determined by the channel into which the photon is classified by the processing circuit associated with the detector) Graph. The spectrum shows multiple different peaks superimposed on the lower background.

[0083] The location and relative height of a particular set of these peaks are characteristics of the element that generated them. For example, in the depicted spectrum, vanadium (V) generates triad (distinguishable) peaks at energies of approximately 0.5, 4.9, and 5.4 keV. On the other hand, chromium (Cr) is responsible for the peaks at approximately 0.5, 5.4, and 5.95 keV (two of which clearly correspond to the corresponding peaks of vanadium in the energy resolution adopted along the horizontal axis).

[0084] Now move on to Fi...


PUM


Abstract

A method of examining a sample using a spectroscopic apparatus, such as energy-dispersive X-ray spectroscopy (EDX), comprising the following steps: - Mounting the sample on a sample holder; - Directing a focused input beam of radiation, such as an electron beam or X-ray beam, onto a location on the sample, thereby producing an interaction that causes a flux of stimulated photonic radiation, such as fluorescent X-rays, to emanate from said location; - Examining said flux using a multi-channel photon-counting detector, thus accruing a measured spectrum for said location; - Automatically repeating said directing and examining steps for a series of successive locations on the sample, which method comprises the following steps: - Choosing a beam parameter of the input beam, such as the beam curent or beam spot size, that will influence a magnitude of said flux of stimulated photonic radiation; - For each location within a first set of locations on the sample, accruing a spectrum using a first value of said beam parameter; - For each location within a second set of locations on the sample, accruing a spectrum using a second value of said beam parameter, different from said first value. One application consists in detecting and flagging events during EDX analysis when pile-up is too high and re-acquire EDX data for the locations corresponding to these flagged events.

Description

Technical field [0001] The present invention relates to a method for inspecting a sample using a spectroscopic device, including the following steps: [0002] -Install the sample on the sample rack; [0003] -Directing the focused input beam of radiation to a position on the sample, thereby generating an interaction that causes the flux of laser sub-radiation to radiate from said position; [0004] -Use a multi-channel photon counting detector to check the flux to accumulate measurement spectra for the location; [0005] -Automatically repeat the guiding and checking steps for a series of consecutive positions on the sample. [0006] The invention also relates to a spectroscopic device suitable for performing such a method, in particular a spectroscopic device as included in a charged particle microscope. Background technique [0007] For the purpose of clarity and consistency, the following terms as used throughout this document and the appended claims should be interpreted as follows:...

Claims


Application Information

Patent Timeline
Patent Type & Authority Applications(China)
IPC IPC(8): G01N23/22
CPCG01N23/223G01N23/225G01N2223/076
Inventor S.R.M.斯托克斯
Owner FEI CO
Why Eureka
Try Eureka