
Three-dimensional dose distribution difference analyzing method and system based on TPS

A three-dimensional dose and distribution difference technology, applied in the field of radiotherapy research, can solve the problems of inaccurate differences in calculation results, no statistical analysis of dose distribution differences, and researchers unable to clearly understand the specific situation of the difference and its spatial location, etc. Achieve high comparability and accurate calculation results

Inactive Publication Date: 2014-01-29
CANCER CENT OF GUANGZHOU MEDICAL UNIV
View PDF3 Cites 5 Cited by
  • Summary
  • Abstract
  • Description
  • Claims
  • Application Information

AI Technical Summary

Problems solved by technology

[0009] The uniform phantom used in the above method usually only contains one or several (2-3) relatively uniform density materials, which are compatible with various muscle tissues, lung tissues, bone tissues, cartilage tissues, cavities, etc. in the human body. There are significant differences in density, shape, and spatial distribution, and the impact on radiation is also different. Therefore, the radiotherapy plan is transplanted to a uniform phantom for analogy, ignoring the impact of different tissue densities and their interfaces on radiation; this method Different dose calculation models are used in the simulation and actual measurement, and the difference in the calculation results is not accurate enough, and there is no statistical analysis of the difference in dose distribution, so that researchers cannot clearly understand the specific situation of the difference and its spatial location

Method used


Image

  • Three-dimensional dose distribution difference analyzing method and system based on TPS
  • Three-dimensional dose distribution difference analyzing method and system based on TPS
  • Three-dimensional dose distribution difference analyzing method and system based on TPS

Examples


Embodiment Construction

[0047] refer to figure 1 , figure 1 It is a flow chart of the steps of the TPS-based three-dimensional dose distribution difference analysis method of the present invention, combined with figure 1 , a TPS-based three-dimensional dose distribution difference analysis method, comprising the following steps:

[0048] A. Carry out tomographic scanning on the human body to obtain the CT image of the human body, and then obtain the three-dimensional density distribution information of the human body;

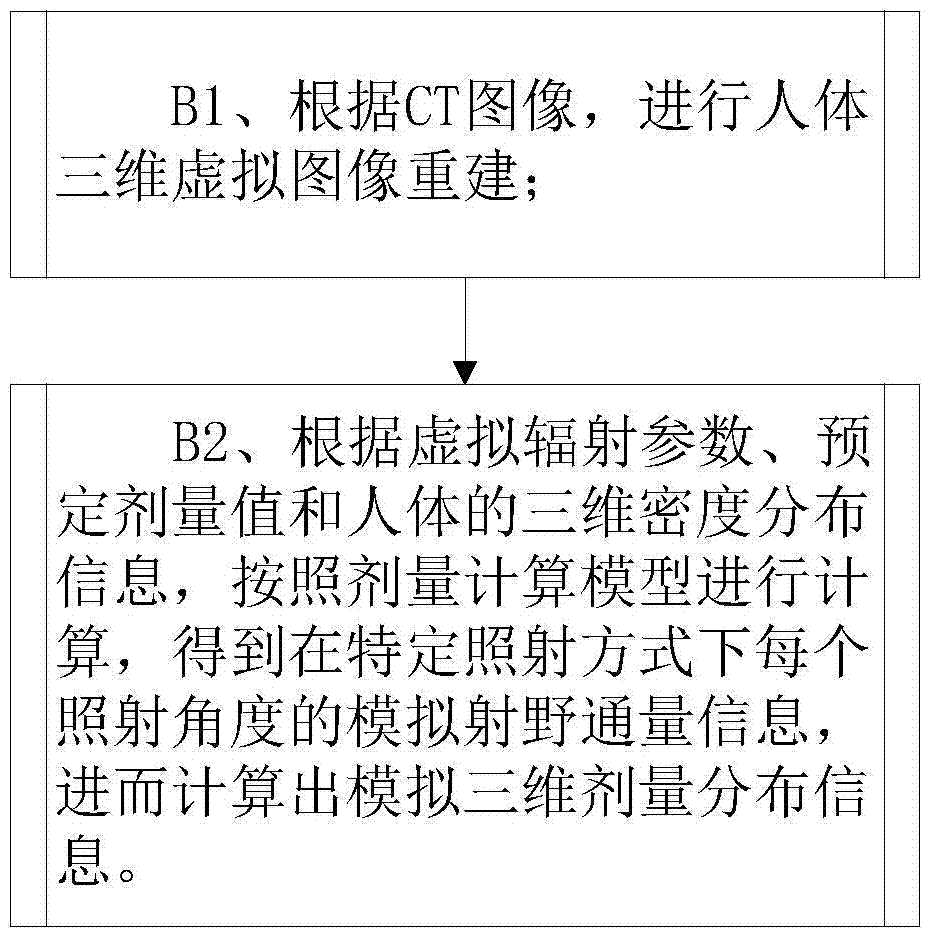
[0049] B. Calculate and obtain simulated three-dimensional dose distribution information according to virtual radiation parameters and predetermined dose values, combined with CT images;

[0050] C. Control the medical accelerator to conduct irradiation test to obtain the measured field flux information, and calculate the measured three-dimensional dose distribution information according to the CT image;

[0051]D. Comparing the simulated three-dimensional dose distribution informa...


PUM


Abstract

The invention discloses a three-dimensional dose distribution difference analyzing method and system based on a TPS. The method includes performing computerized tomography on a human body, obtaining a computerized tomography image of the human body, and further acquiring human body three-dimensional density distribution information; computing and acquiring simulated three-dimensional dose distribution information according to virtual radiation parameters and preset dose values; controlling a medical accelerator to perform irradiation experiments to acquire measured radiation field flux information, and computing to acquire measured three-dimensional dose distribution information; comparing the simulated three-dimensional dose distribution information and the measured three-dimensional dose distribution information, marking spatial locations that difference values are larger than preset thresholds, and further producing a difference statistical table. The problems that a used uniform phantom is different with a realistic human body in density distribution are solved effectively, and computing results are more accurate; spatial locations with high difference degree are marked, the difference statistical table is produced, and accordingly researchers can grasp specific situations more intuitively and easily; the three-dimensional dose distribution difference analyzing method is widely applicable to the field of radiotherapy.

Description

technical field [0001] The invention relates to the field of radiotherapy research, in particular to a TPS-based three-dimensional dose distribution difference analysis method and system. Background technique [0002] TPS, Radiation Therapy Planning System. Radiation therapy is one of the important treatment methods for cancer at present. Before using the commonly used precision radiotherapy techniques such as three-dimensional conformal radiotherapy, intensity-modulated radiotherapy and three-dimensional stereotactic radiotherapy to treat patients, it is necessary to use the radiotherapy planning system to formulate the patient's radiotherapy plan. Before the formal implementation of the treatment, in order to verify whether the actual radiation dose is consistent with the expected dose calculated by the planning system, the so-called "uniform phantom planning transplantation indirect analogy method" is usually used, and the steps are as follows: [0003] 1. According to c...

Claims


Application Information

Patent Timeline
IPC IPC(8): A61B6/00
Inventor 张书旭余辉林生趣张国前王锐濠
Owner CANCER CENT OF GUANGZHOU MEDICAL UNIV
Learn More