Protein secondary mass spectrum identification method of marker loci based on candidate peptide fragment discrimination
A technology of labeling atlas and secondary mass spectrometry, applied in the field of protein secondary mass spectrometry identification, which can solve problems such as insufficient comprehensiveness and little consideration of continuous peak matching.
- Summary
- Abstract
- Description
- Claims
- Application Information
AI Technical Summary
Problems solved by technology
Method used
Image
Examples
Embodiment 1
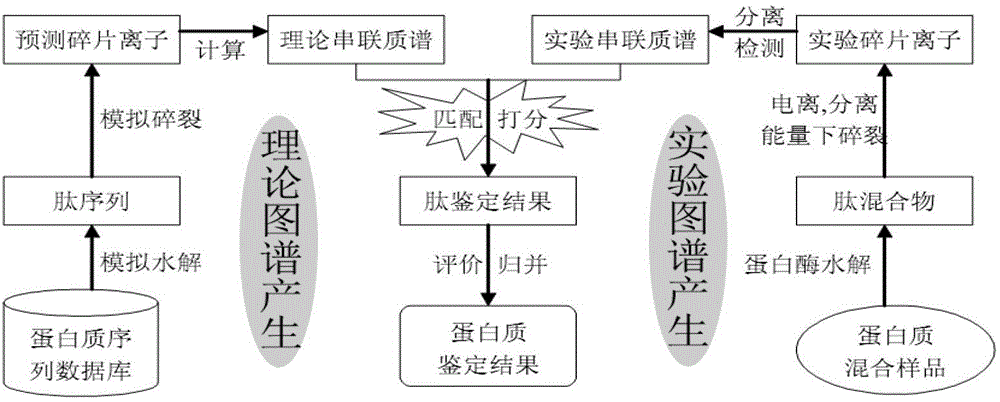
[0073] Virtually digest the protein database sequence, and establish a peptide database and a peptide database index for the peptide after enzymatic digestion according to the mass number of the peptide. The steps are as follows:
[0074] (1) Read a protein sequence in the species protein sequence library file of the mass spectrometry sample (that is, the sample to be analyzed by MS / MS).
[0075] (2) Carry out virtual theoretical digestion of the protein sequence according to Table 1 according to the protease set by the user and the number of allowed missed cleavage sites. At present, most trypsin is used for protein enzymatic hydrolysis experiments. It can be seen from Table 1 that Trypsin is sensitive to protein C-Term, that is to say, an amino acid may be cut off at the C-terminus of the protein sequence; its enzyme cleavage site KR, that is to say The enzyme cuts on the K and R of the sequence; its restriction site is P, that is to say, when the enzyme cuts on the sequence...
Embodiment 2
[0101] According to the mass-to-charge ratio peptide database of the parent ion in the experimental spectrum to be analyzed (secondary mass spectrometry), find out the candidate peptides that meet the requirements, and generate theoretical spectra that meet the requirements for all the candidate peptides found.
[0102] (1) According to the parent-child mass-to-charge ratio of the secondary mass spectrum to be analyzed, the method of finding the candidate peptides that meet the requirements:
[0103] 1) Load the database.index file information to the memory array index, read the m / z value and charge (charge) information of the parent ion of the secondary mass spectrometer to be analyzed, and calculate the mass number of the parent ion after it is decharged, for example, there is a m / z=2100.2, charge=2 parent ion information, its mass number after decharge is m / z*2-2=4198.2.
[0104] 2) Find the index array record and read the corresponding peptide information according to the ...
Embodiment 3
[0114] The steps of de-isotope peak processing and selection of effective peaks for the experimental spectrum to be analyzed are as follows:
[0115] (1) Deisotope peak
[0116] Theoretically, the mass-to-charge ratio m / z difference between isotopic peaks is 1 and the peak intensity between isotopic peaks is controlled by the natural isotopic abundance. For example, the abundance of C12 in nature is higher than that of C13, and the height of its mass spectrum peak is also higher than that of C13. Among the stable isotopes in nature, the basic abundance of low molecular weight accounts for the highest abundance. In a mass spectrum, in an isotopic peak group, the first peak should basically be the highest peak. In the measurement of the actual mass spectrometer, there are measurement errors in the mass spectrometer. Depending on the type of mass spectrometer, the measurement accuracy is also different. For example, the measurement error of LTQ mass spectrometer is 0.5Da. Sinc...
PUM
 Abstract
Description
Claims
Application Information
 - R&D
- Intellectual Property
- Life Sciences
- Materials
- Tech Scout
- Unparalleled Data Quality
- Higher Quality Content
- 60% Fewer Hallucinations
Browse by: Latest US Patents, China's latest patents, Technical Efficacy Thesaurus, Application Domain, Technology Topic, Popular Technical Reports.
© 2025 PatSnap. All rights reserved.Legal|Privacy policy|Modern Slavery Act Transparency Statement|Sitemap|About US| Contact US: help@patsnap.com


