
Web geographic information system (WEBGIS)-based visualized showing method for planning power grid

A technology of WEB server and power grid, which is applied in the field of transmission network, can solve the problems of unsystematic data retention, low data utilization efficiency, difficulty in guaranteeing the accuracy and reliability of power grid planning, etc., and achieve the effect of intuitive comparison

Active Publication Date: 2013-05-08
CHINA ELECTRIC POWER RES INST +2
View PDF2 Cites 28 Cited by
  • Summary
  • Abstract
  • Description
  • Claims
  • Application Information

AI Technical Summary

Problems solved by technology

With the continuous development of planning work, the data of the early work has not been systematically preserved, and the utilization efficiency of the data in the later work is not high. At the same time, the accuracy of the data is not consistent with the level of technical personnel and the detailed level of power grid voltage level simulation. Data resources have a lot to do with
In addition, due to historical reasons, there are differences in the models and parameters of some power grid planning and dispatching majors in terms of load and actual operating units.
Therefore, the accuracy and reliability of the information required for power grid planning is difficult to guarantee, and it is not compatible with the current level of information construction of power grid planning, and it is difficult to adapt to the new situation of current UHV power grid planning

Method used


Image

  • Web geographic information system (WEBGIS)-based visualized showing method for planning power grid
  • Web geographic information system (WEBGIS)-based visualized showing method for planning power grid

Examples


Embodiment Construction

[0037] The present invention will be described in further detail below in conjunction with the accompanying drawings.

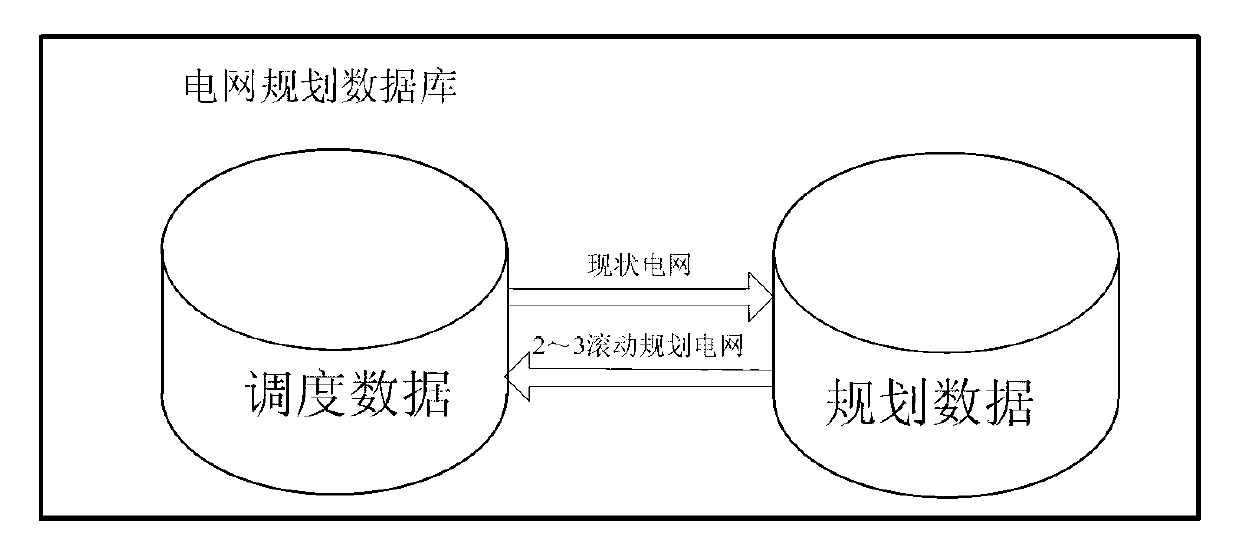
[0038] The grid planning data, 2-3 year rolling calculation data and dispatching operation data describe the same grid in different periods. The planning data is a description of the future of the current power grid. It should be derived from the current power grid, and a new system is generated by modifying the changes caused by equipment commissioning, decommissioning and equipment transformation between now and the planning year. The 2-3 year rolling calculation data is only based on the recent construction situation of the power grid, and the calculation data formed by estimating the changes of the power grid in the past 2-3 years. It can be considered as planning data, but compared with planning, its data is more accurate and the date of production is more certain. Combined with load forecasting and load distribution rules, these data can easily produce...


PUM


Abstract

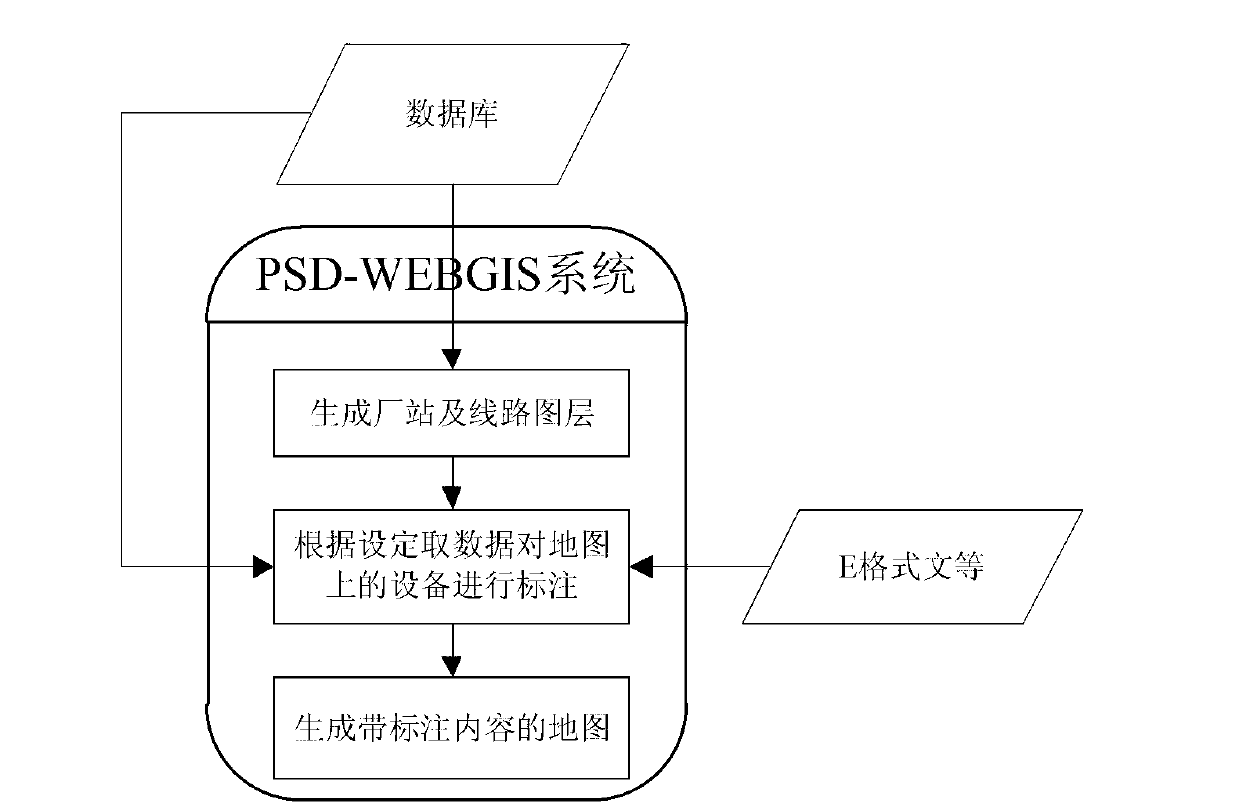
The invention provides a web geographic information system (WEBGIS)-based visualized showing method for planning a power grid. The method comprises the following steps of: loading background map information; reading power grid equipment parameters in a power grid planning database, and generating a geographic wiring diagram of a planned power grid automatically; and labeling equipment state information and a load flow calculation result of a selected running mode. According to the method, functions of arranging a station which is to be planned and setting line coordinates are realized on a geographic background map by utilizing WEBGIS, so that the station is planned and coordinates of the planned line are edited on the background map visually by the WEBGIS; and a function of labeling the geographic wiring diagram in a planning scheme is realized on the geographic background map, so that specific information in the database is labeled on the geographic wiring diagram. The method is simple, reliable and easy to operate.

Description

technical field [0001] The invention belongs to the technical field of power transmission network, and in particular relates to a WEBGIS-based visualized display method for a planned power network. Background technique [0002] Power grid planning analysis and calculation is the basis for ensuring the smooth progress of power grid planning, design, and construction and realizing the safe and stable operation of the power grid. Power grid planning is a highly technical and theoretical original work, and a very complex system engineering. Power grid planning is a development plan for the grid structure of the power grid based on power system load forecasting and power system power supply planning. It is an important part of power system planning. In 2003, the State Grid Corporation issued the "Deep Provisions on the Contents of State Grid Corporation's Grid Planning and Design" (State Grid Regulations [2003] No. Specific in-depth requirements for planning and design, includi...

Claims


Application Information

Patent Timeline
IPC IPC(8): G06F17/50
CPCY02E60/76Y04S40/22Y02E60/00
Inventor 陶向红李明陈向宜肖静郅治范亚娜刘燕嘉
Owner CHINA ELECTRIC POWER RES INST
Learn More