Method for determining crude oil true boiling point distillation curve by using infrared spectroscopy
A real boiling point distillation and infrared spectroscopy technology, which is used in the field of predicting the real boiling point distillation curve, can solve the problems of large sample consumption, long analysis time, and inability to meet the requirements of rapid quality detection and online analysis of crude oil.
- Summary
- Abstract
- Description
- Claims
- Application Information
AI Technical Summary
Problems solved by technology
Method used
Image
Examples
example 1
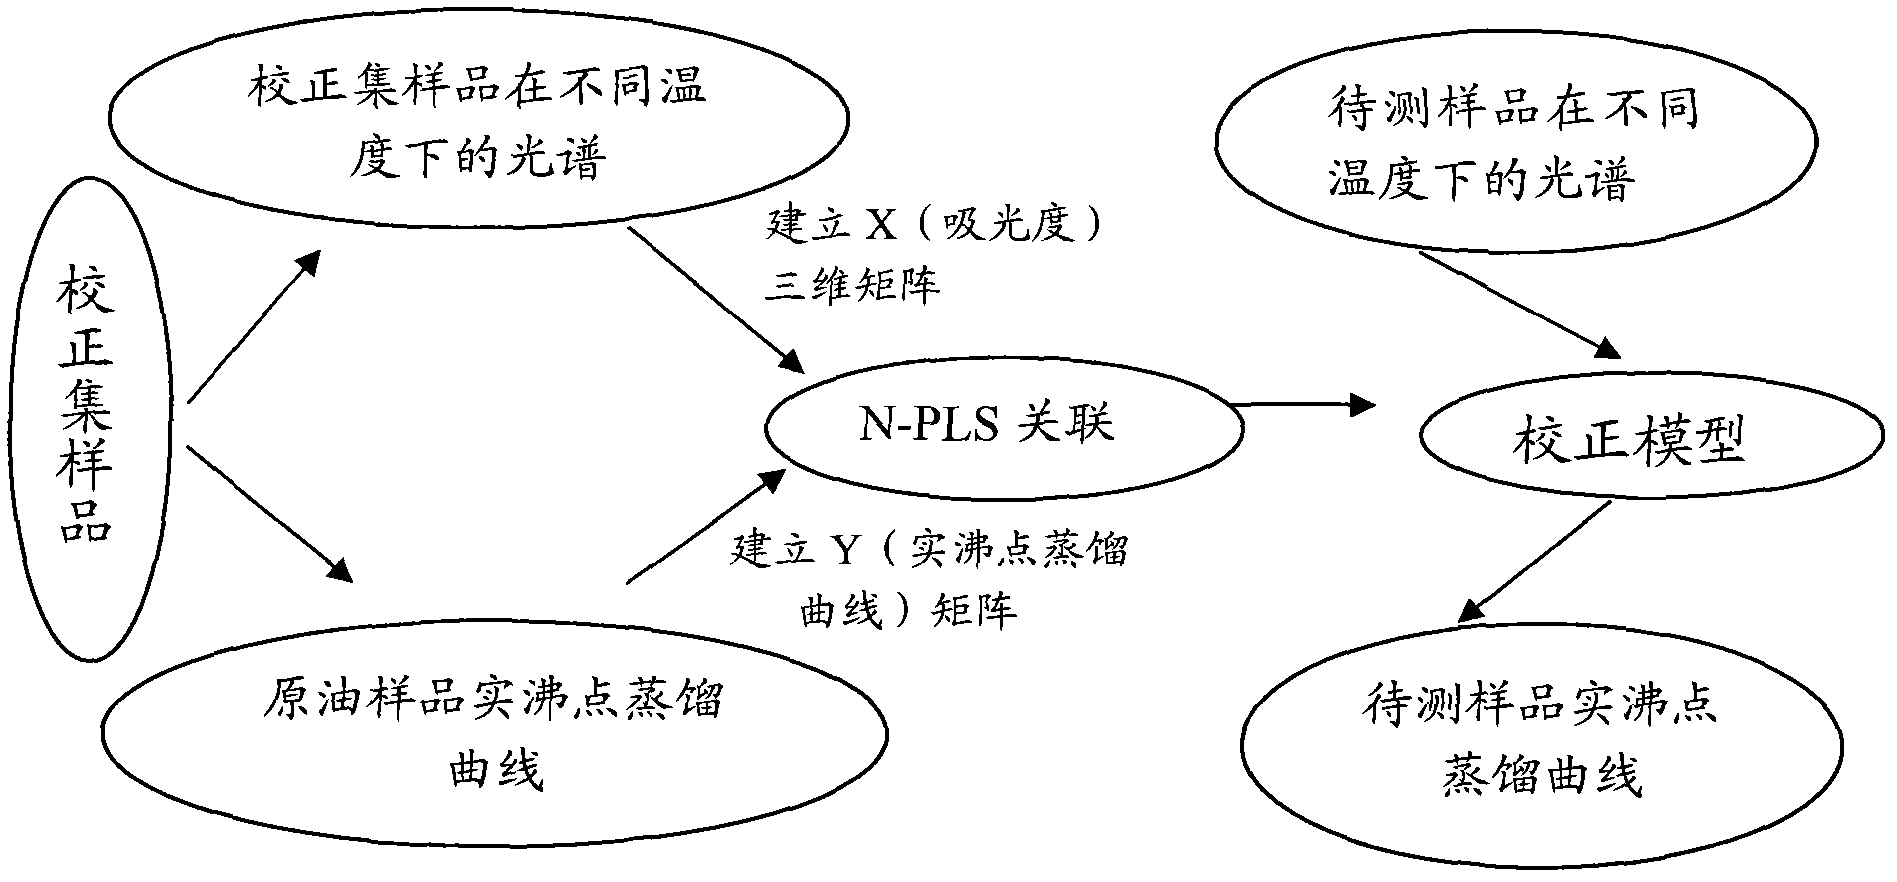
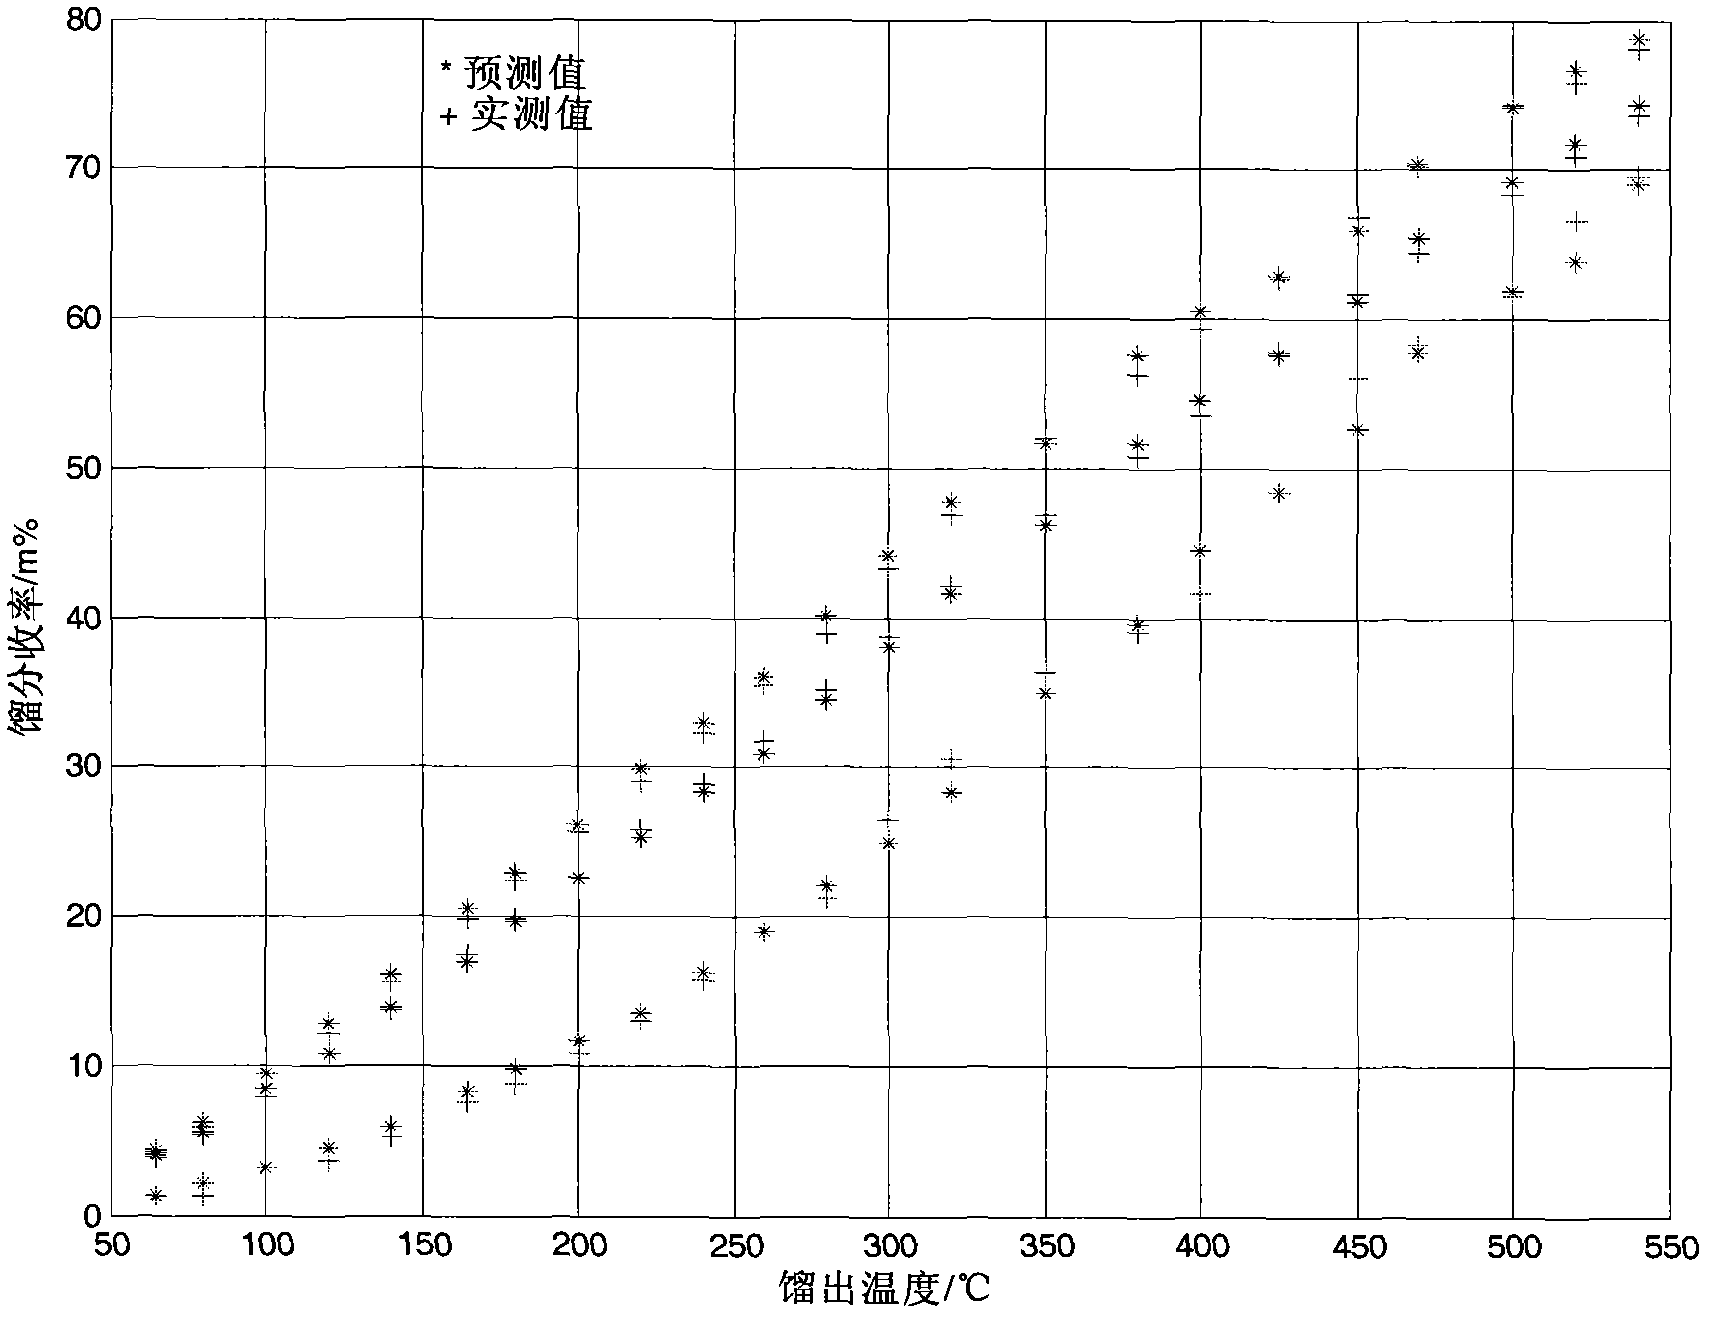
[0059] The correction model of infrared spectrum of crude oil true boiling point distillation curve was established and verified.
[0060] (1) Determination of crude oil true boiling point distillation curve by standard method
[0061] Collect 200 crude oil samples from each major production area, and use the methods of GB / T 17280 and GB / T 17475 to obtain the mass yield of distillate components at the following 23 distillation temperatures: 65°C, 80°C, 100°C, 120°C , 140°C, 165°C, 180°C, 200°C, 220°C, 240°C, 260°C, 280°C, 300°C, 320°C, 350°C, 380°C, 400°C, 425°C, 450°C, 470°C, 500°C °C, 520 °C, 540 °C. The true boiling point distillation curve of the crude oil sample was drawn from the distillation temperature and the mass yield of the distilled components. Collect 160 representative crude oil samples to make up the calibration set.
[0062] (2) Establish a calibration model with the calibration set samples
[0063] The infrared spectra of the samples in the calibration se...
example 2
[0075] According to the method of Example 1, the infrared spectra of the calibration set samples at 30°C, 40°C, 50°C, and 60°C are at 677~3060cm -1 The absorbance in the characteristic spectrum area is related to the measured value of the standard method of the true boiling point curve of the crude oil sample. The difference is that the infrared spectrum of the crude oil sample is treated with the second order differential and then the absorbance in the characteristic spectrum area is taken to establish a three-dimensional matrix. X , using the N-PLS method to establish a correction model for the yield of distillate components at 23 distillation temperatures used in the standard method, and then use the verification set samples for verification. The relevant statistical parameters for the establishment of the correction model are shown in Table 3. The infrared spectra of the three crude oil samples in the verification set were collected, and the calibration model established in...
PUM
 Abstract
Description
Claims
Application Information
 - R&D
- Intellectual Property
- Life Sciences
- Materials
- Tech Scout
- Unparalleled Data Quality
- Higher Quality Content
- 60% Fewer Hallucinations
Browse by: Latest US Patents, China's latest patents, Technical Efficacy Thesaurus, Application Domain, Technology Topic, Popular Technical Reports.
© 2025 PatSnap. All rights reserved.Legal|Privacy policy|Modern Slavery Act Transparency Statement|Sitemap|About US| Contact US: help@patsnap.com


