A method for cultivating self activated lymphocyte
A technology of lymphocytes and culture methods, applied in the direction of cell culture active agents, biochemical equipment and methods, animal cells, etc., can solve problems such as limitations, and achieve the effects of simple administration, improved prognosis, and less side effects
- Summary
- Abstract
- Description
- Claims
- Application Information
AI Technical Summary
Problems solved by technology
Method used
Image
Examples
Embodiment 1
[0044] Example 1: Preparation of Autoactivated Lymphocytes
[0045] Lymphocytes obtained from 60cc of the patient's peripheral blood were suspended in 3ml of culture medium, mixed in 33ml of culture medium supplemented with 70ul IL-2, 200ul L-glutamine and 3ml of self-derived plasma. In the presence of anti-CD3, anti-CD16 and anti-CD56, culture for 4 days (the first culture step), and then mix in 60ml of culture medium added with 100ulIL-2, 1ml of L-glutamine and 7ml of self-derived plasma , continue culturing for 3 days (the second culturing step), then add 7ml of plasma derived from itself to the culture mixture after the second culturing step, inject it into a gas-permeable culture bag containing 1L of culture fluid, and culture for 7 more days. days (the third cultivation step).
Embodiment 2
[0046] Example 2: Observing changes in phenotype and cell number before and after culture
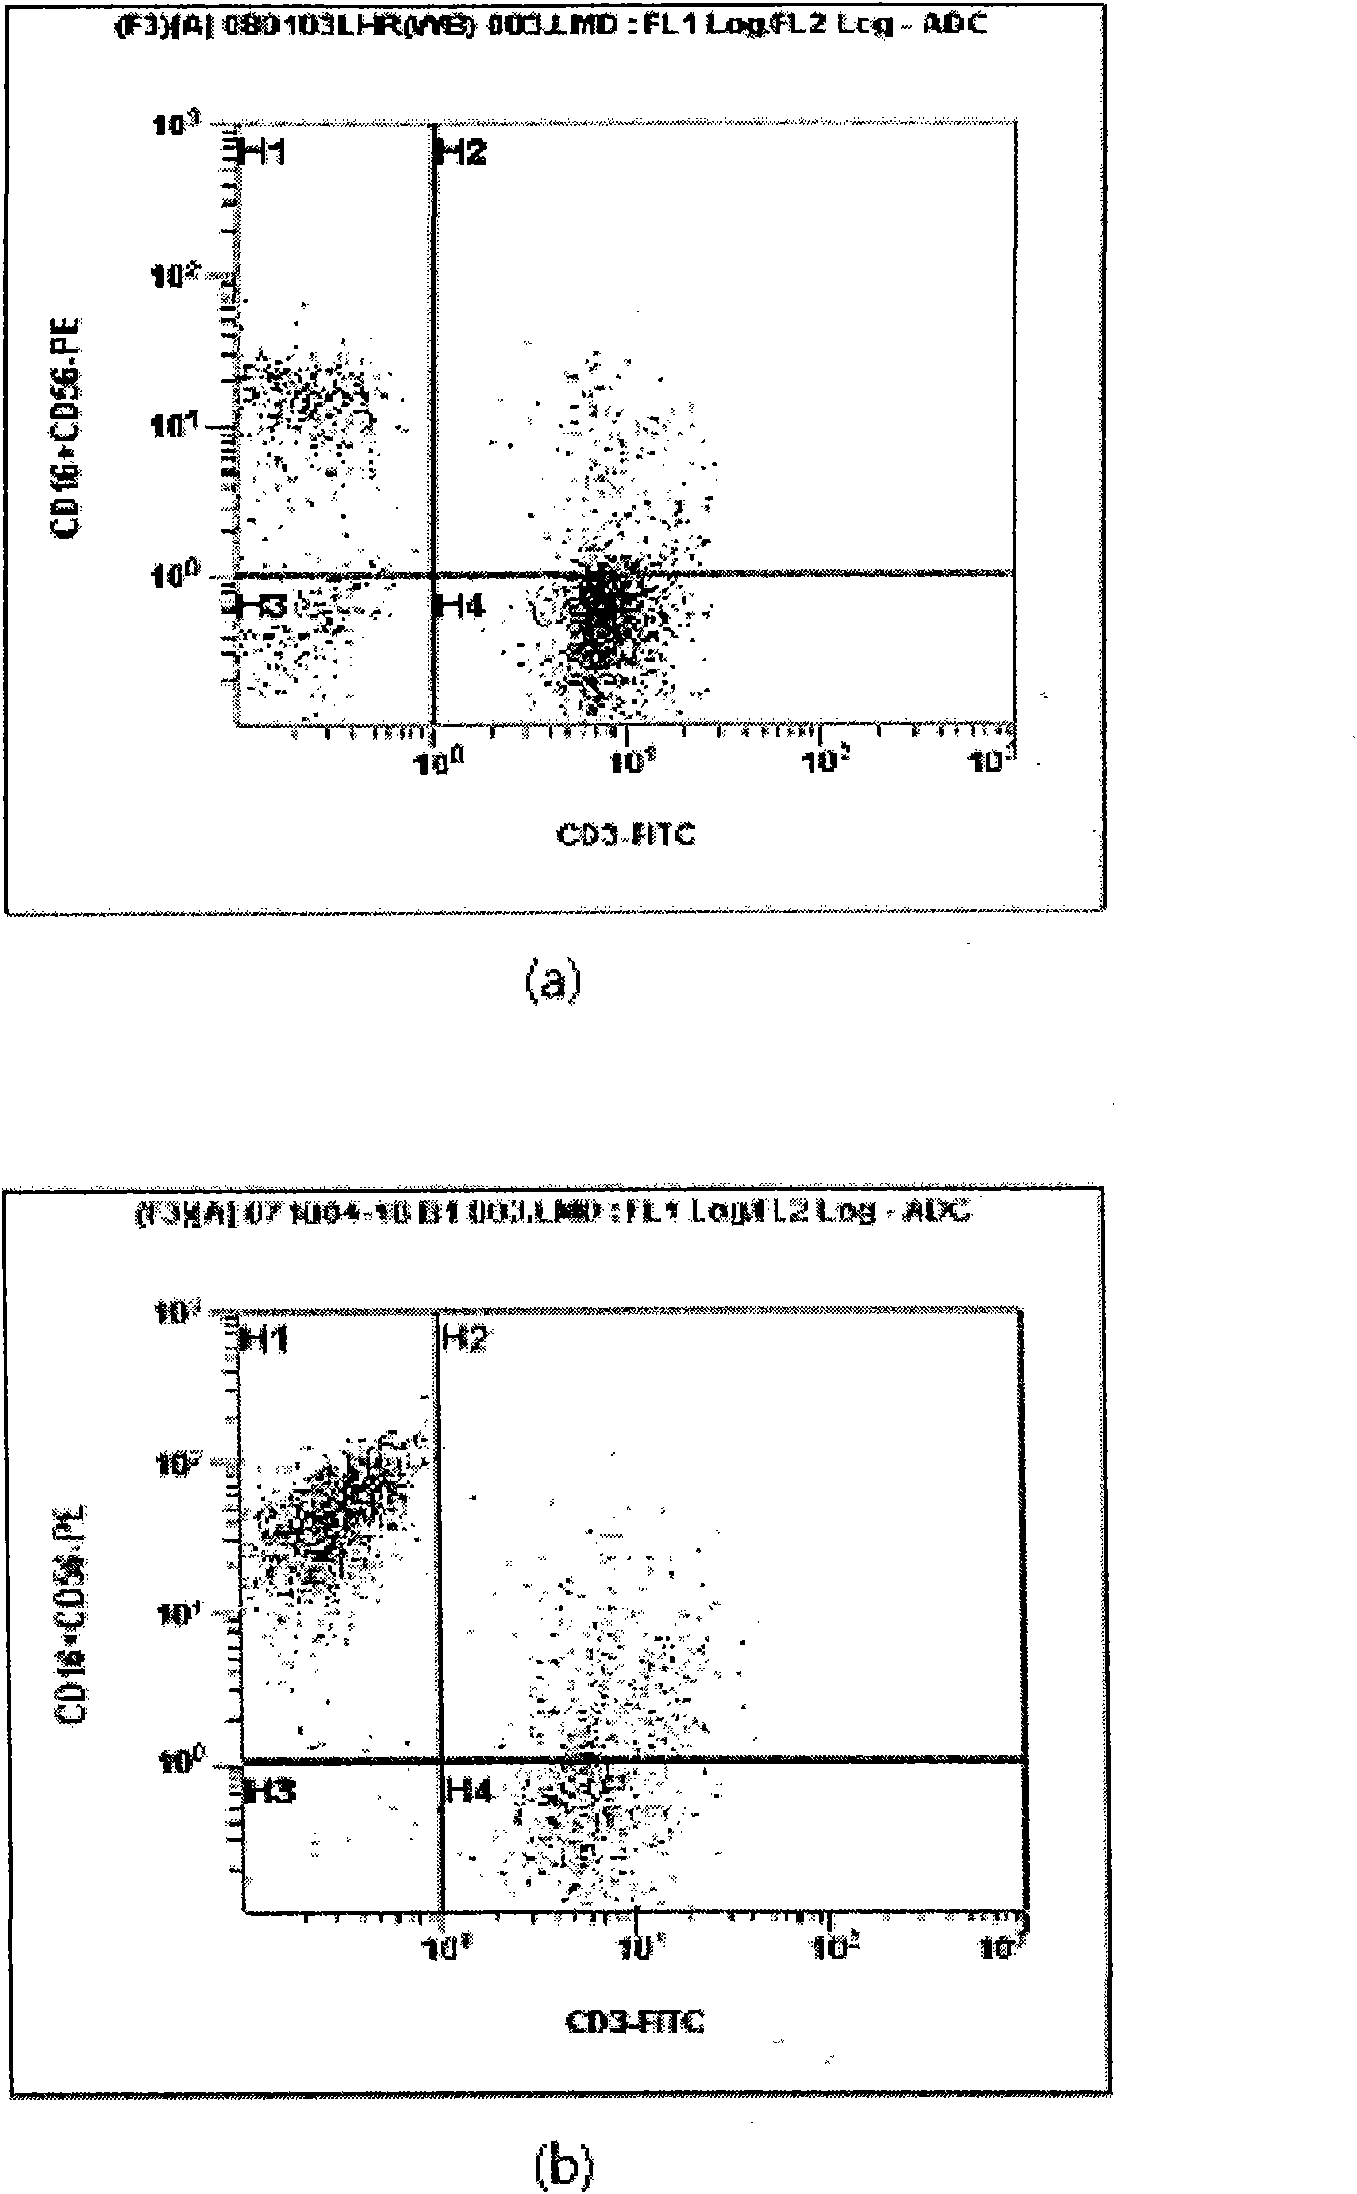
[0047] figure 1 It is a schematic diagram of the phenotype changes of activated lymphocytes before and after culture. The H1 area represents NK cells, the H4 area represents T cells, the H2 area represents NKT cells, and the H3 area represents the distribution of other immune cells. figure 2 It is a schematic diagram of the change of the number of immune cells in the culture process according to the present invention.
[0048] The activated lymphocytes cultured by the same method as in Example 1 were analyzed by flow cytometry (floweytometry) for surface antigens, and figure 1 To illustrate the results, as shown in Figure (a), the distribution of surface antigens before culture is mainly in the H4 region, and as shown in Figure (b), the distribution of surface antigens after culture is mainly in the H1 region, and the actual calculation of CD3 positive (Positive ) T cells and CD16+...
Embodiment 3
[0050] Example 3: Analysis of Cytotoxicity to Various Cancer Cells
[0051] image 3 It is a schematic diagram of the cytotoxicity analysis results of the activated lymphocytes obtained according to the present invention.
[0052] When activated lymphocytes cultured by the method of Example 1 were used as effector cells, a blood cancer cell line (K562) was used as target cells, and the ratio of cancer cells to activated lymphocytes was set at 10:1, the activated lymphocytes were measured. Cytotoxicity analysis was performed on the killing ability of cells against blood cancer cell lines, and the results were as follows: image 3 As shown, the cytotoxicity of activated lymphocytes increased 6.8 to 16.4 times compared with lymphocytes isolated from normal blood.
PUM
| Property | Measurement | Unit |
|---|---|---|
| molecular weight | aaaaa | aaaaa |
| molecular weight | aaaaa | aaaaa |
Abstract
Description
Claims
Application Information
 - R&D
- Intellectual Property
- Life Sciences
- Materials
- Tech Scout
- Unparalleled Data Quality
- Higher Quality Content
- 60% Fewer Hallucinations
Browse by: Latest US Patents, China's latest patents, Technical Efficacy Thesaurus, Application Domain, Technology Topic, Popular Technical Reports.
© 2025 PatSnap. All rights reserved.Legal|Privacy policy|Modern Slavery Act Transparency Statement|Sitemap|About US| Contact US: help@patsnap.com


