Monitoring phase non-linearities in an optical communication system

a technology of optical communication system and phase non-linearity, applied in the field of optical communication system monitoring phase non-linearity, can solve the problems of limiting system performance and signal reach, degrading optical signal, and affecting so as to simplify the correlation algorithm and improve the accuracy of correlation function

Inactive Publication Date: 2014-07-15
RPX CLEARINGHOUSE
View PDF12 Cites 7 Cited by
  • Summary
  • Abstract
  • Description
  • Claims
  • Application Information

AI Technical Summary

Benefits of technology

[0018]In some embodiments, the test signal is generated by simultaneously transmitting probe and data signals through respective channels of the optical communications system. In this case, the probe signal has an arbitrary frequency, but has a rise and fall time that is selected to emulate that of live data traffic. This arrangement produces a test signal, at the receiving end of the optical communications system, which comprises the data signal and a distortion component in the form of frequency chirps that are uniquely associated with cross-phase modulation (XPM) between the probe and data signal channels. The frequency chirps in the test signal can be measured by a conventional clock-recovery circuit, and isolated (from other frequency-domain noise) by correlation with rising and falling edges of the probe signal. Accuracy of this correlation function can be improved by prefiltering the received probe signal prior to the correlation.
[0019]In other embodiments, the test signal is generated by imposing a selected dispersion to a data signal received through a selected channel of the optical communications system. For “flat portions” of the test signal, the variation in signal noise (e.g. as represented by bit error rate) with changes in the imposed dispersion can be readily evaluated, and is uniquely associated with non-linearity in the optical communications system.
[0020]In further embodiments of the present invention, a respective high-speed analog-to digital detector is used to sample each channel of the optical communications system. The sample data is stored in association with the corresponding recovered data generated by conventional data recovery circuits. In this case, the test signal comprises an isolated signal pulse within the recovered data. A digital signal processor (DSP) can then analyze the associated sample data to determine the corresponding signal waveform. Changes in the signal wave form with changing transmission power level of the involved channel provides a direct measure of self-phase modulation (SPM). Correlation between simultaneously stored sample data of adjacent channels provides a direct measure of cross-channel effects, such as XPM and cross-talk. If desired, a probe signal as described above, can be used to simplify the correlation algorithm implemented in the DSP for evaluating XPM.

Problems solved by technology

However, conventional optical waveguides (such as optical fibers) comprise an optical transmission medium which exhibits nonlinear effects at high optical power levels, resulting in degradation of the optical signal.
Of particular concern in considering nonlinear processes are the effects of phase nonlinearities, which increase as data rates and optical power levels increase, and which ultimately limit both system performance and signal reach.
In particular, changing optical power causes a change in the refractive index of the fiber medium.
Thus, changing optical power levels due to modulation of an optical signal causes a frequency-shift (or chirp) within the signal itself.
Chromatic dispersion of the fiber will then cause these red- and blue-shifted portions of the pulse to propagate through the fiber at different speeds, which may result in time-domain distortion of the original pulse shape.
Clearly, the effects of SPM become increasingly severe as signal power, data rate (or spectral efficiency), and fiber span length are increased.
This interaction produces new, unwanted wavelengths (or side-bands) that can interfere with, and / or couple power from, desired optical signals.
Due to their cost and complexity, conventional optical signal and spectrum analysis equipment is typically restricted to laboratory use.
Furthermore, accurate measurement of nonlinear effects using such equipment typically requires specialized test set-ups, which, again, can only be provided in a laboratory setting.
While these systems enable some degree of performance monitoring, they tend to suffer a number of disadvantages.
Any error between the design and actual parameter values of the launched pilot tone will naturally degrade the accuracy of any performance parameters calculated at the monitoring point.
Consequently, frequency-dependent effects (most notably phase nonlinearities) cannot be detected with this arrangement.

Method used


Image

  • Monitoring phase non-linearities in an optical communication system
  • Monitoring phase non-linearities in an optical communication system
  • Monitoring phase non-linearities in an optical communication system

Examples


first embodiment

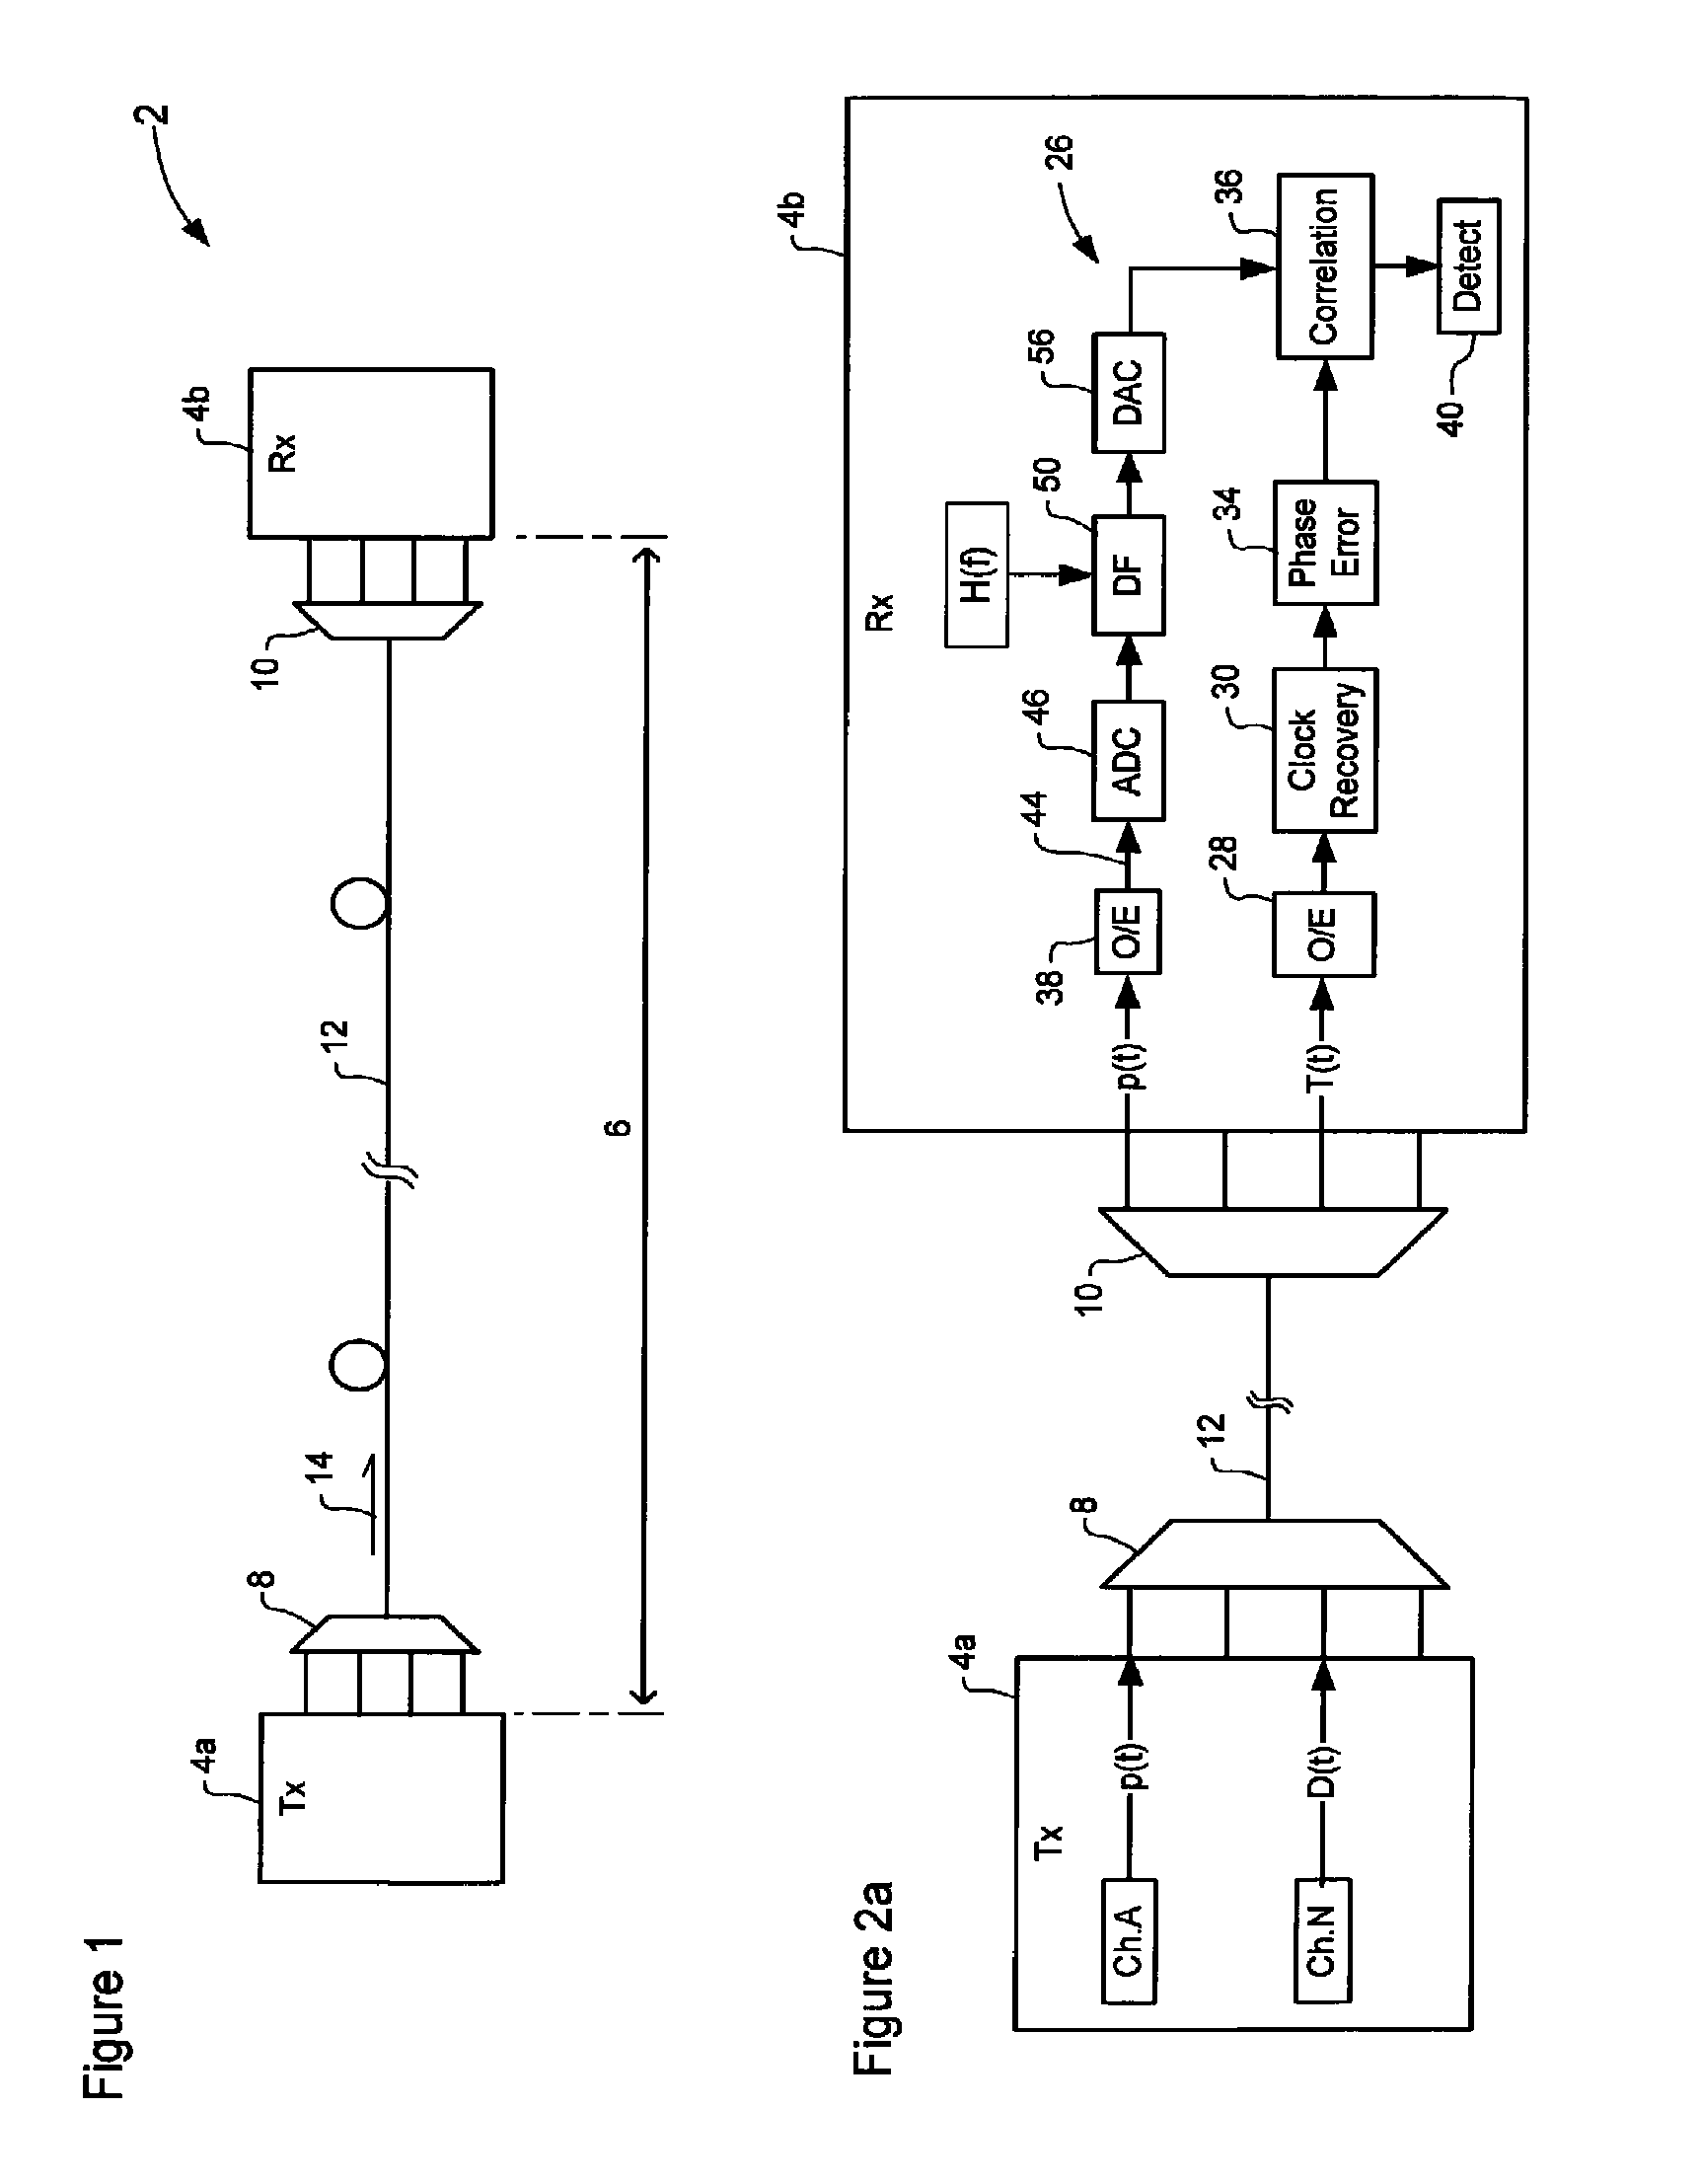
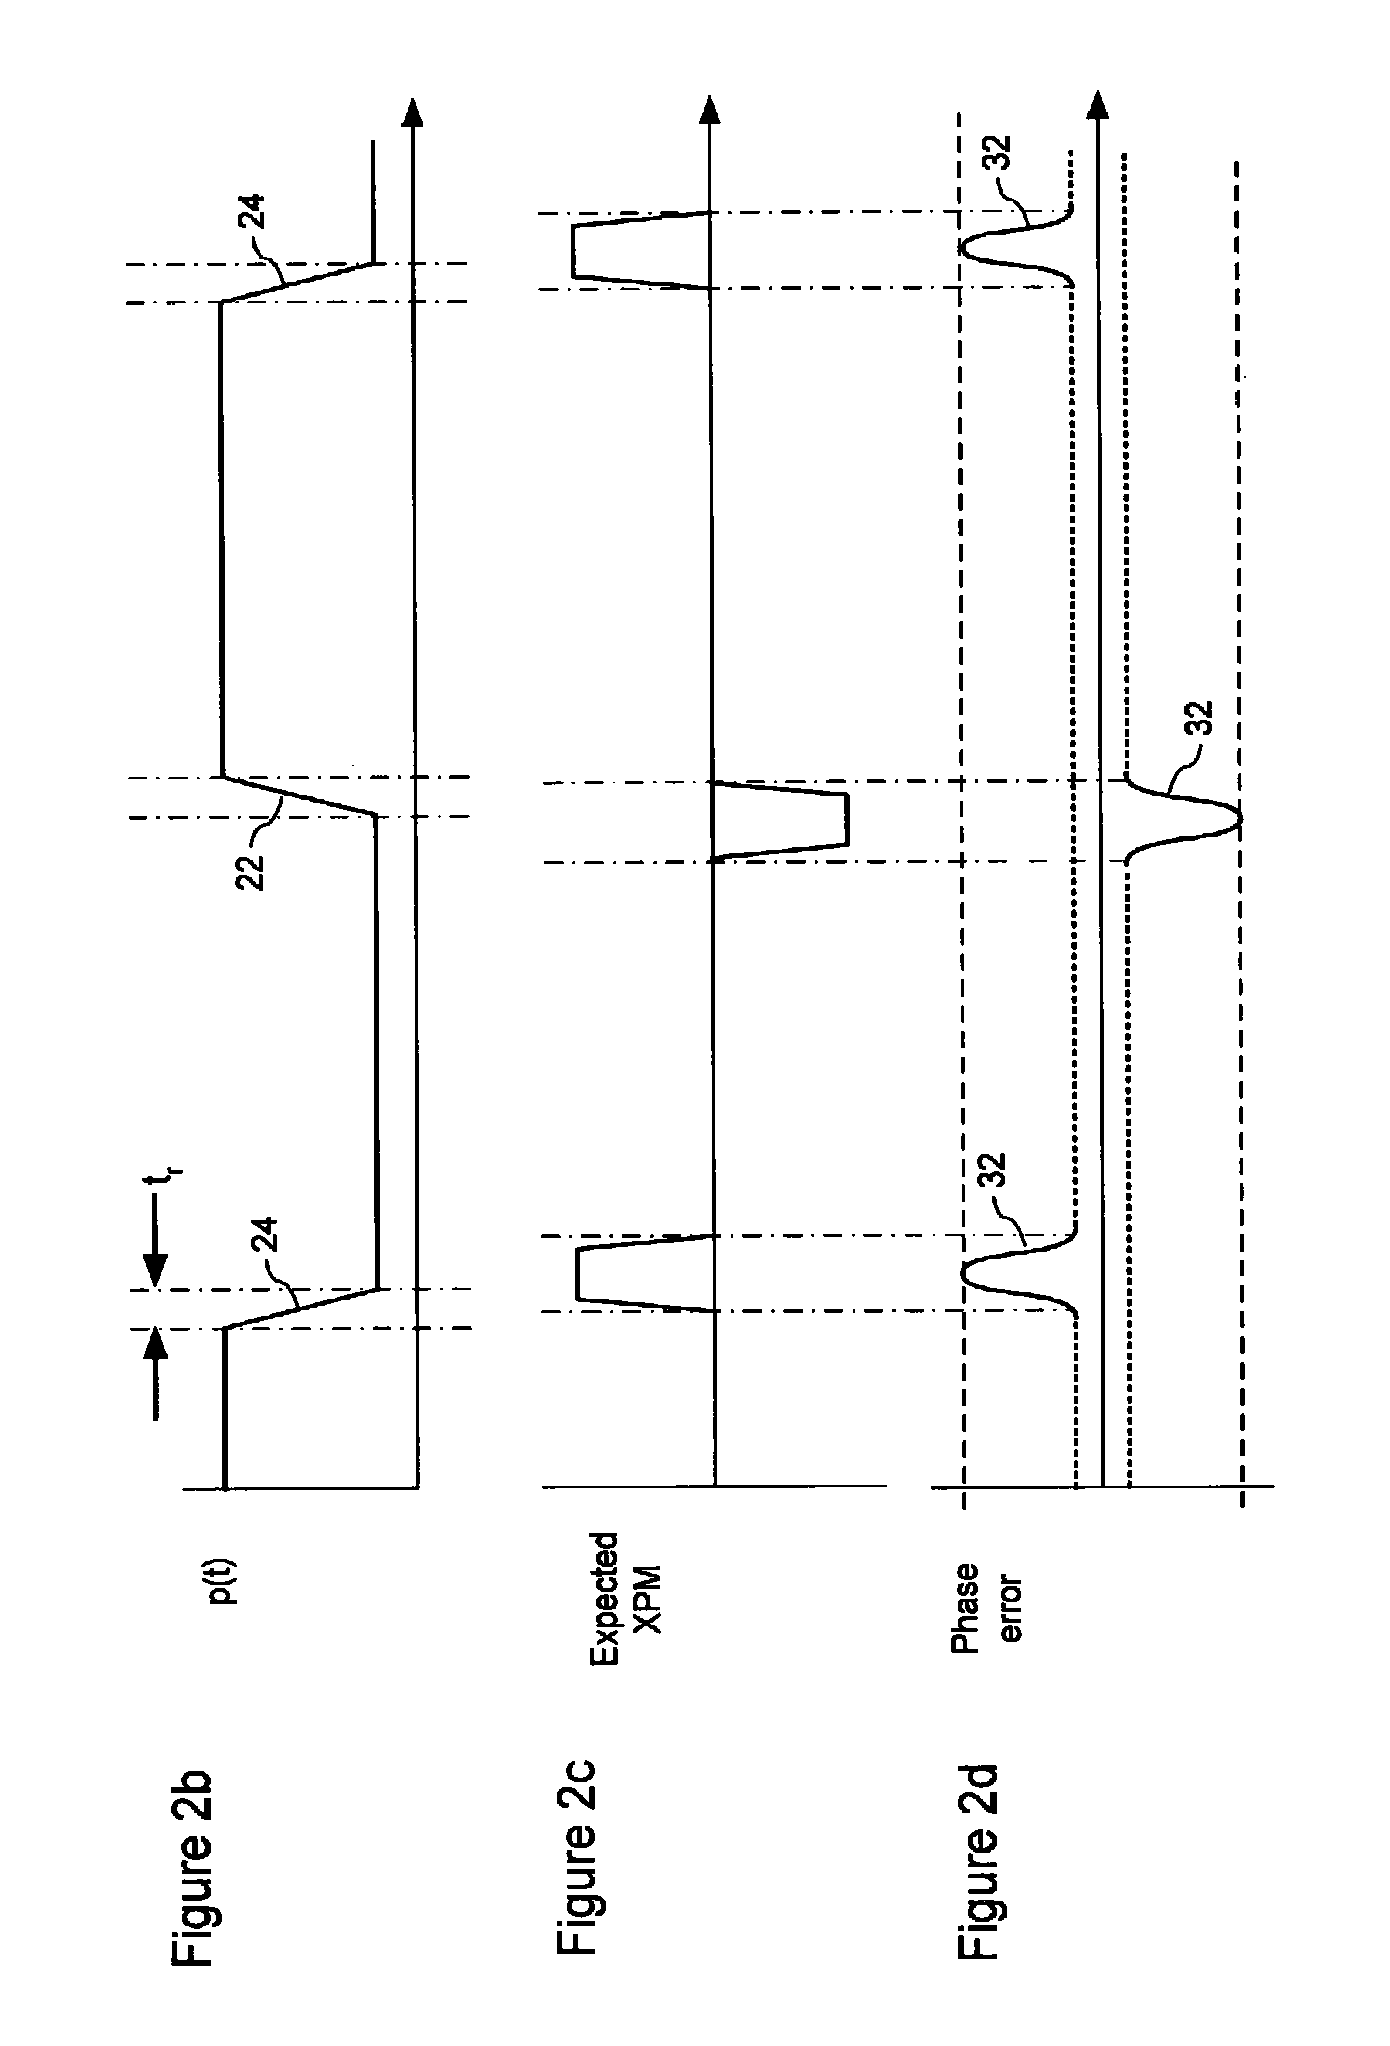
[0032]FIGS. 2a-2d schematically illustrate principal elements and operations of a monitoring system in accordance with the present invention. The embodiment of FIG. 2 is particularly suited for monitoring cross phase modulation (XPM) between a pair of channels. In the illustrated example, XPM is monitored between a first channel, which is nominally designated as channel A, and a second channel, nominally designated as Channel N. Thus a probe signal p(t) is transmitted through channel A using carrier wavelength 4, while a data signal D(t) is simultaneously transmitted through channel N using carrier wavelength 4T. As the two signals co-propagate through the link 6, XPM between channels A and N generates a test signal T(t) which is received, by the receiving node 4b, through channel N.

[0033]As is known in the art, XPM within the link 6 can be mathematically modeled (at least to a linear approximation) by means of a “transfer” function H(f); where the term (f) refers to the frequency v...

third embodiment

[0052]FIGS. 4a-4c schematically illustrate principal operations of a monitoring system in accordance with the present invention. Operation of this embodiment is based on the fact that, apart from dispersion and polarization effects (both of which can be compensated using known techniques), the received data signal DOUT(t) arriving at the receiving node 4b through the link 6 contains noise due to intersymbol interference, ASE and Thermal noise, and phase non-linearities. Within a sufficiently long “flat region” of the received data signal DOUT(t) (i.e., a string of successive binary “1”s or “0”s), variance due to intersymbol interference is avoided, so that the total noise power will comprise ASE and Thermal noise, and phase non-linearities. As shown in FIG. 4b, the ASE and Thermal noise is substantially independent of dispersion, while phase non-linearities are strongly dispersion dependent. Accordingly, phase non-linearities can be isolated and monitored by detecting changes in the...


PUM


Abstract

Phase nonlinearities of an optical communications system are monitored by generating a test signal which includes a predetermined property that is uniquely associated with at least one phase nonlinearity of the optical communications system. The predetermined property of the test signal is then detected at a monitoring point of the optical communications system, and used to estimate the associated phase nonlinearity.

Description

CROSS-REFERENCE TO RELATED APPLICATION[0001]This application is a divisional of patent application Ser. No. 10 / 389,804, filed Mar. 18, 2003, entitled MONITORING PHASE NON-LINEARITIES IN AN OPTICAL COMMUNICATIONS SYSTEM, the entirety of which is incorporated herein by reference.MICROFICHE APPENDIX[0002]n / aTECHNICAL FIELD[0003]The present invention relates to optical communications systems, and in particular to monitoring phase non-linearities in an optical communications system.BACKGROUND OF THE INVENTION[0004]In modern optical communications networks, it is generally desirable to transmit optical signals at high power levels in order to maintain sufficient signal to noise ratios over extended transmission distances, and thereby obtain an acceptably low Bit Error Rate (BER) in a received optical signal.[0005]However, conventional optical waveguides (such as optical fibers) comprise an optical transmission medium which exhibits nonlinear effects at high optical power levels, resulting...

Claims


Application Information

Patent Timeline
Patent Type & Authority Patents(United States)
IPC IPC(8): H04B10/079
CPCH04B10/073
Inventor ROBERTS, KIM B.O'SULLIVAN, MAURICE S.STRAWCZYNSKI, LEO L.
Owner RPX CLEARINGHOUSE
Why Eureka
Try Eureka