Method for identifying a convolved peak

a peak identification and convolved technology, applied in the field of data analysis, can solve problems such as difficult to determine whether or not a peak is a convolved peak, and complicate analysis

Active Publication Date: 2011-12-06
DH TECH DEVMENT PTE
View PDF10 Cites 0 Cited by
  • Summary
  • Abstract
  • Description
  • Claims
  • Application Information

AI Technical Summary

Benefits of technology

[0002]The present teachings can be used for data analysis to determine and interpret correlated variables. For example, multivariate statistical techniques can be applied to mass spectrometry (MS) data for use in biomarker discovery and metabolomics. MS can generate hundreds or thousands of variables, many of which are correlated, which complicates analysis. Although it is common to remove correlated variables prior to principal component analysis (PCA), their identification is valuable in the interpretation of mass spectral data since correlated peaks may be unpredictable fragments or may have known origins including, but not limited to, isotopes, adducts, and different charge states. Recognizing unpredictable fragments can help identify the compound that generated the spectrum.

Problems solved by technology

MS can generate hundreds or thousands of variables, many of which are correlated, which complicates analysis.
Determining whether or not a peak is a convolved peak can be difficult.

Method used


Image

  • Method for identifying a convolved peak
  • Method for identifying a convolved peak
  • Method for identifying a convolved peak

Examples


Embodiment Construction

COMPUTER-IMPLEMENTED SYSTEM

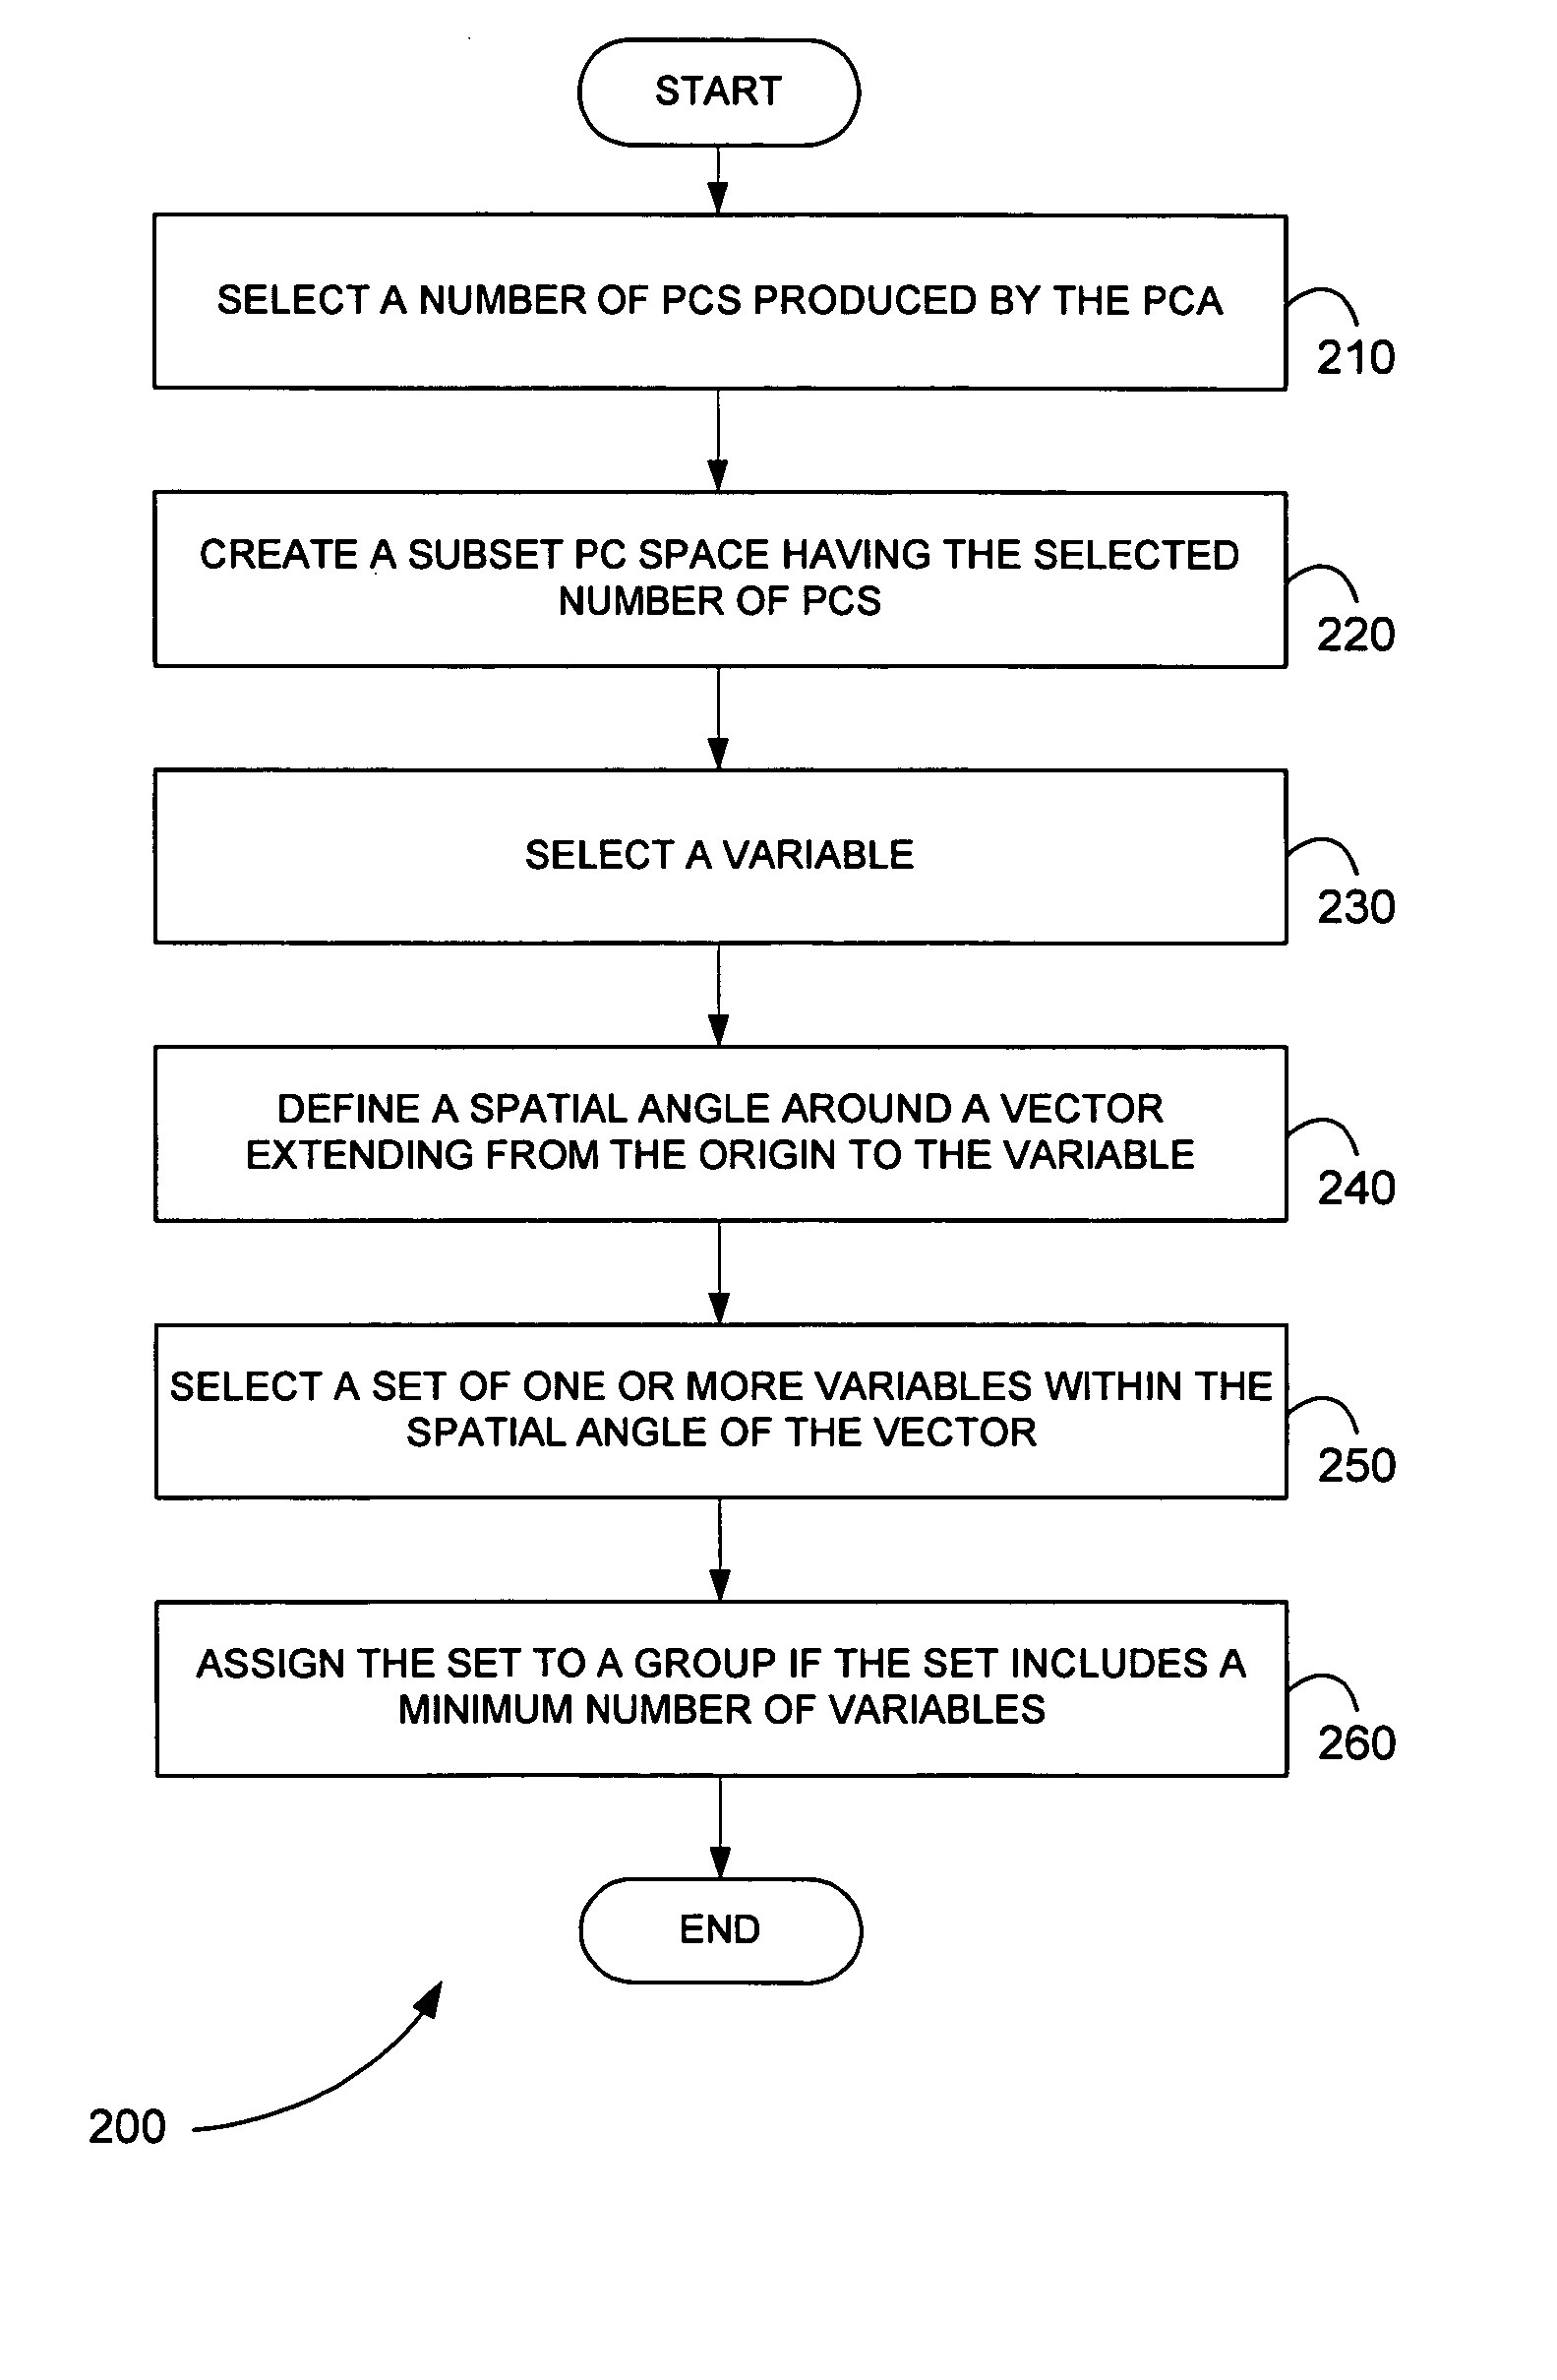
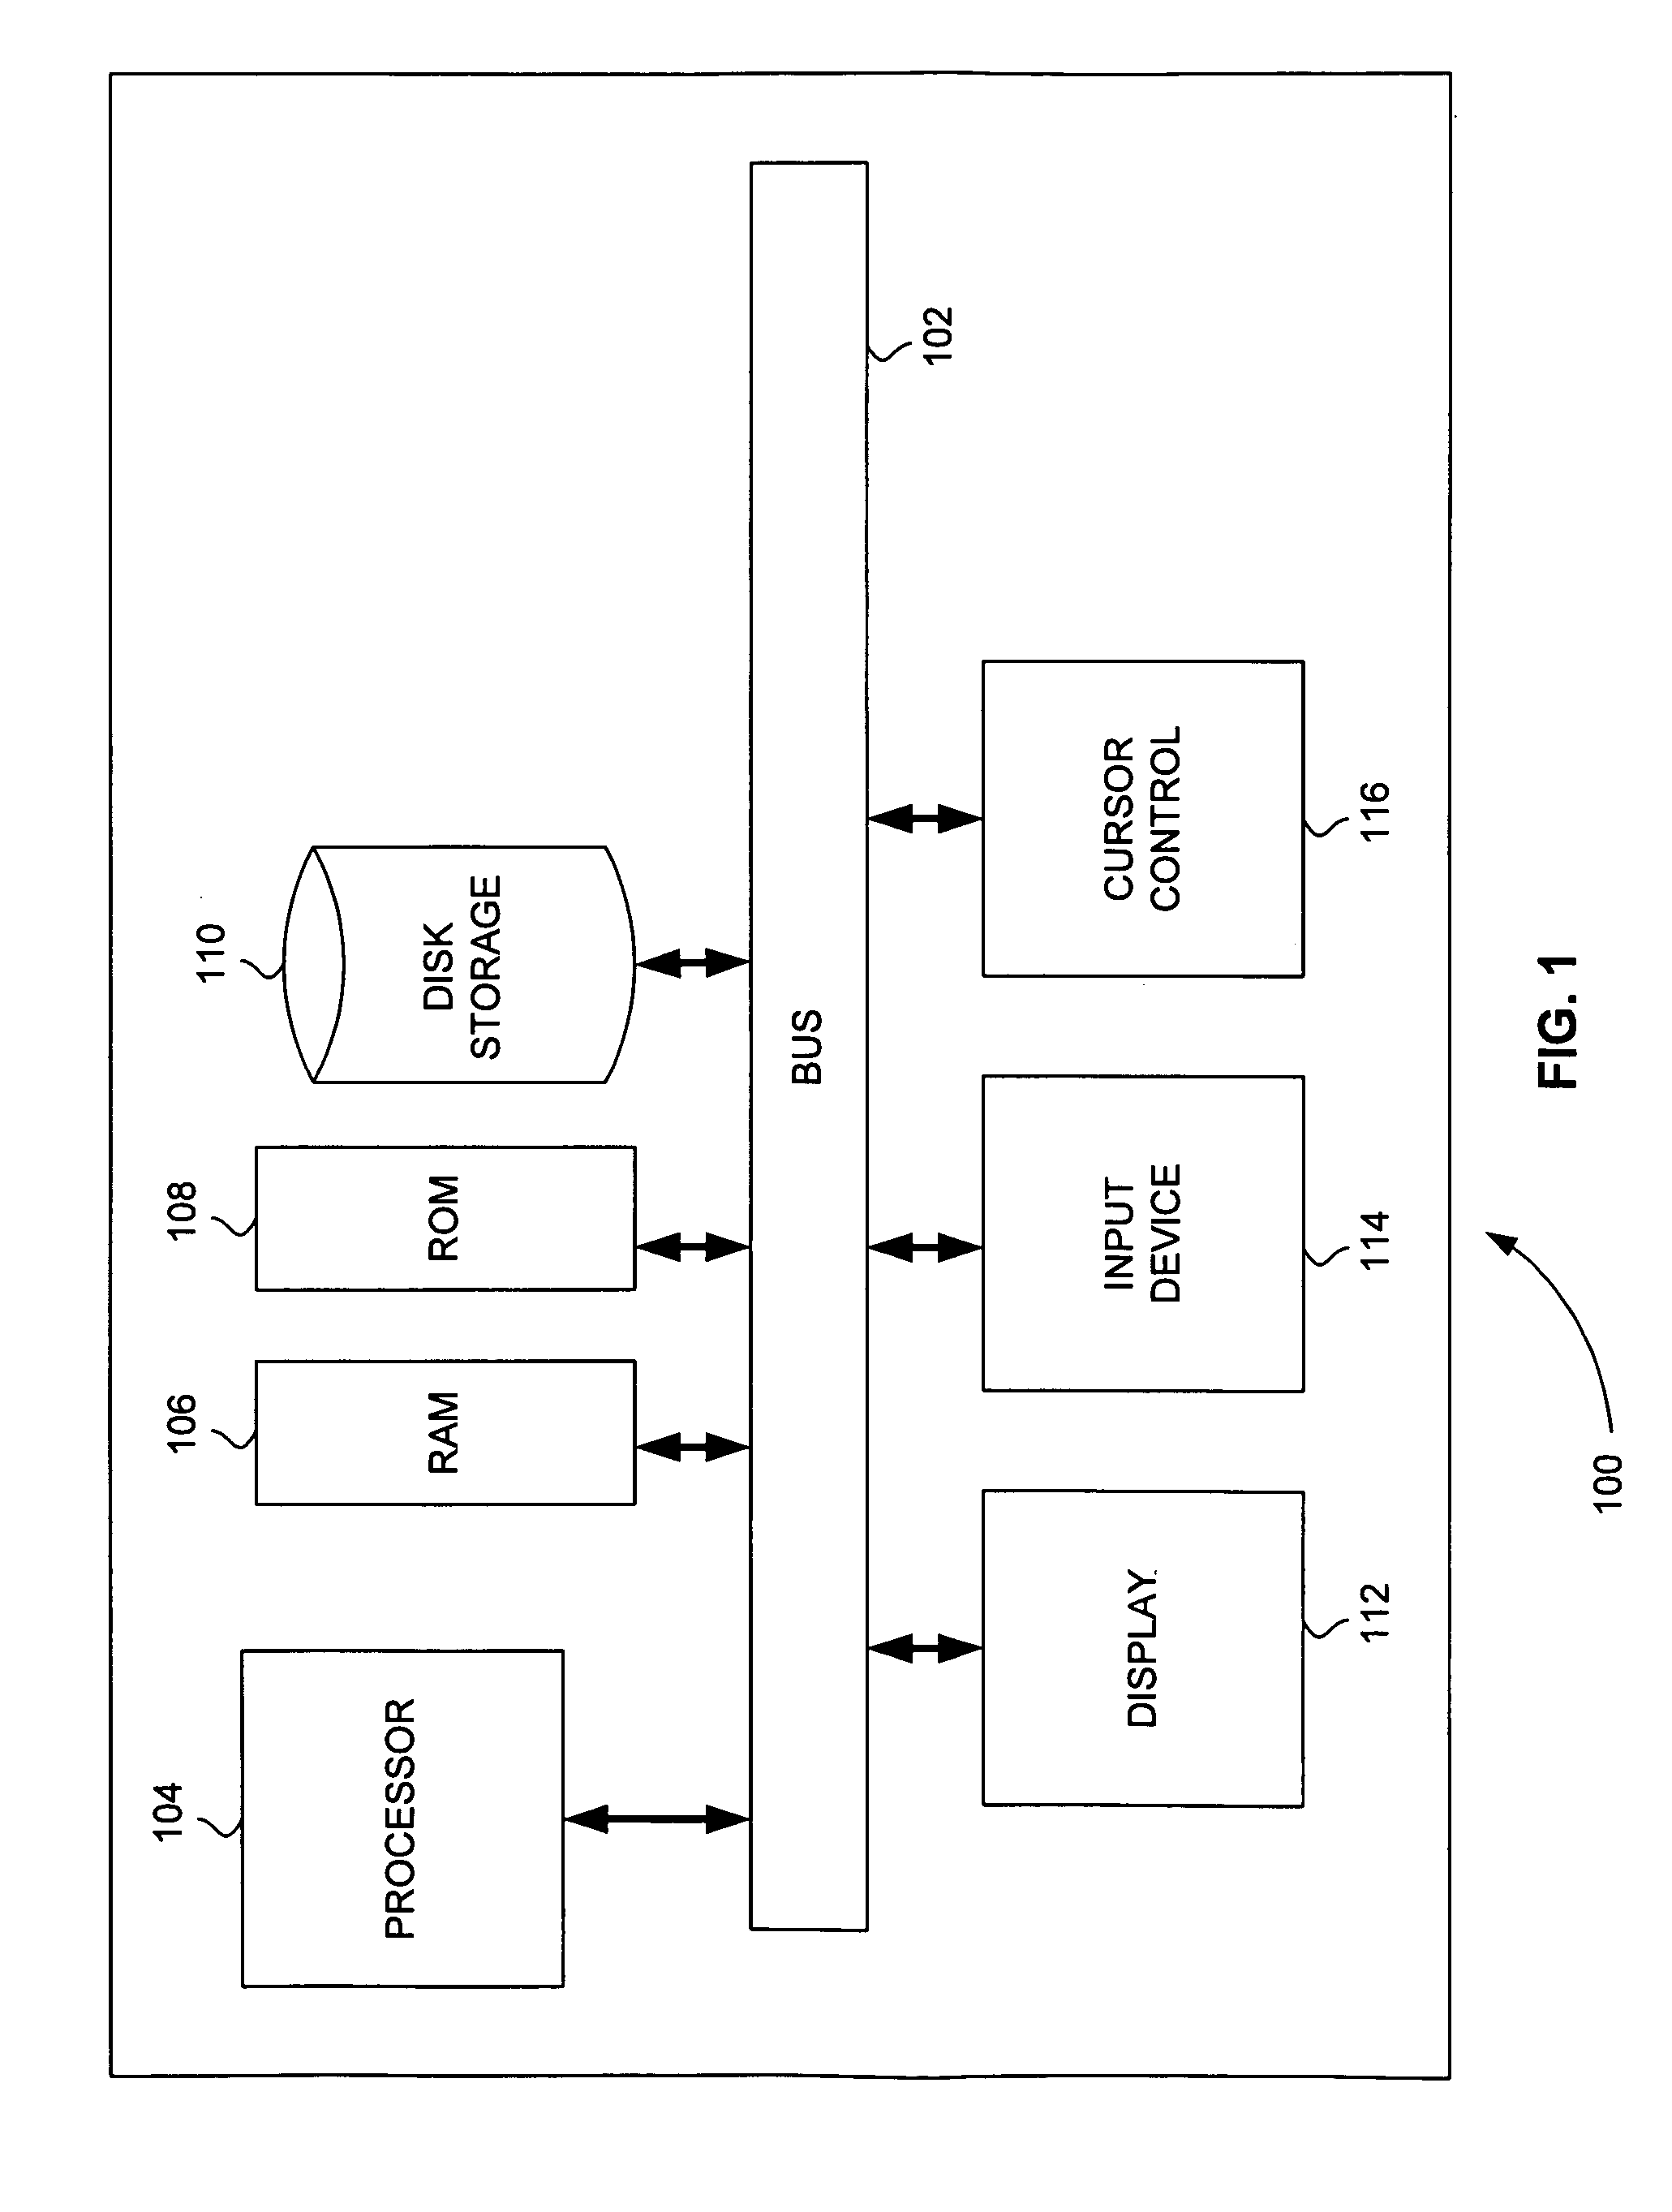
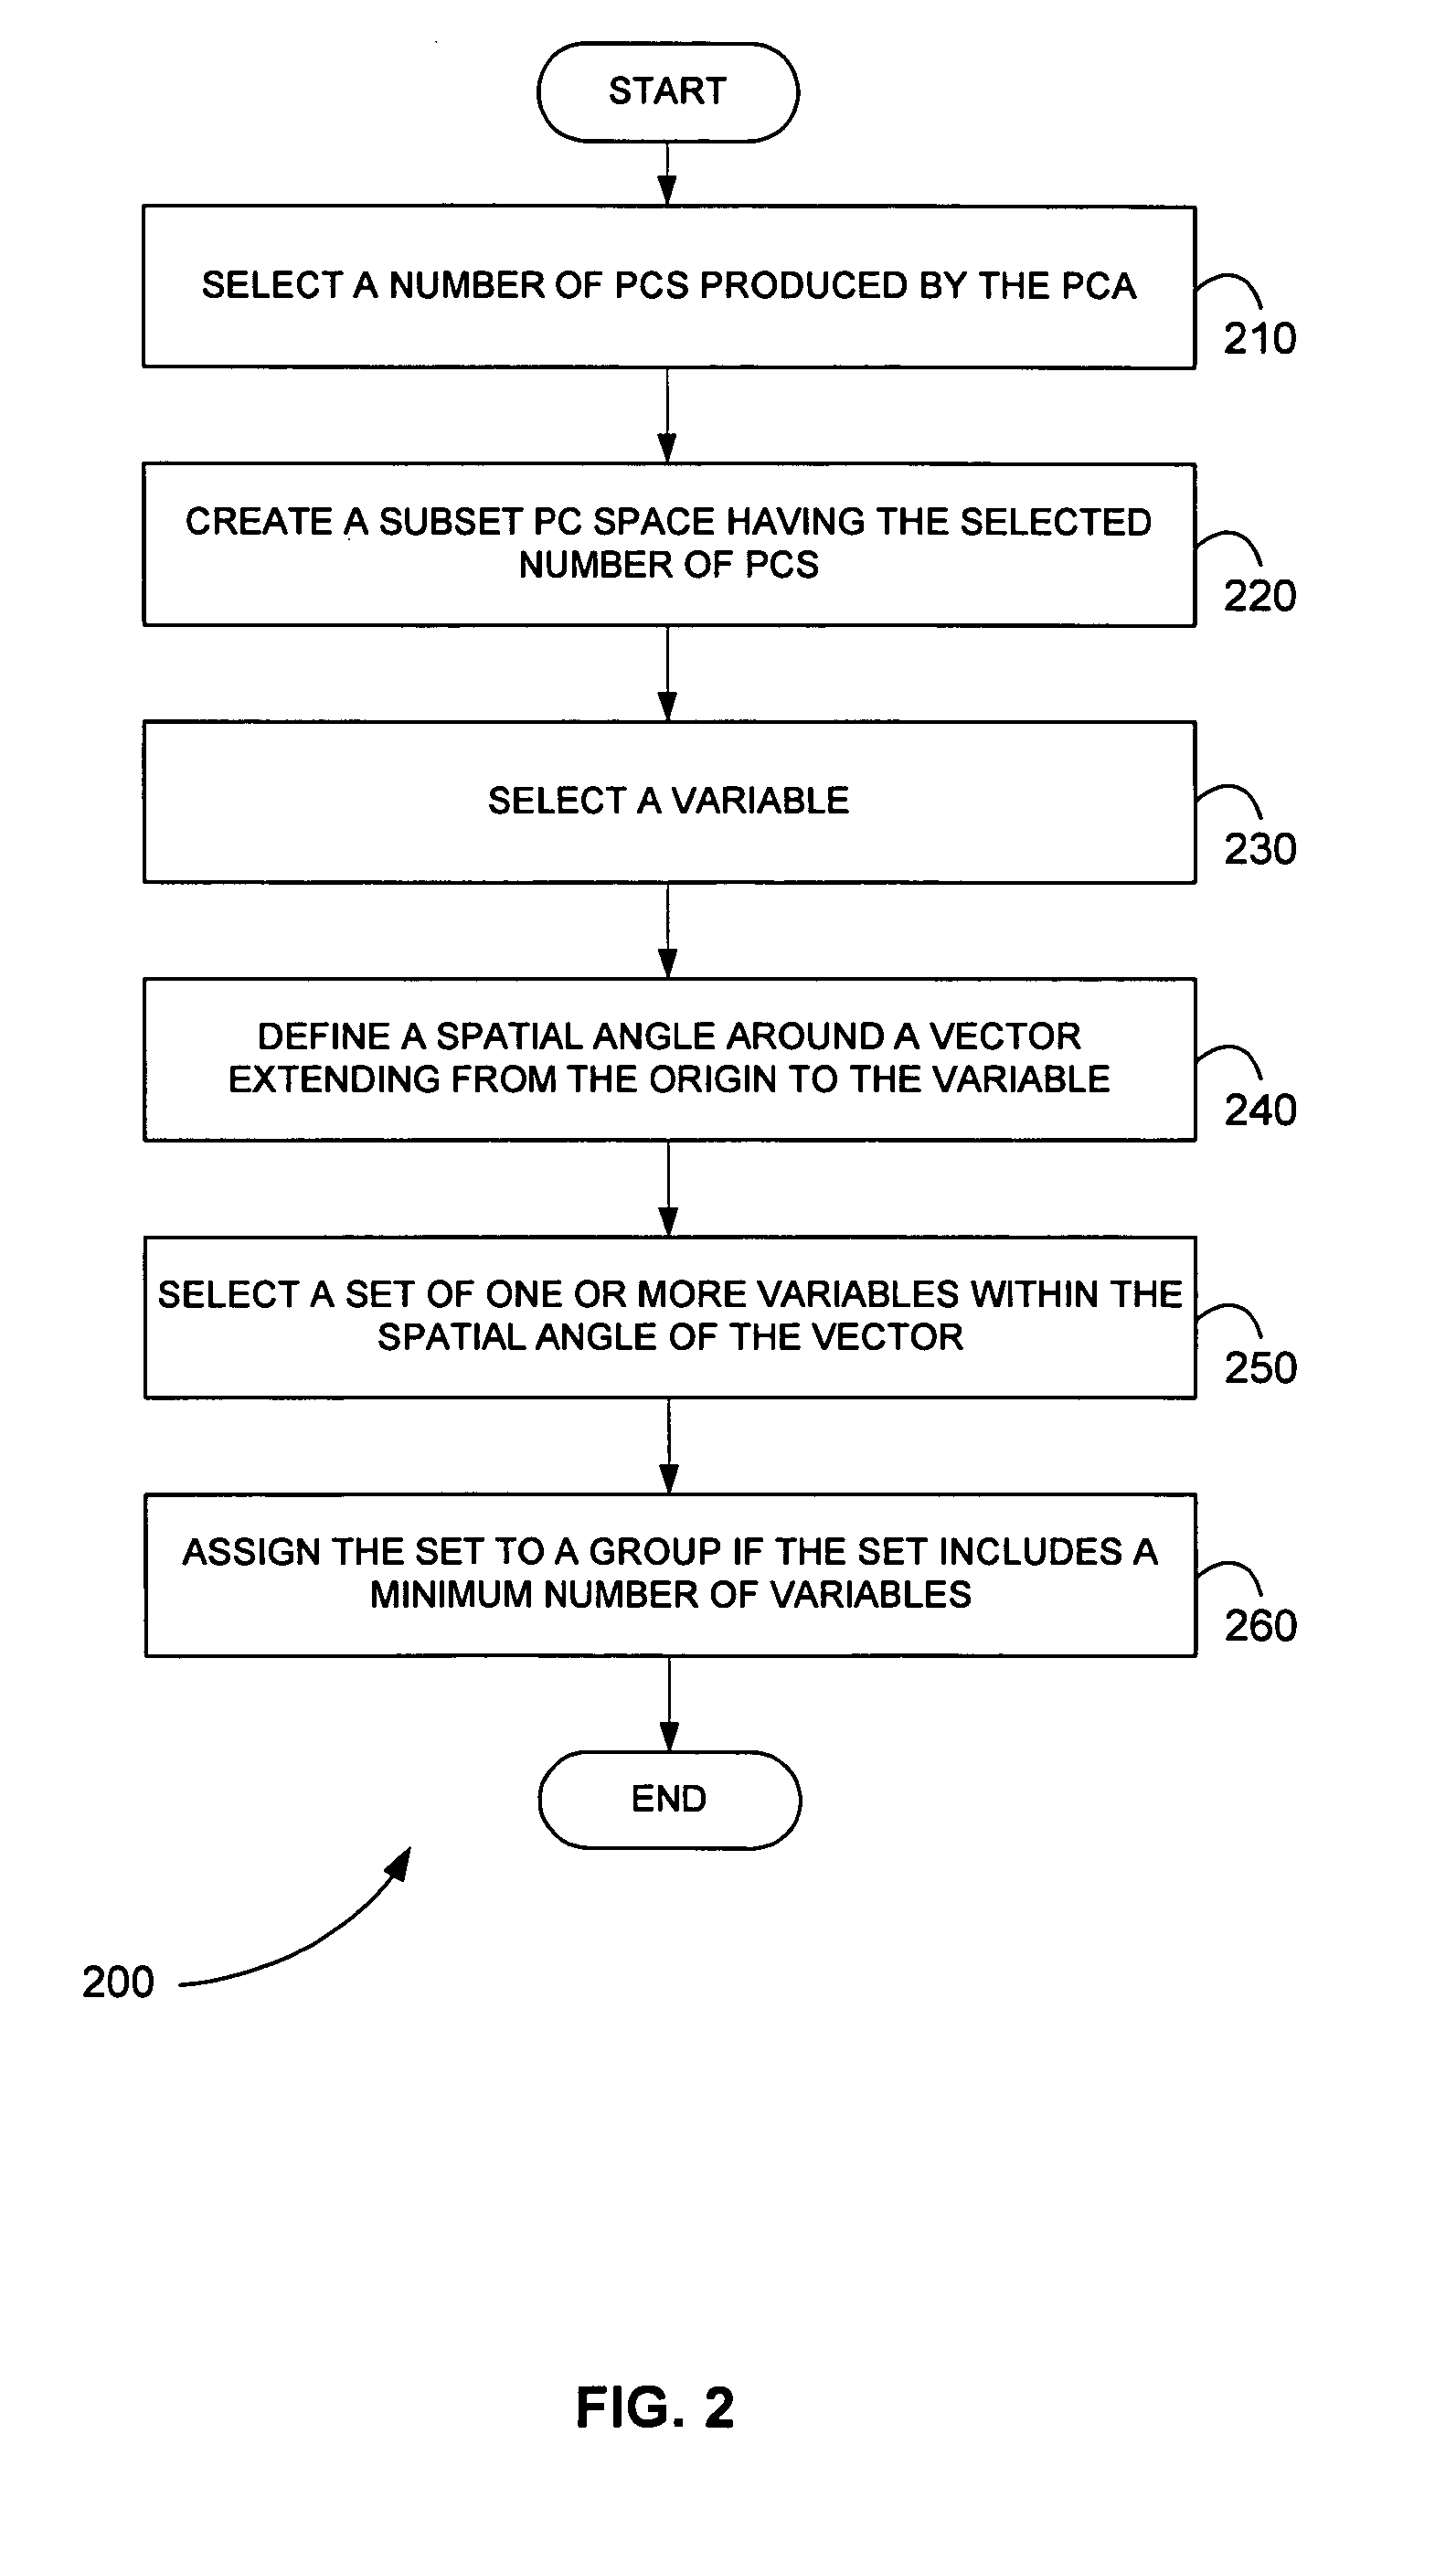
[0021]FIG. 1 is a block diagram that illustrates a computer system 100, upon which embodiments of the present teachings may be implemented. Computer system 100 includes a bus 102 or other communication mechanism for communicating information, and a processor 104 coupled with bus 102 for processing information. Computer system 100 also includes a memory 106, which can be a random access memory (RAM) or other dynamic storage device, coupled to bus 102 for determining base calls, and instructions to be executed by processor 104. Memory 106 also may be used for storing temporary variables or other intermediate information during execution of instructions to be executed by processor 104. Computer system 100 further includes a read only memory (ROM) 108 or other static storage device coupled to bus 102 for storing static information and instructions for processor 104. A storage device 110, such as a magnetic disk or optical disk, is provided and coupled to bus 1...


PUM


Abstract

A method for identifying a convolved peak is described. A plurality of spectra is obtained. A multivariate analysis technique is used to assign data points from the plurality of spectra to a plurality of groups. A peak is selected from the plurality of spectra. If the peak includes data points assigned to two or more groups of the plurality of groups, the peak is identified as a convolved peak. Principal component analysis is one multivariate analysis technique that is used to assign data points. A number of principal components are selected. A subset principal component space is created. A data point in the subset principal component space is selected. A vector is extended from the origin of the subset principal component space to the data point. One or more data points within a spatial angle around the vector are assigned to a group.

Description

CROSS-REFERENCE TO RELATED APPLICATION[0001]This application is a continuation-in-part application of U.S. patent application Ser. No. 11 / 848,717, filed Aug. 31, 2007, now U.S. Pat. No. 7,587,285. This application also claims the benefit of U.S. Provisional Patent Application No. 61 / 057,719 filed May 30, 2008. All of the above mentioned applications are incorporated by reference herein in their entireties.INTRODUCTION[0002]The present teachings can be used for data analysis to determine and interpret correlated variables. For example, multivariate statistical techniques can be applied to mass spectrometry (MS) data for use in biomarker discovery and metabolomics. MS can generate hundreds or thousands of variables, many of which are correlated, which complicates analysis. Although it is common to remove correlated variables prior to principal component analysis (PCA), their identification is valuable in the interpretation of mass spectral data since correlated peaks may be unpredicta...

Claims


Application Information

Patent Timeline
Patent Type & Authority Patents(United States)
IPC IPC(8): G06F17/00G06F17/40
CPCG01N30/8682G06K9/00543H01J49/0036G01N30/72G01N2030/862G06F2218/14
Inventor IVOSEV, GORDANABONNER, RONALD
Owner DH TECH DEVMENT PTE
Why Eureka
Try Eureka