
Method of extracting and searching integral histograms of data samples

a histogram and data technology, applied in the field of data samples, can solve the problems of insufficient search process in real-time, method is extremely fast, etc., and achieve the effect of reducing the number of required operations

Inactive Publication Date: 2008-11-18
MITSUBISHI ELECTRIC RES LAB INC
View PDF13 Cites 20 Cited by
  • Summary
  • Abstract
  • Description
  • Claims
  • Application Information

AI Technical Summary

Benefits of technology

This approach significantly reduces the number of operations required, enabling real-time exhaustive searches and accelerating histogram-based applications by several orders of magnitude, such as object detection in videos, with improvements up to 3.5×10^4 times faster than conventional methods.

Problems solved by technology

The method is extremely fast when compared to conventional approaches.
The method can employ an exhaustive search process in real-time, which has been impractical up to now for most complex vision applications.

Method used


Image

  • Method of extracting and searching integral histograms of data samples
  • Method of extracting and searching integral histograms of data samples
  • Method of extracting and searching integral histograms of data samples

Examples


Embodiment Construction

[0029]Integral Histogram

[0030]An integral histogram according to the invention is extracted from sampled data by a recursive propagation method. The method works in Cartesian spaces. The method can be extended into any dimensional data space and any tensor representations.

[0031]A function ƒ such as x→ƒ(x), is a defined in a d-dimensional real valued Cartesian space , where x=[x1, . . . , xd] are sample points in the space. The function ƒ maps to a k-dimensional tensor, i.e., ƒ(x)=[g1, . . . , gk]. The d-dimensional data space is bounded within a range N1, . . . , Nd, i.e., 0≦xi≦Ni.

[0032]An integral histogram H(x, b) is defined along a scanline of points x0, x1, . . . , such that:

[0033]H⁡(x,b)=⋃p=0x⁢Q⁡(f⁡(p)),(1)

where Q(.) gives the corresponding bin of a current point, and ∪ is the union operator that is defined as follows.

[0034]The value of the bin b of the histogram H(x, b) is equal to the sum of bin values of previously scanned points of the histogram, i.e., the sum of all Q(ƒ(p)...


PUM


Abstract

A computer implemented method extracts an integral histogram from sampled data, such as time series data, images, and volumetric data. First, a set of samples is acquired from a real-world signal. The set of samples is scanned in a predetermined order. For each current sample, an integral histogram integrating a histogram of the current sample and integral histograms of previously scanned samples is constructed.

Description

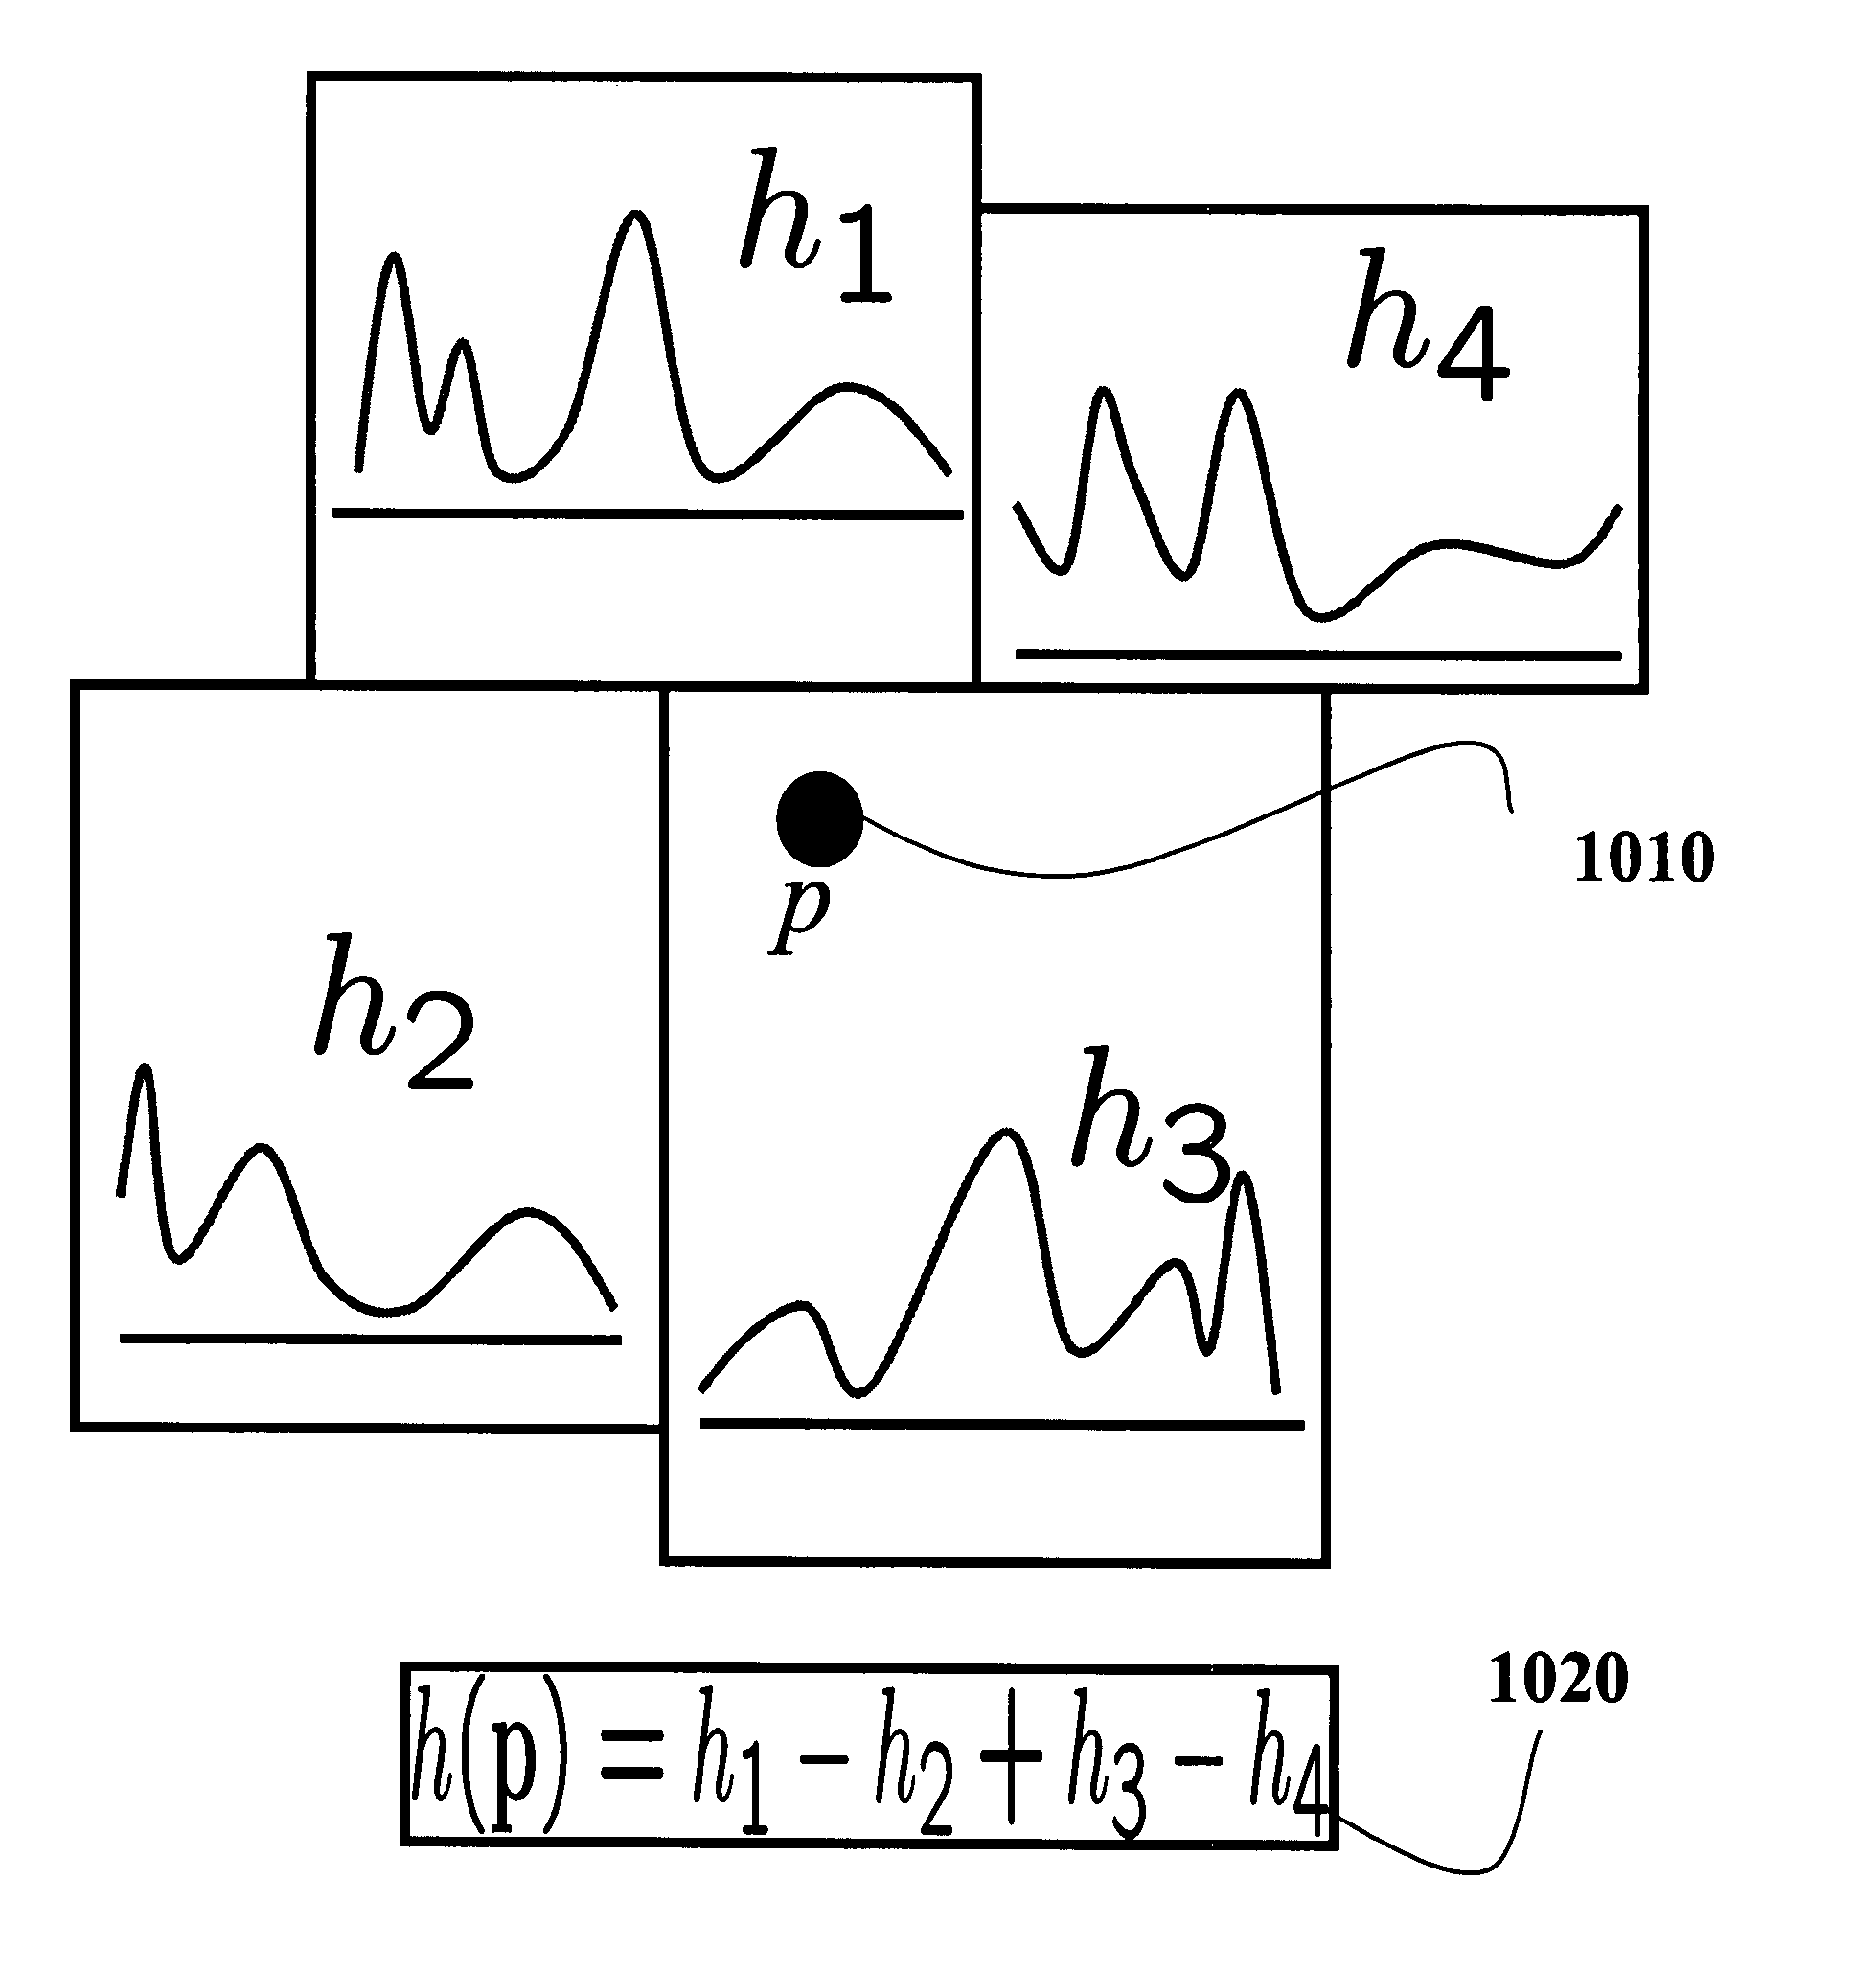
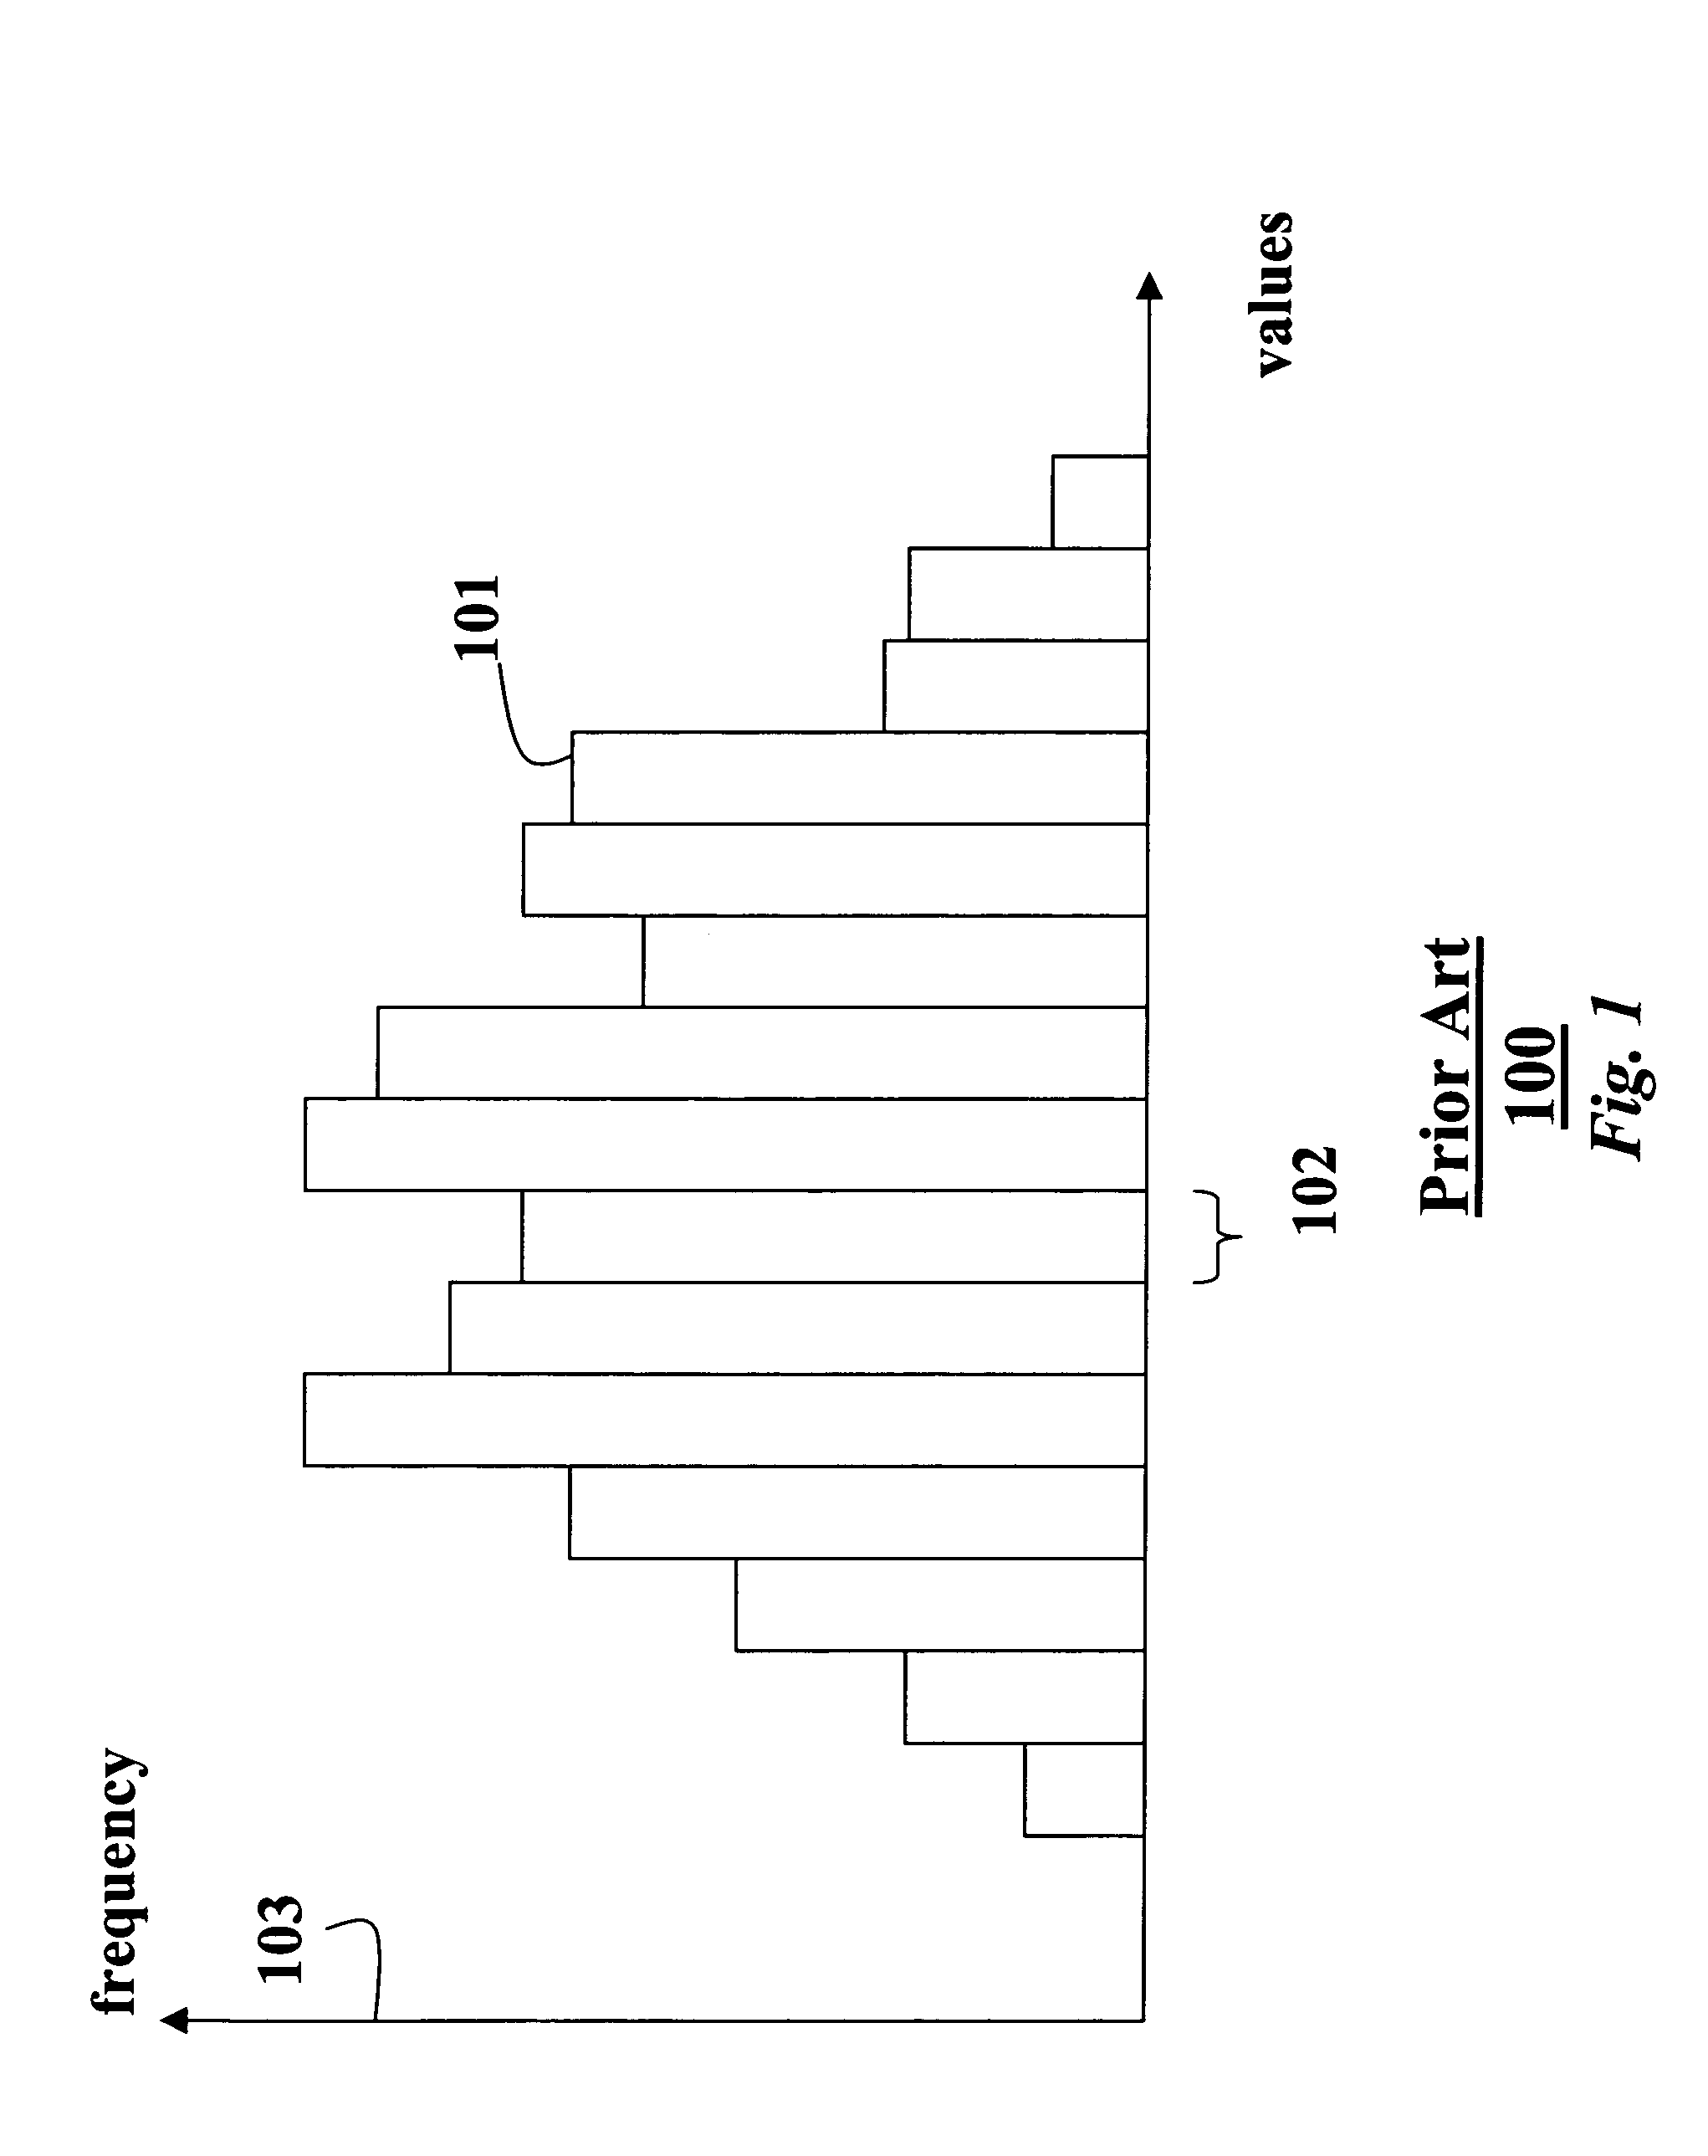
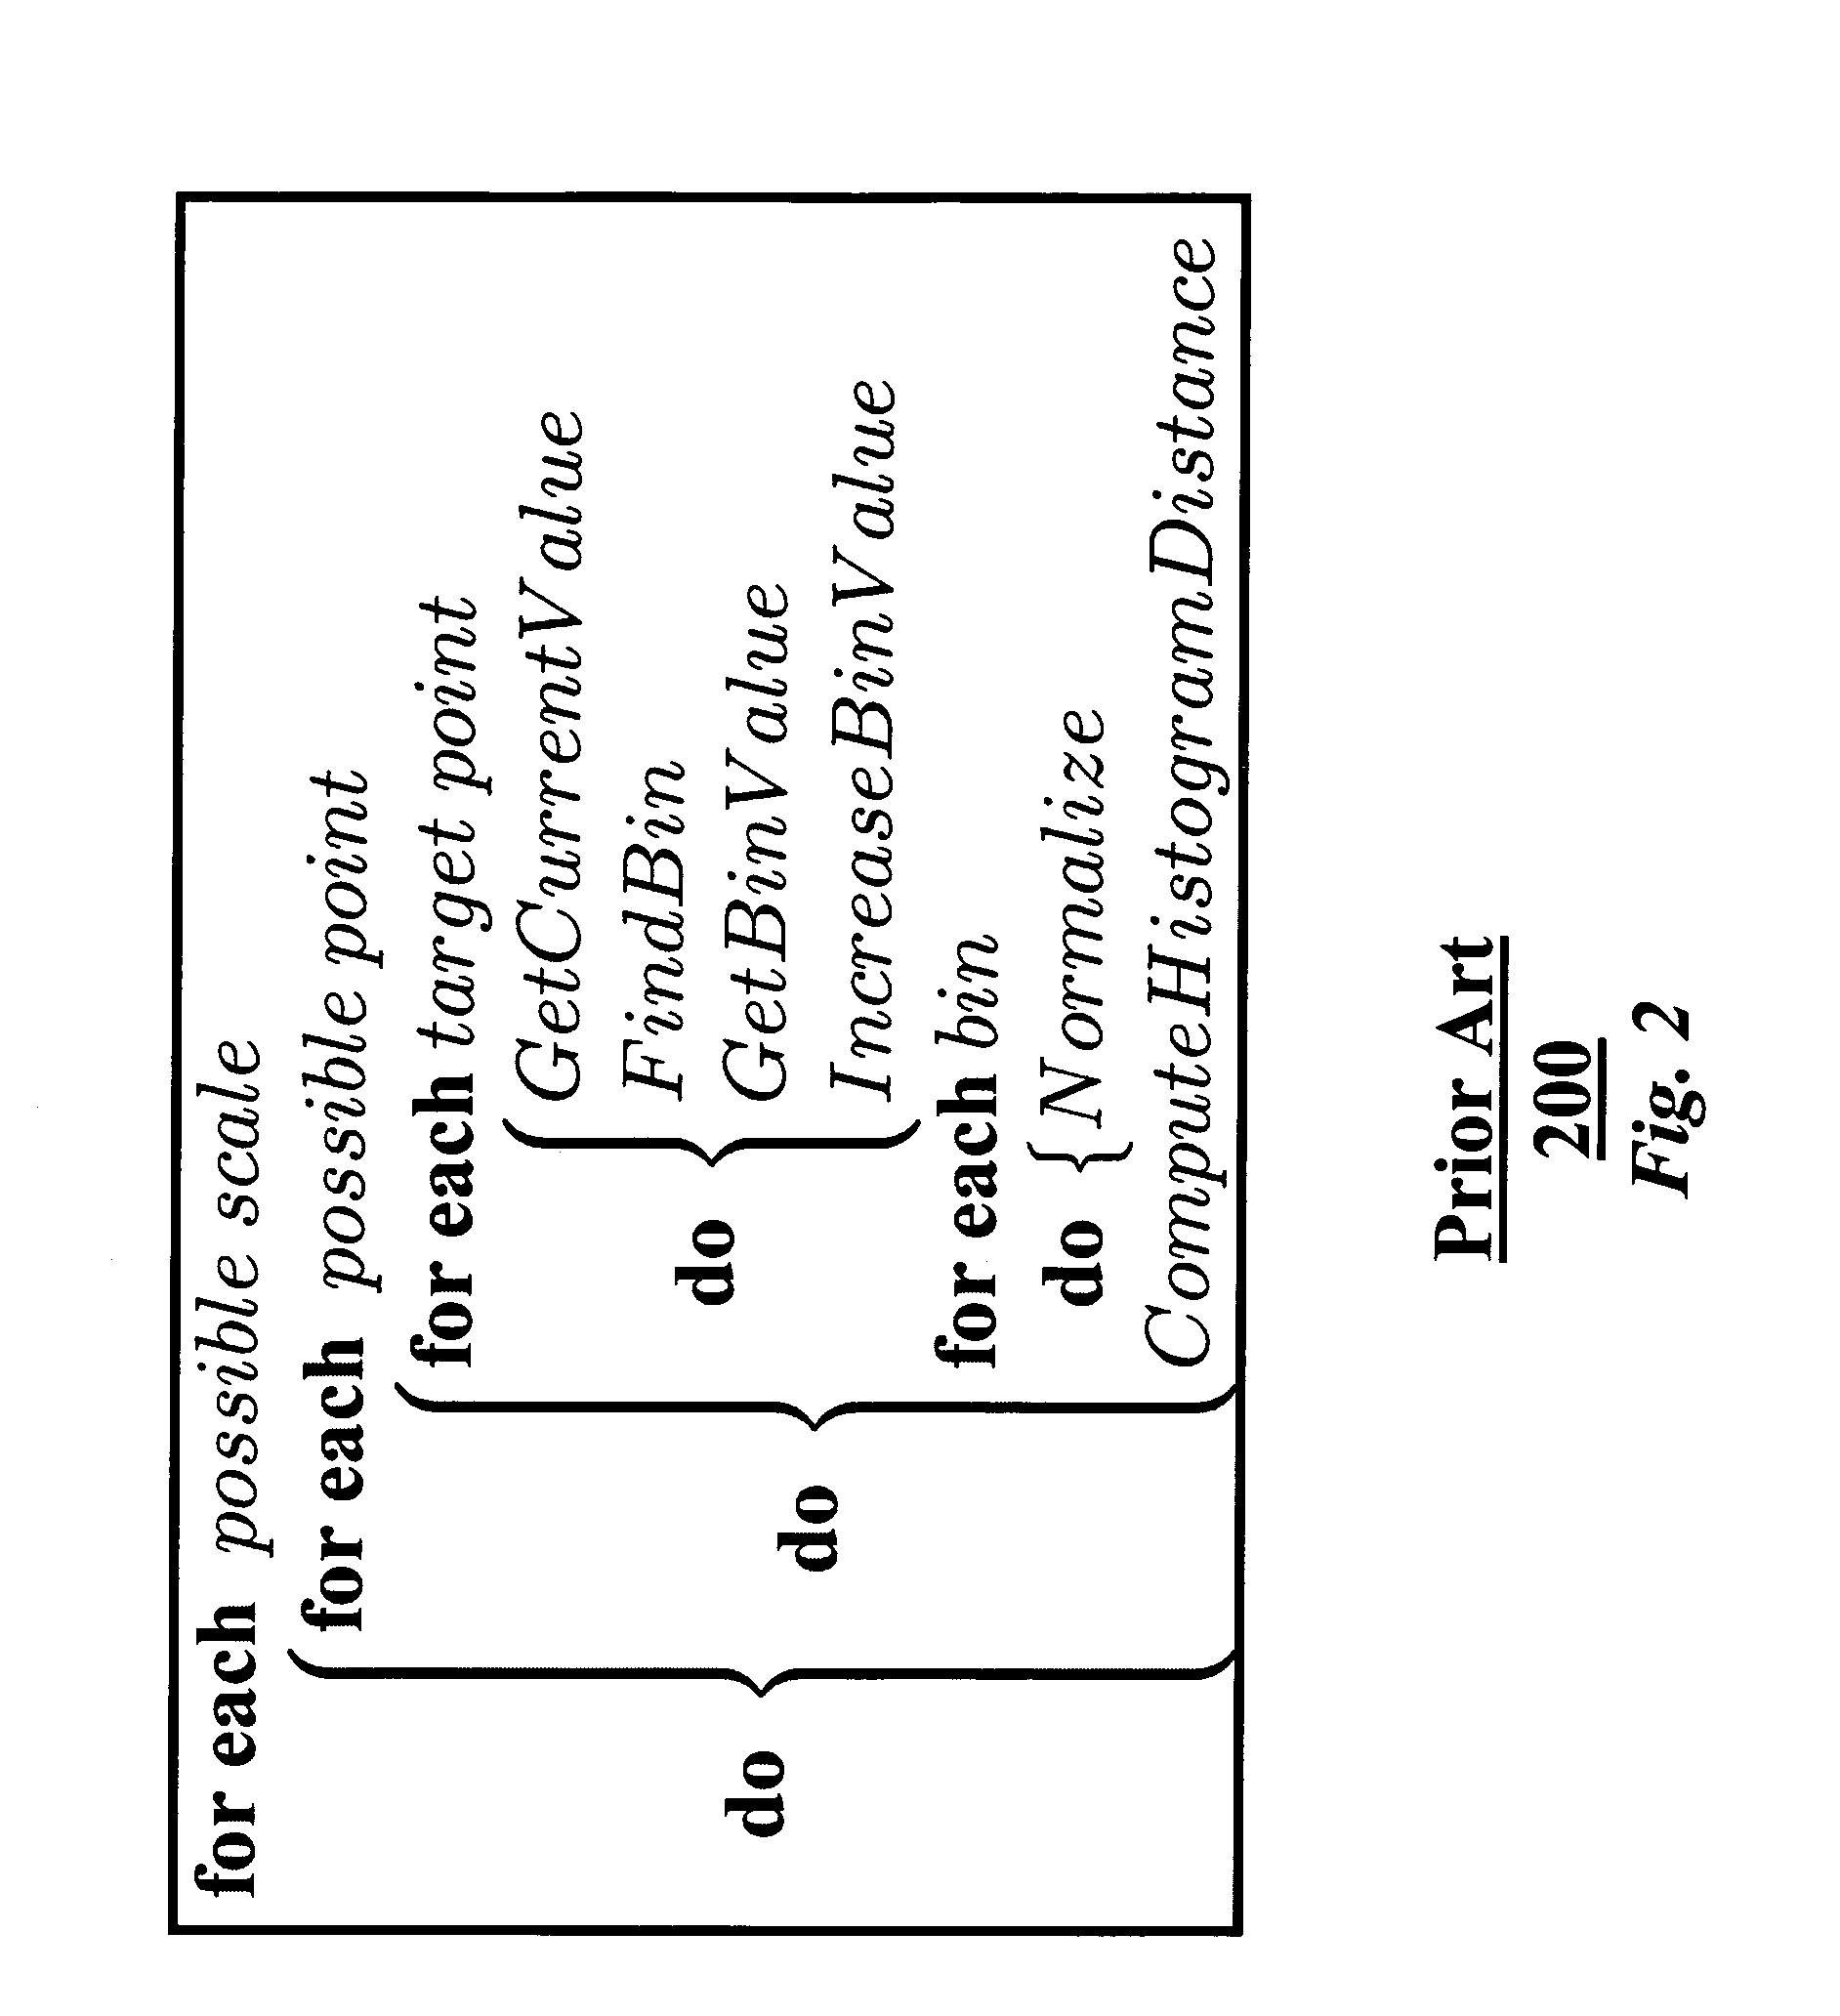
FIELD OF THE INVENTION[0001]The invention relates generally to representing and searching data samples of real-world signals, and more particularly to representing and searching with histograms extracted from the data samples to detect objects.BACKGROUND OF THE INVENTION[0002]As shown in FIG. 1, a histogram 100 is an array of ‘bins’101. Each bin corresponds to a range 102 of values of a sampled data set. The bin ‘counts’ the frequency 103 of occurrences of sample values in a particular range. In other words, the histogram represents a frequency distribution of the samples in the data set.[0003]For example, a histogram of a sampled color image ‘counts’ the number of pixels that have the same color values in each bin. Thus, the histogram is a mapping from the sampled data set to a set of non-negative real numbers +R.[0004]From a probabilistic point of view, a normalization of the histogram results in a discrete function that resembles a probability density function of the data set. Hi...

Claims


Application Information

Patent Timeline
Patent Type & Authority Patents(United States)
IPC IPC(8): G06K9/00G06K9/46G06K9/36G06V10/50
CPCG06F17/18G06K9/4642G06K9/6212G06T7/20G06T2207/10016G06T2207/30201G06V10/50G06V10/758
Inventor PORIKLI, FATIH M.
Owner MITSUBISHI ELECTRIC RES LAB INC
Learn More