Methods and apparatus for displaying diagnostic data

Inactive Publication Date: 2006-11-14
LUMA IMAGING CORP
View PDF363 Cites 221 Cited by
  • Summary
  • Abstract
  • Description
  • Claims
  • Application Information

AI Technical Summary

Benefits of technology

[0010]The invention provides methods for displaying diagnostic results obtained from a tissue sample. In general, the invention assigns tissue-class probability values to discrete regions of a patient sample, and creates an overlay for displaying the results. One feature of the overlay is that it facilitates display of the tissue class probabilities in a way that reflects the diagnostic relevance of the data. For example, methods of the invention comprise applying filtering and color-blending techniques in order to facilitate display of diagnostic results. Those techniques enhance certain portions of the overlay in order to highlight diagnostically-relevant regions of the sample.
[0013]Systems of the invention allow performing fast and accurate image and spectral scans of tissue, such that both image and spectral data are obtained from each of a plurality of regions of the tissue sample. Each data point is keyed to its respective region, and the data are used to determine tissue-class probabilities for regions of interest, as well as to identify indeterminate regions. These systems allow real-time display of diagnostic results during a patient examination. For example, data may be obtained from an in vivo tissue sample, and results of a tissue classification algorithm may be displayed either during or immediately following the examination. This provides a medical professional with nearly instantaneous, feedback which may be quickly comprehended and used for continued or follow-up examination. In some cases, the display is prepared within seconds of obtaining data from the tissue. In other cases, the display is ready within a matter of minutes or a matter of one or more hours after obtaining data from the tissue.

Problems solved by technology

However, direct visual observation alone may be inadequate for proper identification of an abnormal tissue sample, particularly in the early stages of disease.
Colposcopic techniques are not perfect.
Colposcopic images may contain complex and confusing patterns and may be affected by glare, shadow, or the presence of blood or other obstruction, rendering an indeterminate diagnosis.
However, examinations using spectral analysis may be adversely affected by glare, shadow, or the presence of blood or other obstruction, rendering an indeterminate diagnosis.
Some artifacts may not be detectable by analysis of the spectral data alone; hence, erroneous spectral data may be inseparable from valid spectral data.
Also, the surface of a tissue sample under spectral examination is generally not homogeneous.
Areas of disease may be interspersed among neighboring healthy tissue, rendering overly-diffuse spectral data erroneous.
Furthermore, current methods of displaying data based on tissue classification algorithms do not facilitate quick, accurate, or clear communication of diagnostic results.
Current techniques generally require interpretation by a skilled medical professional for meaningful and accurate conveyance of diagnostic information, due, in part, to the unfiltered nature of the diagnostic data.

Method used


Image

  • Methods and apparatus for displaying diagnostic data
  • Methods and apparatus for displaying diagnostic data
  • Methods and apparatus for displaying diagnostic data

Examples


Embodiment Construction

[0162]

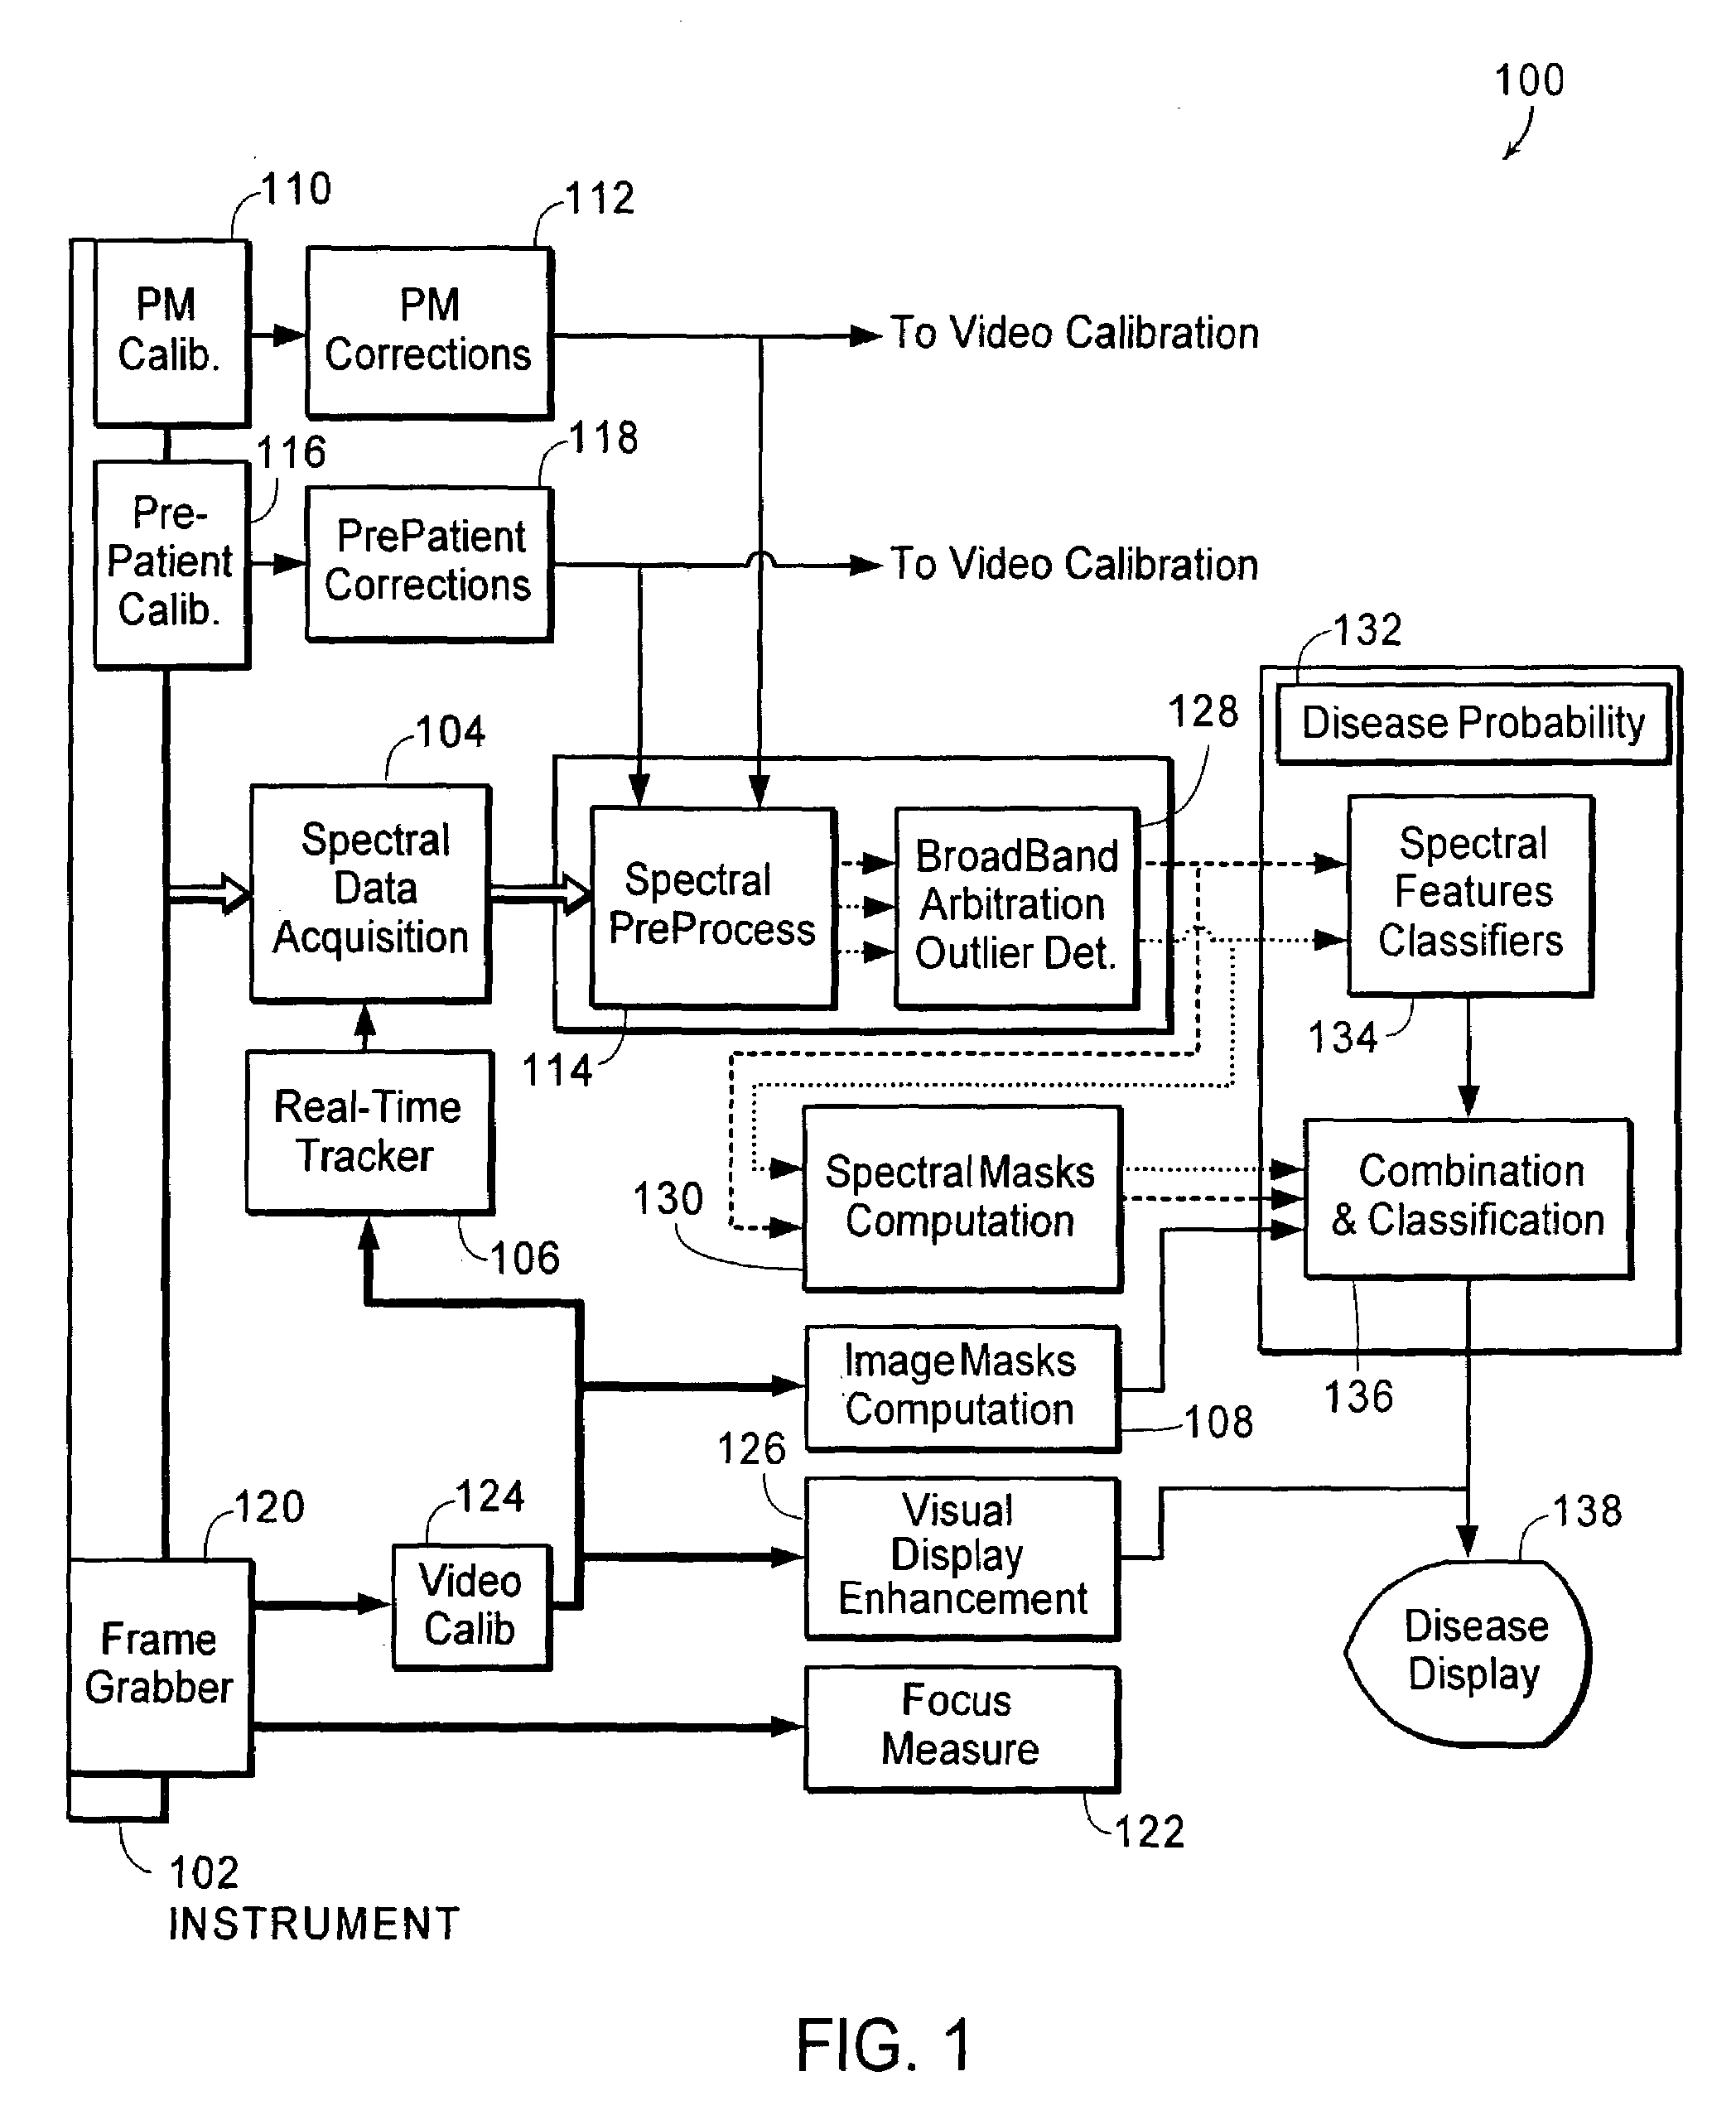
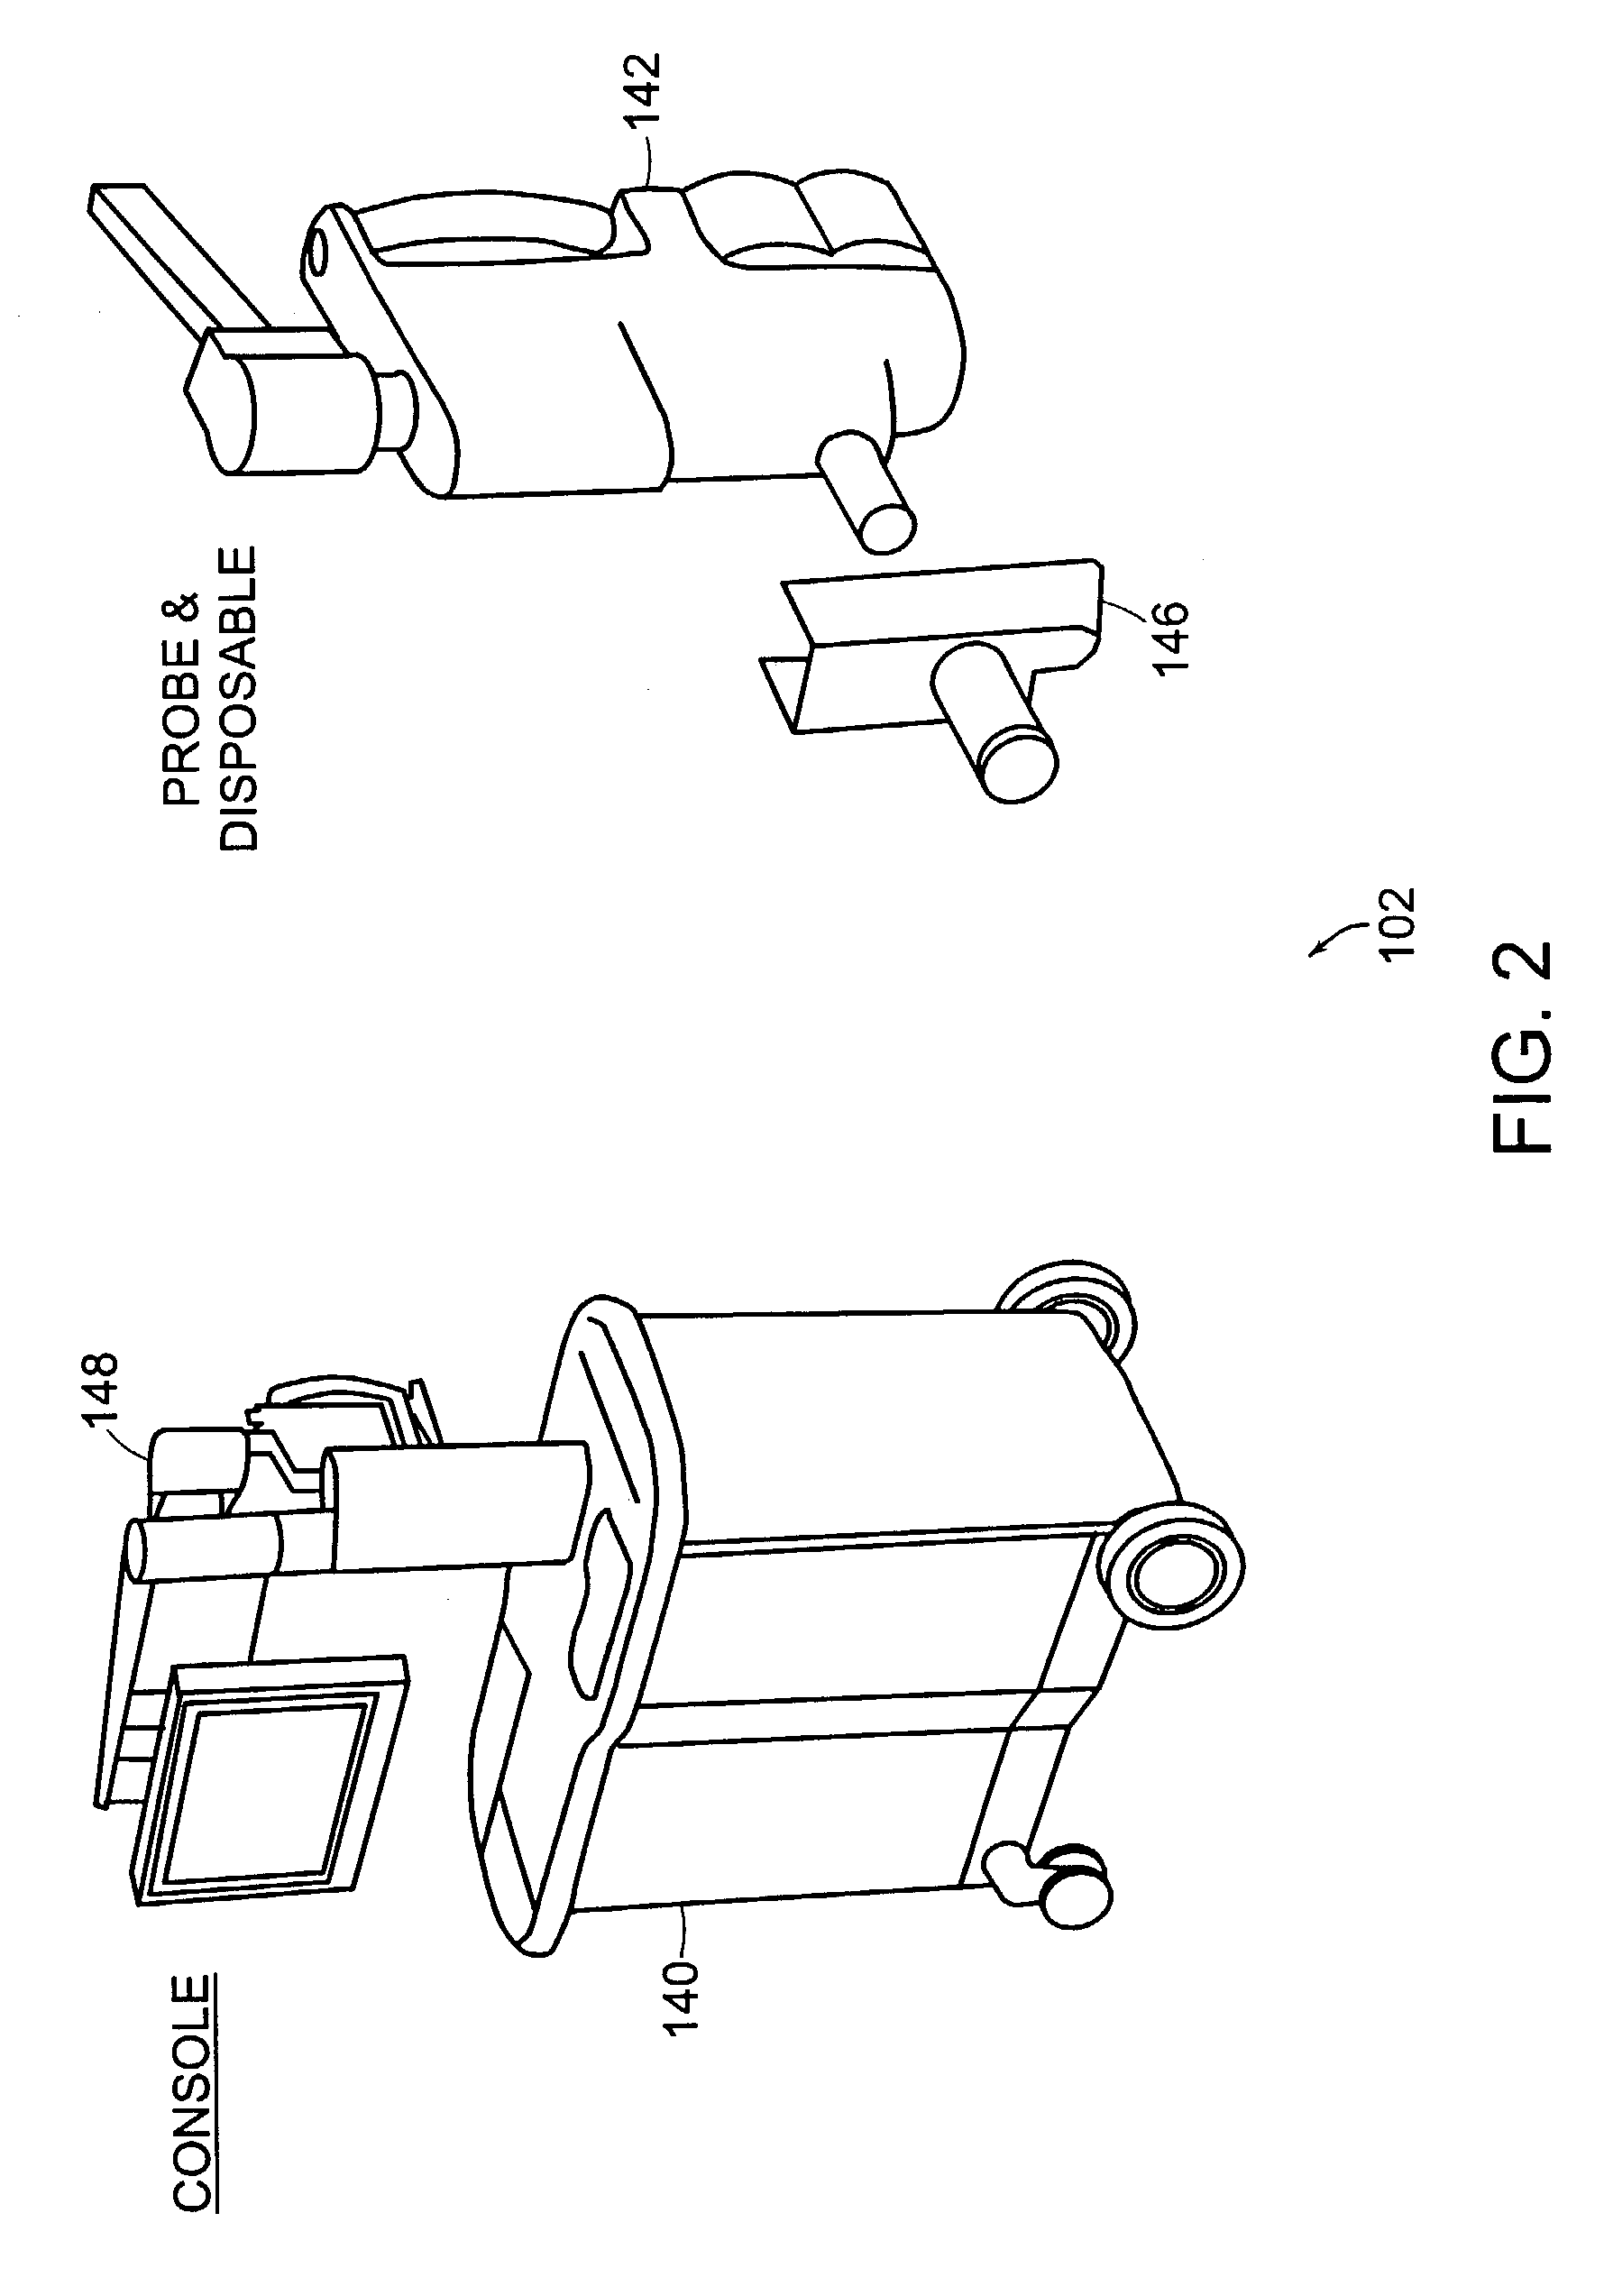
Table of ContentsPageSystem overview30Instrument35Spectral calibration49Patient scan procedure97Video calibration and focusing100Determining optimal data acquisition window112Motion tracking129Broadband reflectance arbitration and low-signal masking156Classification system overview179Spectral masking184Image masking196Glarevid202[ROI]vid206[ST]vid207Osvid215Bloodvid219Mucusvid224[SP]vid228[VW]vid240[FL]vid253Classifiers262Combining spectral and image data273Image enhancement282Diagnostic display288

[0163]The Table of Contents above is provided as a general organizational guide to the Description of the Illustrative Embodiment. Entries in the Table do not serve to limit support for any given element of the invention to a particular section of the Description.

System 100 Overview

[0164]The invention provides systems and methods for obtaining spectral data and image data from a tissue sample, for processing the data, and for using the data to diagnose the tissue sample. As used here...


PUM


Abstract

The invention provides methods for displaying diagnostic results obtained from a tissue sample. In general, the invention assigns tissue-class probability values to discrete regions of a patient sample, and creates an overlay for displaying the results. The overlay facilitates display of the tissue class probabilities in a way that reflects the diagnostic relevance of the data. For example, methods of the invention comprise applying filtering and color-blending techniques in order to facilitate display of diagnostic results.

Description

PRIOR APPLICATIONS[0001]This application is related to the following commonly-owned applications: Ser. No. 10 / 418,922, entitled, “Methods and Apparatus for Characterization of Tissue Samples”; Ser. No. 10 / 418,974, entitled, “Methods and Apparatus for Visually Enhancing Images”; Ser. No. 10 / 418,668, entitled, “Methods and Apparatus for Characterization of Tissue Samples”; Ser. No. 10 / 418,975, entitled, “Methods and Apparatus for Processing Image Data for Use in Tissue Characterization”; Ser. No. 10 / 418,415, entitled, “Methods and Apparatus for Processing Spectral Data for Use in Tissue Characterization”; Ser. No. 10 / 419,181, entitled, “Methods and Apparatus for Evaluating Image Focus”; and Ser. No. 10 / 418,973, entitled, “Methods and Apparatus for Calibrating Spectral Data,” all of which are filed on even date herewith.FIELD OF THE INVENTION[0002]This invention relates generally to data display methods. More particularly, in certain embodiments, the invention relates to the display of...

Claims


Application Information

Patent Timeline
IPC IPC(8): G06K9/00G06K9/62G09G5/00A61B5/00G01N21/27G01N21/31
CPCA61B5/0059G01N21/274G01N21/31G06T7/2013G06T11/206A61B5/7264A61B5/7257G06T2207/10016G06T2207/10068G06T2207/30024A61B5/7267G06T7/223G16H50/20G06V20/698
Inventor GRIFFIN, CHRISTOPHER E.JIANG, CHUNSHENGSCHOTT, JEAN-PIERRESCHOMACKER, KEVIN T.FLEWELLING, ROSS F.ABELE, CHARLES C.
Owner LUMA IMAGING CORP
Why Eureka
Try Eureka