System and method for automatic placement of labels for interactive graphics applications

Inactive Publication Date: 2006-10-31
RAYTHEON CO
View PDF16 Cites 92 Cited by
  • Summary
  • Abstract
  • Description
  • Claims
  • Application Information

AI Technical Summary

Benefits of technology

[0018]In another refinement, the new display coordinates are calculated according to a stochastic method. In another refinement, the new display coordinates are calculated according to a heuristic method. In yet another refinement, the means for moving further comprises a means for interpolating a plurality of intermediate display coordinates between the existing display coordinates and the new display coordinates, and a means for sequentially placing the labels at each of the intermediate display coordinates before placing the labels at the new display coordinates, thereby smoothing the movements of the labels on the display.

Problems solved by technology

This can cause the information presented to become very difficult to read.
In certain circumstances, overlap problems become so severe that the controllers cannot read the labels or other features on the display.
This step requires additional work on the user's part and is, in fact, not even a practical solution in the case of a three-dimensional perspective graphical display, where changing the viewpoint causes large changes in the spatial relationship of the displayed graphical objects.
The problem of how to reposition labels to alleviate the forgoing problems may appear intuitively simple at first, but it is actually quite difficult.
That means that for large problems it is not possible (within the current understanding of computer systems) to generate a system that can find the optimal solution to the problem in a reasonable amount of time.
Previous automated label placement schemes do exist, however, all have limitations that result in them being less effective than is needed and desired.
In addition to the air traffic control systems, object label placement on computer graphical displays can be problematic in other applications as well.
For example, similar labeling problems occur in command and control displays, which show the location of friendly and enemy units on two-dimensional or three-dimensional displays.
The object label placement problem for computer graphics applications is closely related to placement problems for static displays, such as maps.
In fact, label placement problems have proven to be NP-hard.
Clearly, this is far too many to evaluate in any reasonable time frame given the current state of computational technologies.
Thus, an NP-hard problem means that there is no way to sufficiently prune this search space to avoid exponential growth caused by the combinatorics of the problem.
That takes up space that is no longer available for any other label.
Thus, decisions made early on in the label placement process can have ramifications much later in the placement process.
The problem grows exponentially as the number of aircraft and possible label positions increase.
They are effective only on a small data set and are known to be less practical than greedy search algorithms.
Greedy algorithms do not guarantee an optimal solution, however, finish in a practical amount of time by limiting the search space.
Greedy algorithms in general have trouble escaping from local minima.
Local minima are effectively non-optimal solutions that require repositioning large numbers of labels simultaneously to overcome the dangers associated with the solution.
Thus, the problem becomes finding a ‘good enough’ solution within the available time.
Simulated annealing is not an appropriate solution for the interactive computer graphics application.
The computation time required is too large to support in an interactive application, and it does not give any consideration to the cognitive distraction potentially caused by the solution.
In practice, force-based methods perform poorly respecting the label placement problem.
They are vulnerable to getting stuck in local minima, even in simple cases.
For example, when two aircraft cross paths, their associated labels can get stuck on the opposite sides because the repulsive forces prevent them from crossing paths.
Force-based schemes also perform poorly in the area of minimizing cognitive distractions.
Labels stuck in between other labels or objects are jostled about; resulting in oscillations and wiggling that attract unwarranted user attention.
However, it is very susceptible to local minima, and in practice the labels placed according to these solutions tend to oscillate.

Method used


Image

  • System and method for automatic placement of labels for interactive graphics applications
  • System and method for automatic placement of labels for interactive graphics applications
  • System and method for automatic placement of labels for interactive graphics applications

Examples


Embodiment Construction

[0030]Illustrative embodiments and exemplary applications will now be described with reference to the accompanying drawings to disclose the advantageous teachings of the present invention. While the present invention is described herein with reference to illustrative embodiments for particular applications, it should be understood that the invention is not limited thereto. Those having ordinary skill in the art and access to the teachings provided herein will recognize additional modifications, applications, and embodiments within the scope thereof and additional fields in which the present invention would be of significant utility.

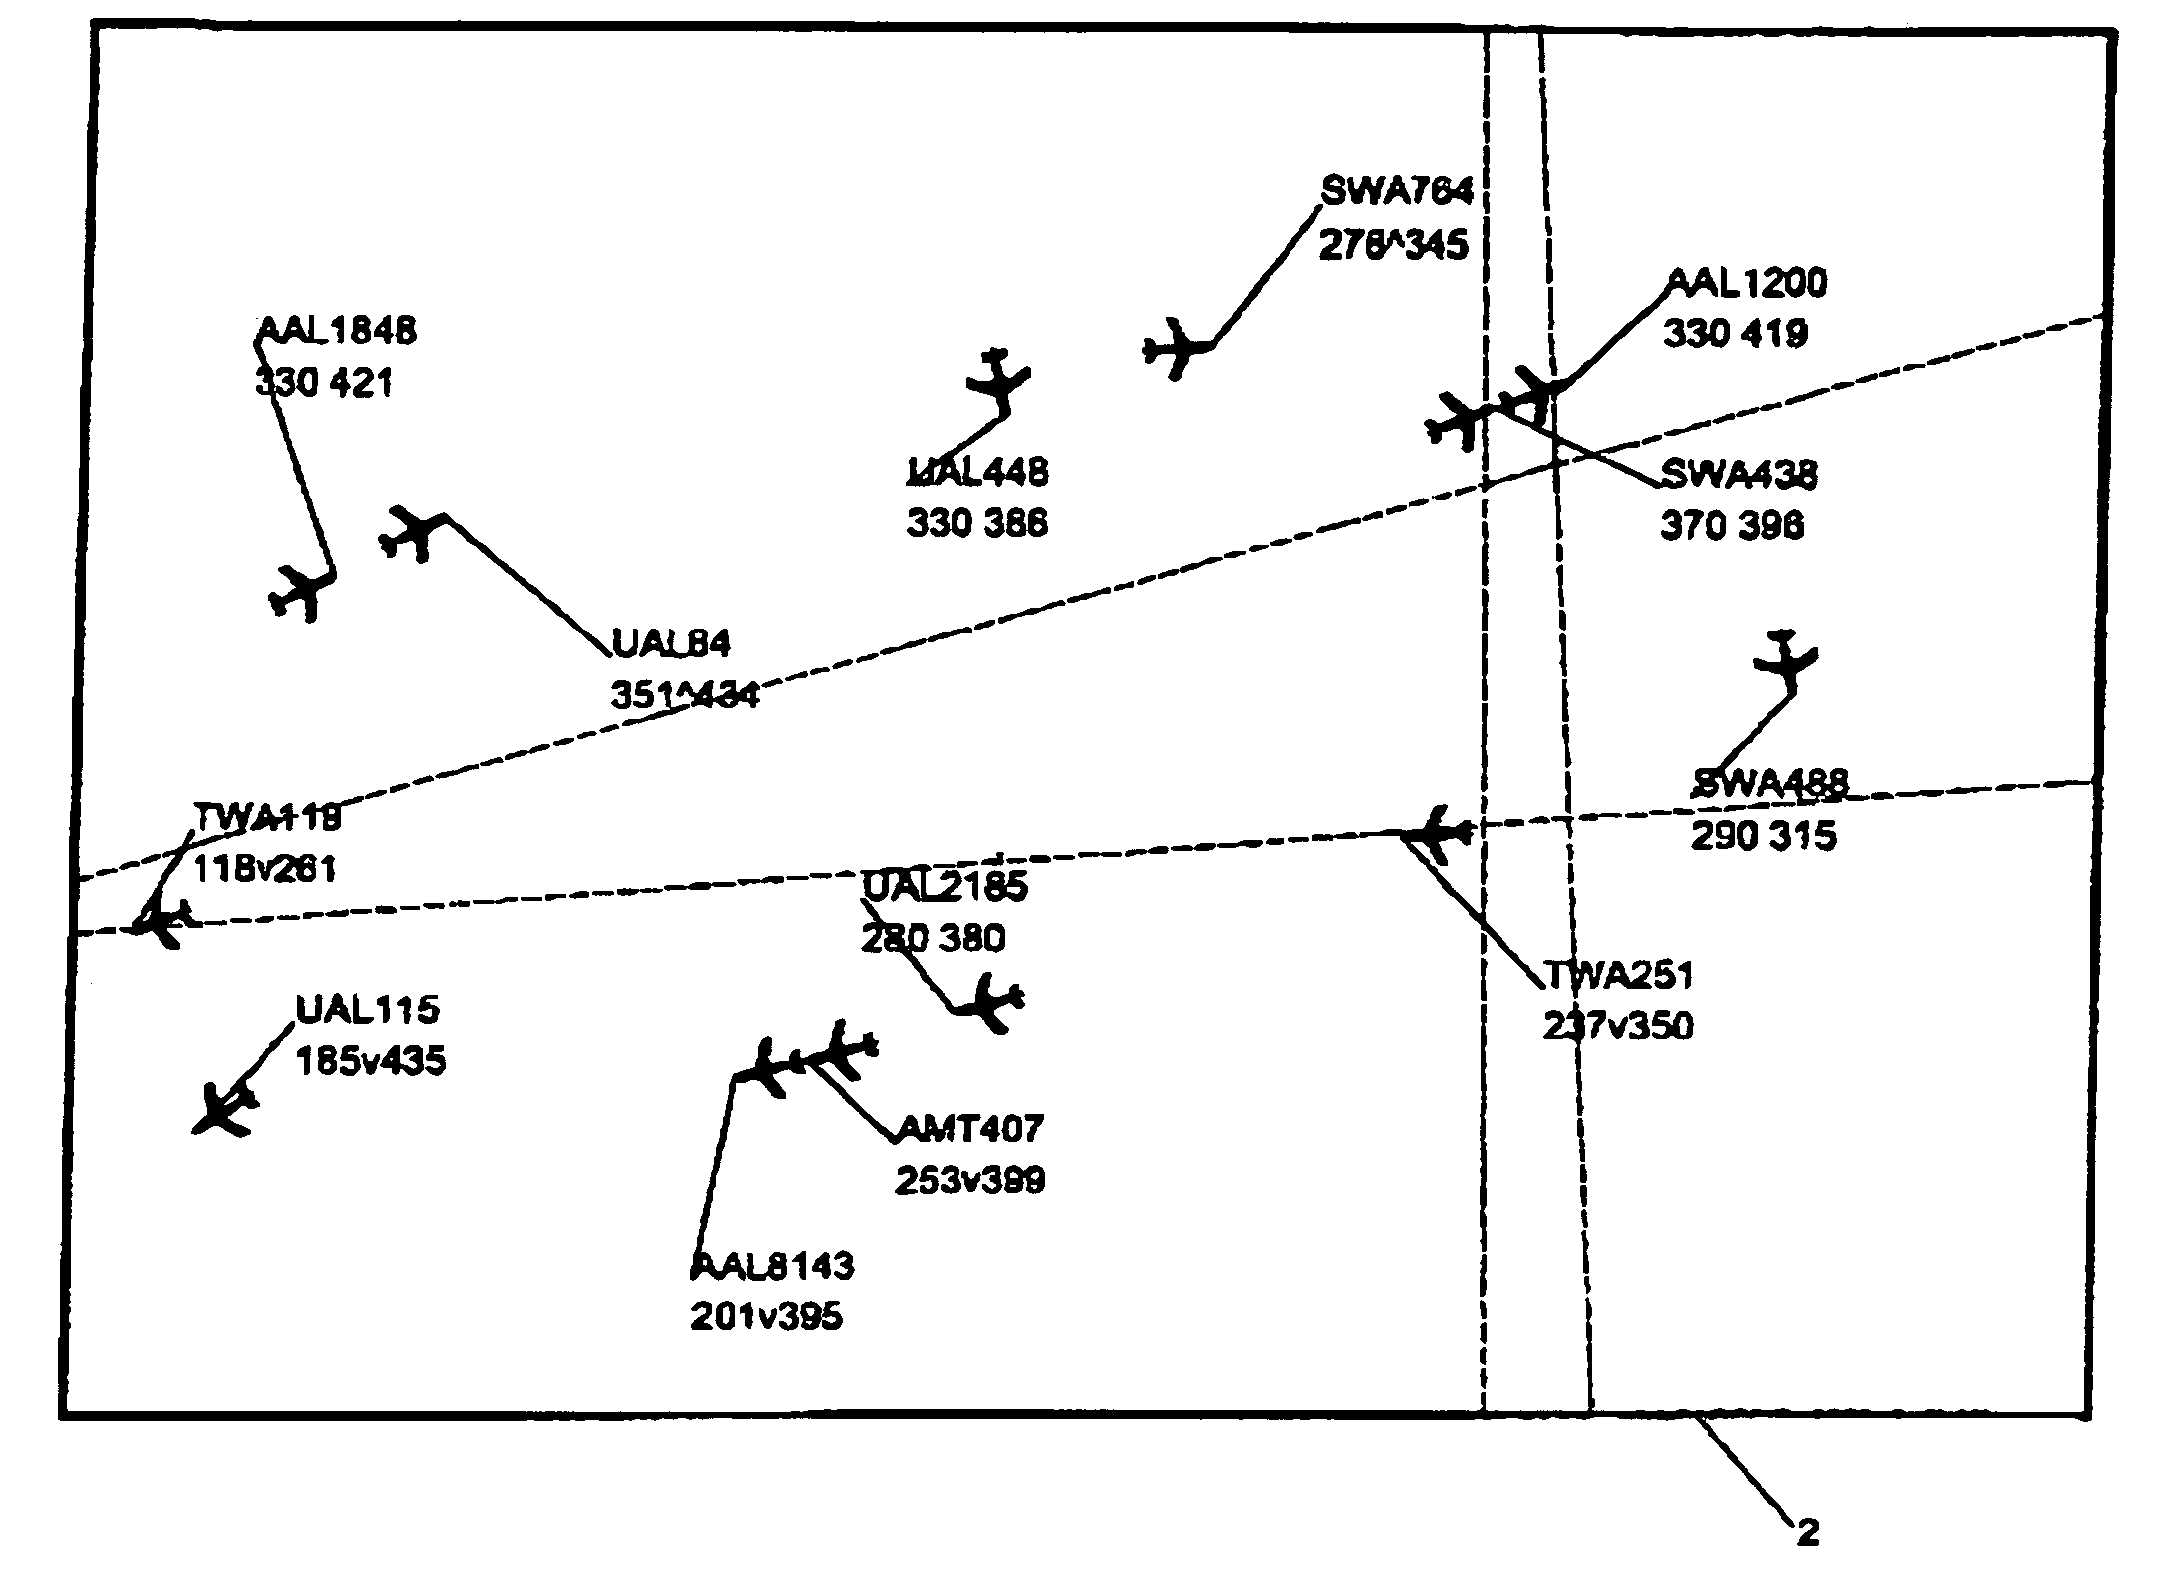
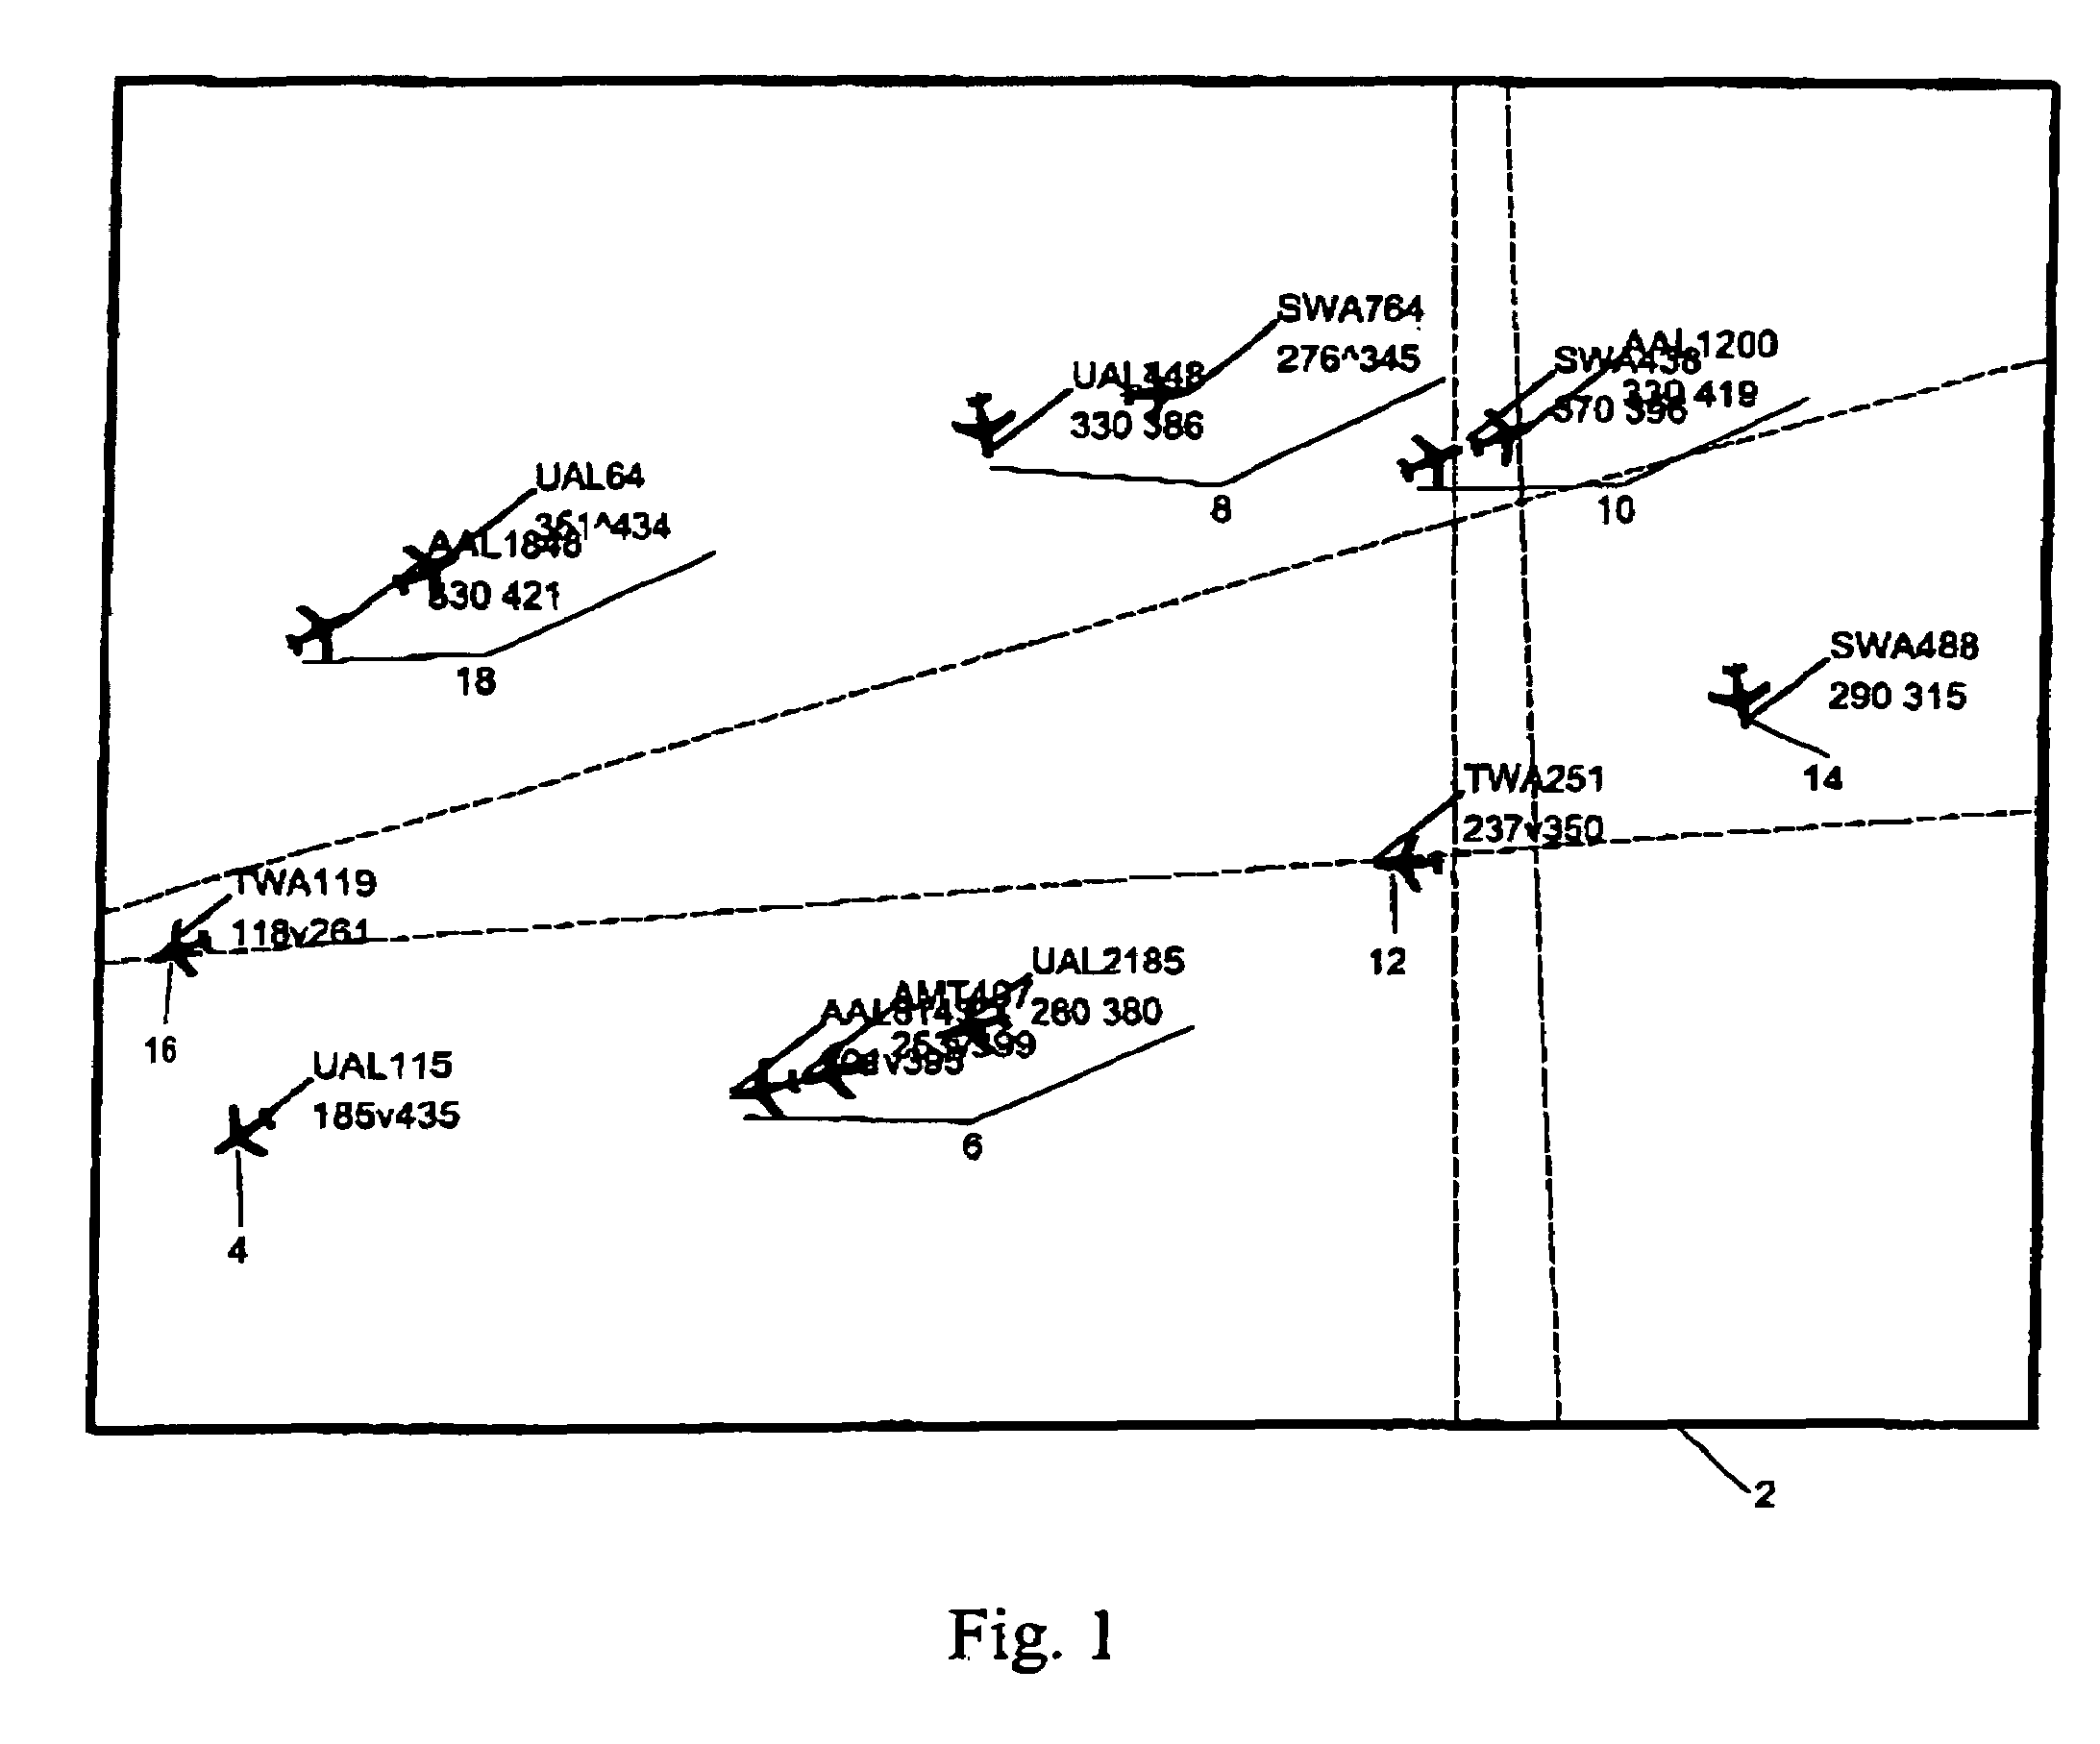
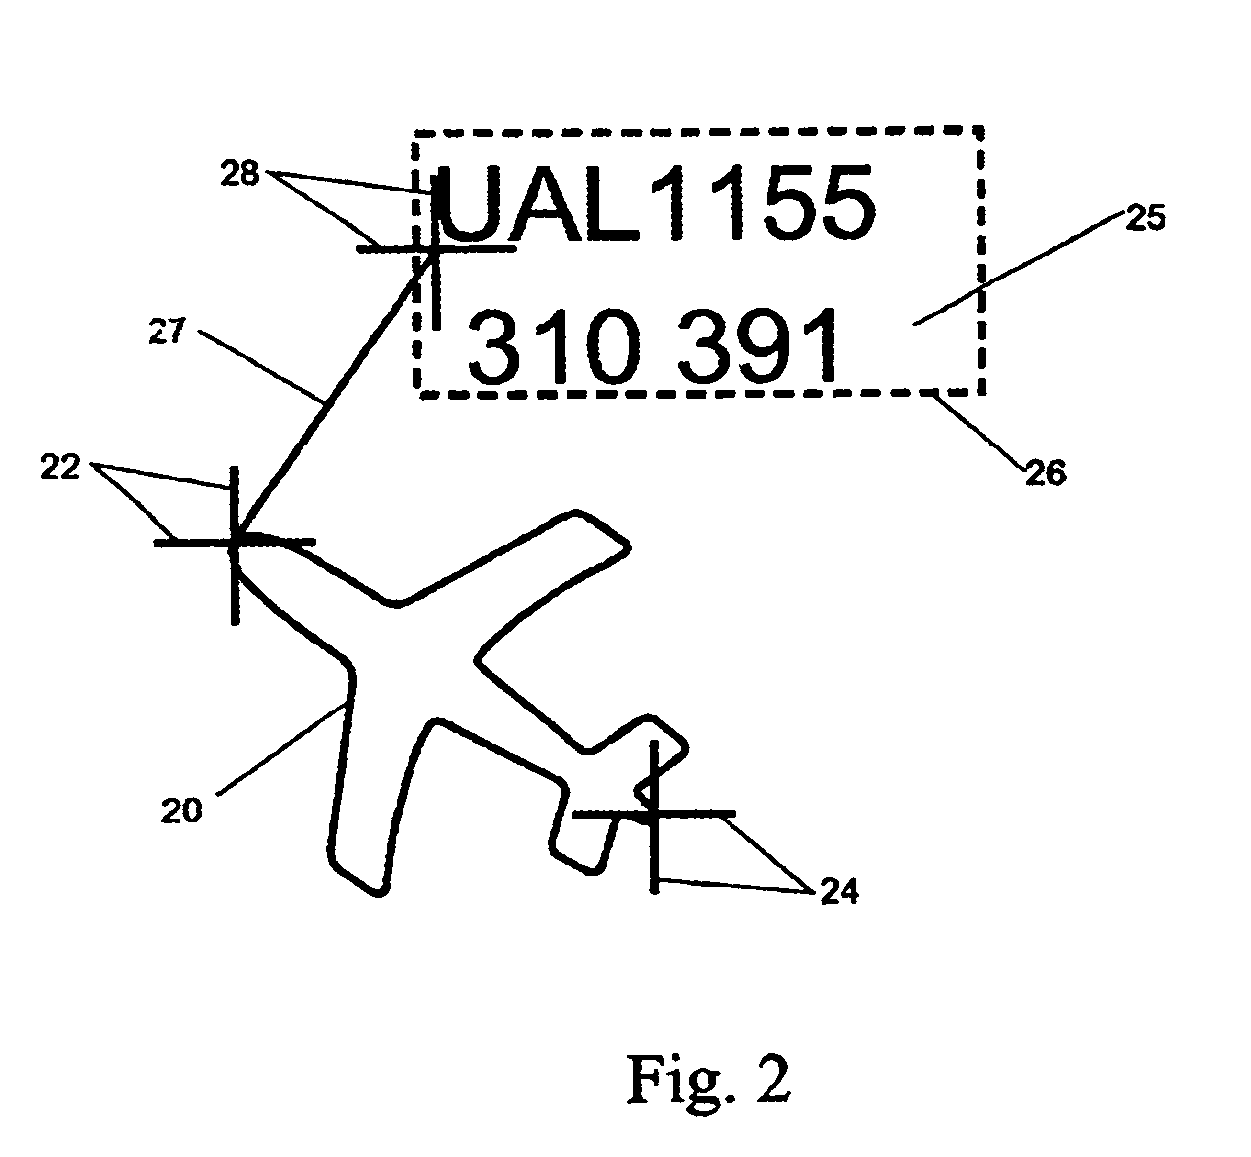
[0031]The present invention teaches a novel apparatus and method for automatically placing two-dimensional labels that are associated with certain graphical objects in an interactive computer graphics display, so that the labels avoid overlapping each other and other objects on the display. This saves the user the effort of doing the task manually. The pr...


PUM


Abstract

A method and apparatus for positioning labels on a graphical display, which, in an illustrative embodiment, can include labels for aircraft icons in an air traffic control system's computer graphics display. The present invention advantageously identifies clusters of overlapping labels and objects, and calculates non-overlapping label positions on a cluster by cluster basis. In another aspect of the present invention, the movement of labels is accomplished in a smooth, incremental fashion so that cognitive distraction to the user of the graphical display terminal is kept to a minimum.

Description

FIELD OF THE INVENTION[0001]The present invention relates to computer graphics displays. More specifically, the present invention relates to systems and methods for placing of icons in graphics displays.BACKGROUND OF THE INVENTION[0002]Interactive computer graphics applications frequently require that two-dimensional labels be attached to objects that are displayed on a screen. Such labels provide information about the objects they are related to and are useful for users of such systems. These labels are typically drawn as a two-dimensional overlay on top of the two-dimensional or three-dimensional graphical object rendition that otherwise appears on the graphics display screen. One example of such an application is an air traffic control system where a graphical display of aircraft in flight is rendered on a display screen for use by an air traffic controller in controlling air traffic within a given region of interest. Within the region, for each real aircraft, there is rendered a...

Claims


Application Information

Patent Timeline
IPC IPC(8): G06N3/00G06T11/60
CPCG06T11/60
Inventor AZUMA, RONALD
Owner RAYTHEON CO
Why Eureka
Try Eureka