
Method and apparatus for predicting the presence of haemostatic dysfunction in a patient sample

Inactive Publication Date: 2005-05-24
BIOMERIEUX INC
View PDF107 Cites 28 Cited by
  • Summary
  • Abstract
  • Description
  • Claims
  • Application Information

AI Technical Summary

Benefits of technology

[0023]Using a sigmoidal curve fit to a profile, P. Baumann, T. Jurgensen, C. Heuck, Computerized Analysis of the In Vitro Activation of the Plasmatic Clotting System, Haemostasis, 19, 309-321 (1989) showed that a ratio of two coefficients was unique for a select group of blood factor deficiencies when fibrinogen was artificially maintained by addition of exogenous fibrinogen to a fixed concentration, and that same ratio also correlates heparin to FII deficiency and FXa deficiencies. However, the requirement for artificially fixed fibrinogen makes this approach inappropriate for analysis of clinical specimens. The present invention makes it possible to predict haemostatic dysfunction for clinical samples from a time-dependent measurement profile without artificial manipulation of samples.

Problems solved by technology

These coagulation cascade models demonstrate: (1) the complexity of the clot formation process, and (2) the difficulty in associating PT clot times alone with specific conditions.
Since a number of other plasma abnormalities may also cause prolonged APTT results, the ability to discriminate between these effectors from screening assay results may be clinically significant.
However, the requirement for artificially fixed fibrinogen makes this approach inappropriate for analysis of clinical specimens.

Method used


Image

  • Method and apparatus for predicting the presence of haemostatic dysfunction in a patient sample
  • Method and apparatus for predicting the presence of haemostatic dysfunction in a patient sample
  • Method and apparatus for predicting the presence of haemostatic dysfunction in a patient sample

Examples


example 1

Prediction of Heparin in Sample

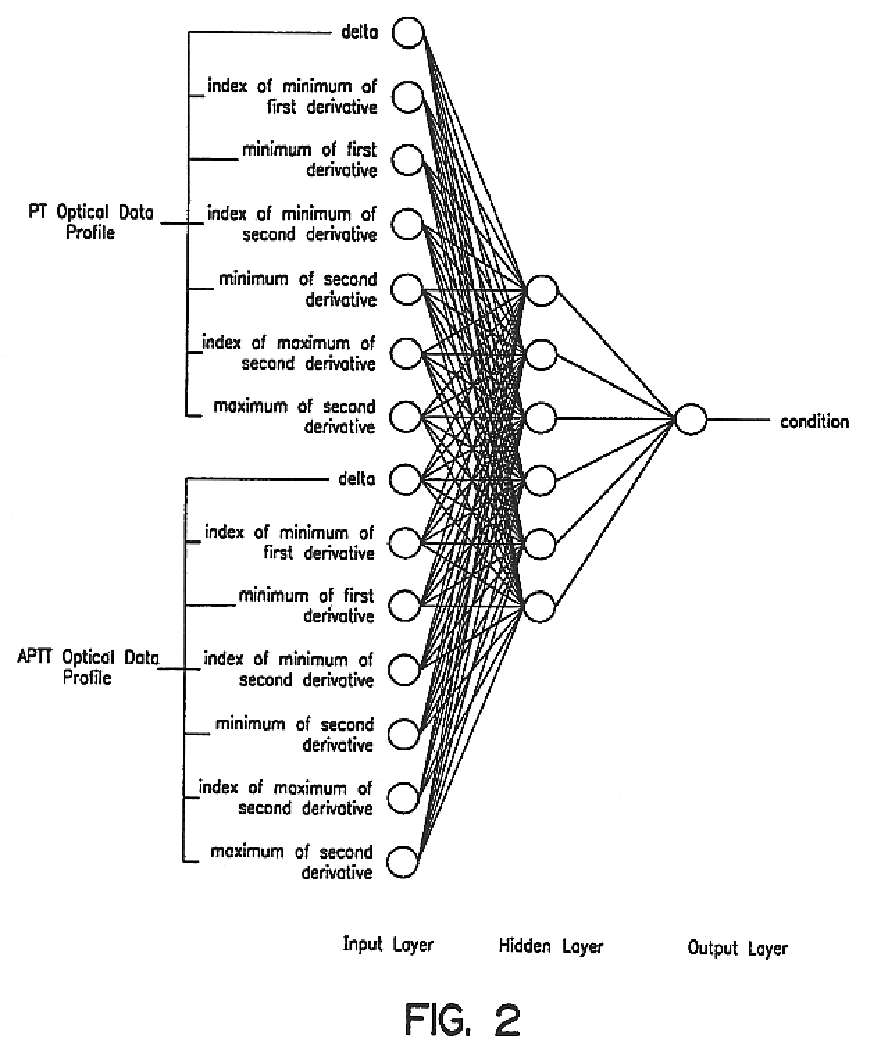
[0069]This example shows a set of predictor variables that adequately describe screening assay optical profiles, develops an optimal neural network design, and determines the predictive capabilities of an abnormal condition associated with thrombosis / hemostasis (in this case for the detection of heparin) with a substantial and well-quantified test data set.

[0070]Simplastin™ L, Platelin™ L, calcium chloride solution (0.025 M), imidazole buffer were obtained from Organon Teknika Corporation, Durham, N.C., 27712, USA. All plasma specimens were collected in 3.2% or 3.8% sodium citrate in the ratio of one part anticoagulant to nine parts whole blood. The tubes were centrifuged at 2000 g for 30 minutes and then decanted into polypropylene tubes and stored at −80° C. until evaluated. 757 specimens were prepared from 200 samples. These specimens were tested by the following specific assays: FII, FV, FVII, FVIII, FIX, FX, FXI, FXII, heparin, fibrinogen, plasmin...

example 2

Factor VIII

[0087]Similar tests were run as in Example 1. As can be seen in FIGS. 10 and 11, two training sessions were conducted for predicting a Factor VIII condition in an unknown sample. FIG. 10 is a receiver operator characteristic plot related to predicting an abnormality in relation to Factor VIII. In FIG. 10, everything below 30% activity was indicated as positive, and everything above 30% was indicated as negative. Cutoff values other than 30% could also be used. In this Example, the activity percentage has a known accuracy of approximately + or −10%. In FIG. 11, the actual percent activity was utilized as the output.

example 3

Factor X

[0088]As can be seen in FIG. 12, the method of the present invention was run similar to that as in Example 2, where here an abnormality in Factor X concentration was predicted from unknown samples. Everything below 30% activity was indicated as positive, and everything above 30% was indicated as negative. Cutoff values other than 30% could also be used.

[0089]The results of the cross-validation sample sets throughout the experiments indicate that the sample size was sufficient for the network to generalize. While the random distribution of the training and cross-validation sets were held constant throughout the experiments presented, other distributions have been used. These distributions, while all yielding different results, still lead to the same general conclusion.

[0090]Many alternatives for or additions to the set of predictor variables were explored. This included coefficients of a curve fitted to the data profile, pattern recognition, and clot time-based parameters. Lo...


PUM


Abstract

A method is disclosed for predicting the presence of haemostatic dysfunction. At least one time-dependent measurement on an unknown sample is performed and a respective property of the sample is measured over time so as to derive a time-dependent measurement profile. One or more predictor variables, including initial slope, are defined which sufficiently define the data of the time-dependent measurement profile. A model is then derived that represents the relationship between the abnormality and the set of predictor variables. Subsequently, the model is utilized to predict haemostatic dysfunction, such as septicemia or disseminated intravascular coagulation (DIC).

Description

BACKGROUND OF THE INVENTION[0001]This application is a continuation of U.S. application Ser. No. 09 / 244,340 filed Feb. 4, 1999, now abandoned, which is a continuation-in-part of U.S. patent application Ser. No. 09 / 001647, filed Dec. 31, 1997, now U.S. Pat. No. 6,321,164, which is a continuation-in-part of U.S. patent application Ser. No. 08 / 859,773 to Givens et al. filed May 21, 1997, now U.S. Pat. No. 6,101,449, issued Aug. 8, 2000, which is a continuation of U.S. patent application Ser. No. 08 / 477,839 to Givens et al. filed Jun. 7, 1995, now U.S. Pat. No. 5,708,591, issued Jan. 13, 1998, all of which are incorporated by reference. U.S. Pat. No. 5,646,046 to Fischer et al. is also incorporated herein by reference. This application is further related to the following publications, the subject matter of each also being incorporated herein by reference:[0002]1. B. Pohl, C. Beringer, M. Bomhard, F. Keller, The quick machine—a mathematical model for the extrinsic activation of coagulati...

Claims


Application Information

Patent Timeline
IPC IPC(8): G01N33/49G01N33/86G06F19/00
CPCG01N33/4905G01N33/86G06F19/3487G06F19/3437G06F19/366G16H10/40G16H15/00G16H50/50Y02A90/10
Inventor TOH, CHENG HOCKDOWNEY, COLINFISCHER, TIMOTHY J.
Owner BIOMERIEUX INC
Learn More