Digital imaging technology-based method for calculating relative permeability of tight core

Pending Publication Date: 2021-02-18
SOUTHWEST PETROLEUM UNIV
View PDF0 Cites 1 Cited by
  • Summary
  • Abstract
  • Description
  • Claims
  • Application Information

AI Technical Summary

Benefits of technology

The present invention is a method for calculating the relative permeability of a tight core using digital imaging technology. This method has the advantage of being based on the fractal capillary number model of porous media, which avoids the problems of time consumption and instrument accuracy. The method takes into account the influence of rock morphological characteristics such as pore distribution and internal structure on the relative permeability curve. Having established an associated digital core of the actual rock sample, the method avoids resource waste caused by repeated physical experiments. The technical effects of this invention are reduced time consumption and cost, improved accuracy, and more efficient resource allocation.

Problems solved by technology

Due to the low permeability and the threshold pressure gradient, the measurement of relative permeability curve takes a long time and has poor accuracy.
Due to the low permeability of tight reservoirs, it takes a long time to obtain the relative permeability curve by the displacement experiment, takes a long time to stabilize the flow rate, and requires high accuracy of measuring instruments.

Method used


Image

  • Digital imaging technology-based method for calculating relative permeability of tight core
  • Digital imaging technology-based method for calculating relative permeability of tight core
  • Digital imaging technology-based method for calculating relative permeability of tight core

Examples


embodiment 1

[0101]When the embodiments are implemented, in

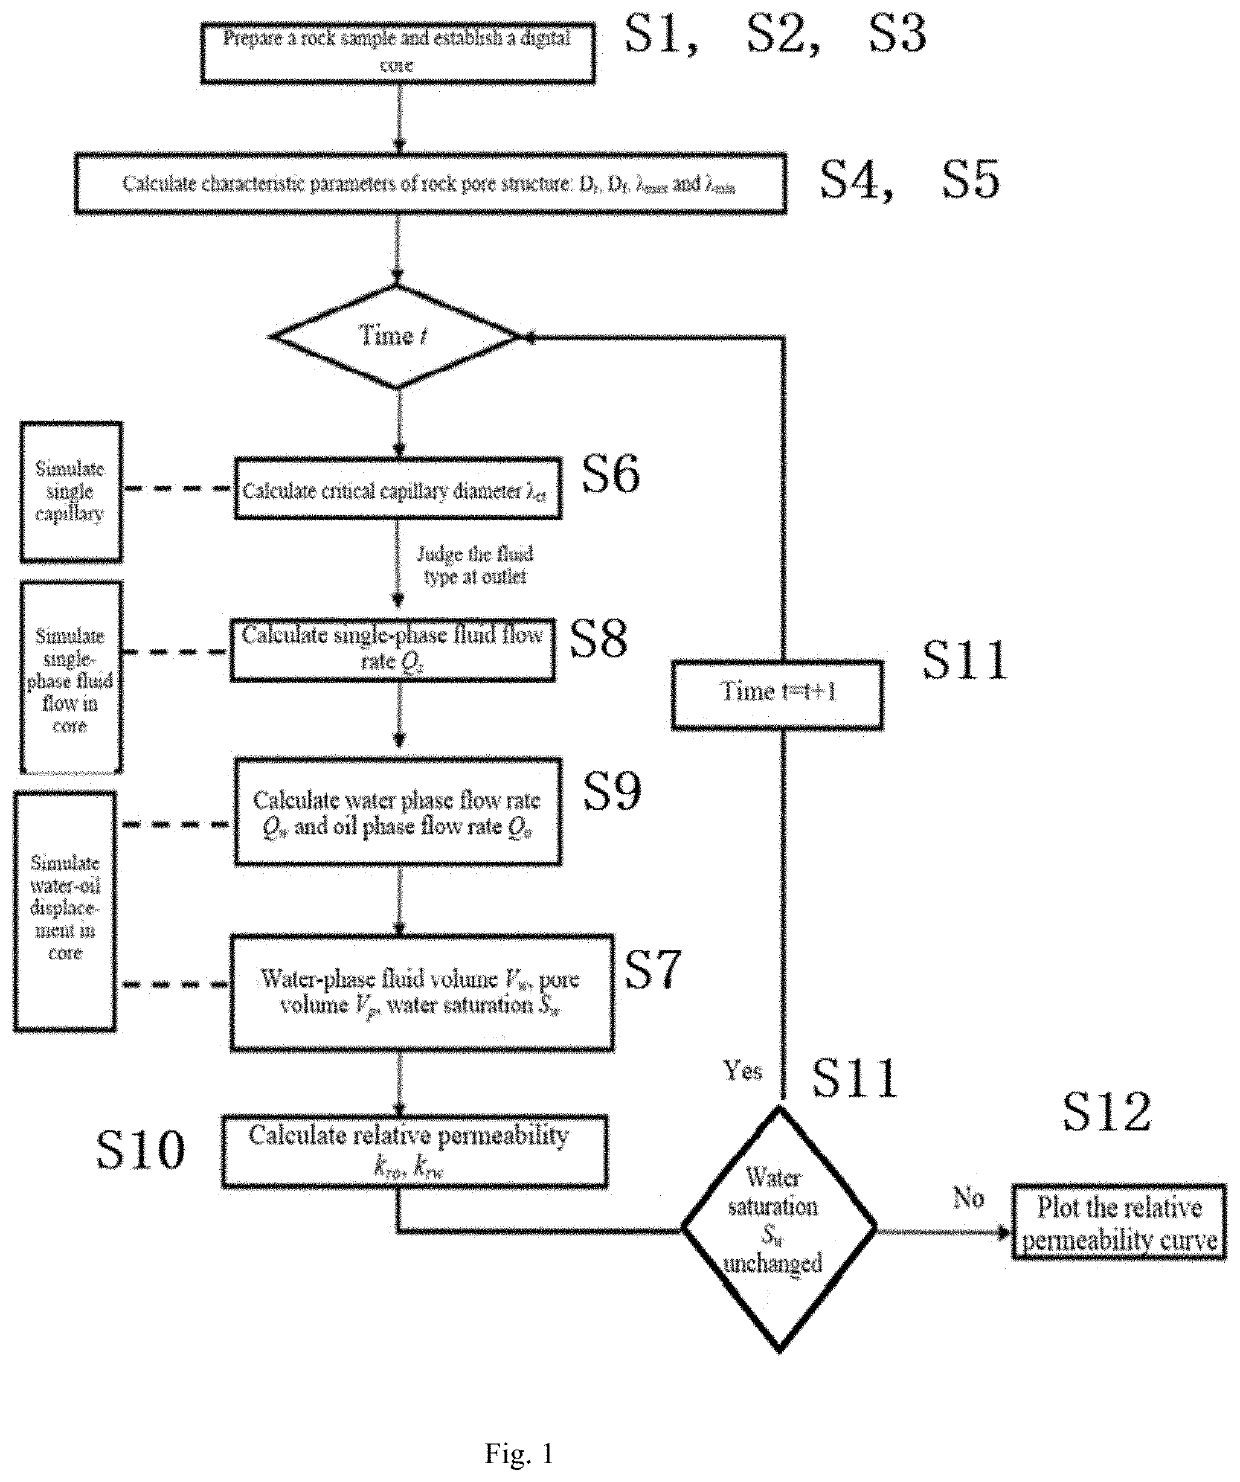
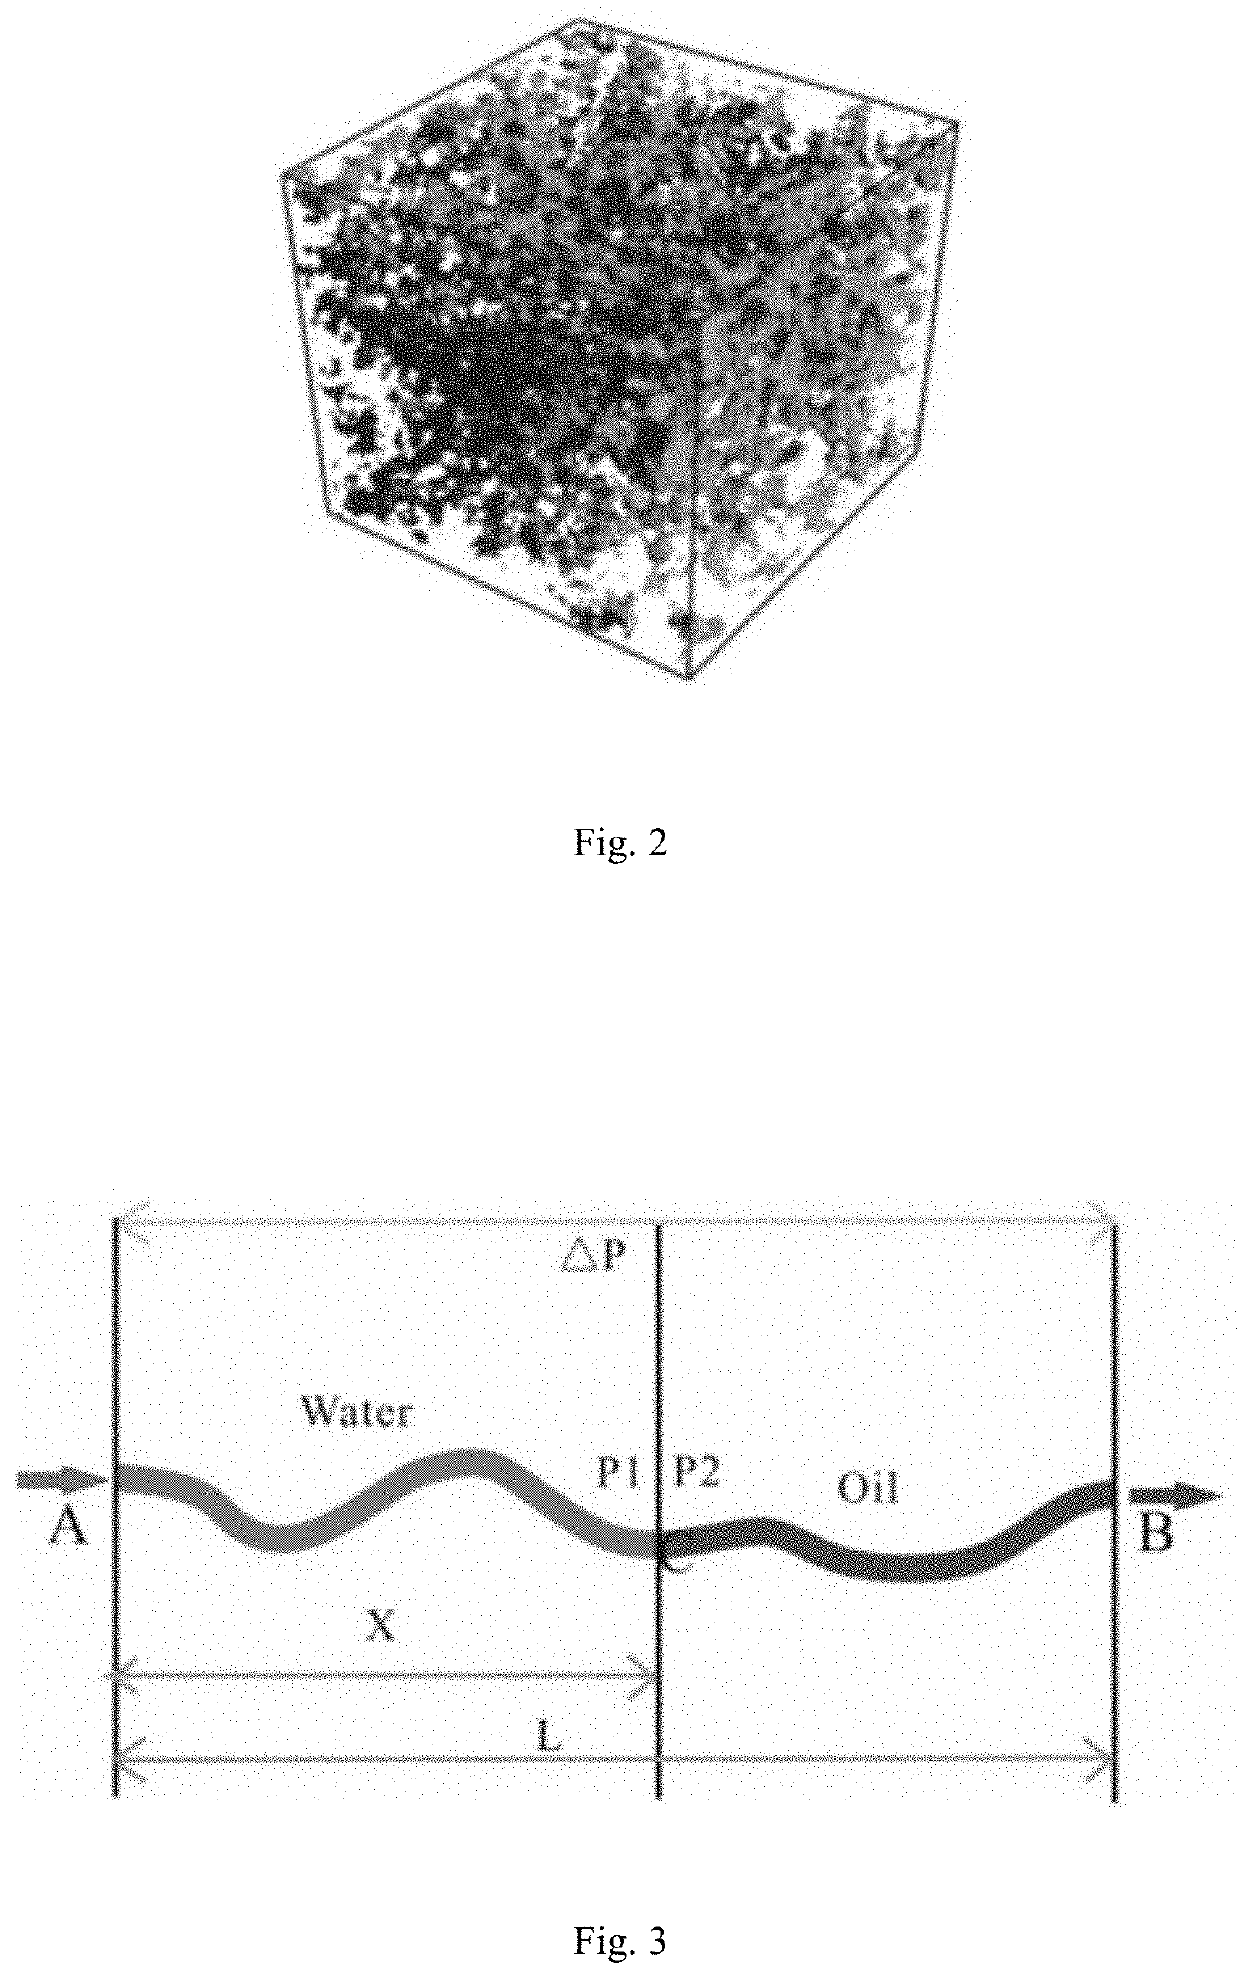
[0102](1) Select low-permeability tight sandstone sample, prepare a small column sample satisfying resolution requirements, with a size of 8 mm (diameter)×20 mm, and then scan the sample and establish a digital core by MicroCT-400, as shown in FIG. 2.

[0103](2) Calculate tortuosity fractal dimension DT=1.1 and porosity fractal dimension Df=1.3 by 3D image fractal box dimension algorithm, and perform statistical analysis on maximum pore equivalent diameter λmax=2.6×10⁻⁵ m and minimum pore equivalent diameter λmin=4.3×10⁻⁸ m by a label.

[0104](3) Taking t=0 as the starting time, calculate associated critical capillary diameter, and judge the distribution of all capillary fluids in the core at that time.

[0105](4) Simulate and calculate single-phase fluid flow rate Qs, then calculate water phase flow rate Qw and oil phase flow rate Qo at t=0.

[0106](5) Simulate and calculate water-phase fluid volume, pore volume and water saturation in the core...

embodiment 2

[0110]In

[0111](1) Select different porosity fractal dimensions Df=1.3, 1.4 and 1.5, the same tortuosity fractal dimension DT, maximum pore equivalent diameter λmax and minimum pore equivalent diameter λmin as the characteristic values of the core pore structure parameters, and use them to calculate the influence of difference porosity fractal dimensions on the relative permeability curve.

[0112](2) Taking t=0 as the starting time, calculate associated critical capillary diameter, and judge the distribution of all capillary fluids in the core at that time.

[0113](3) Simulate and calculate single-phase fluid flow rate Qs, then calculate water phase flow rate Qw and oil phase flow rate Qo at t=0.

[0114](4) Simulate and calculate water-phase fluid volume, pore volume and water saturation in the core at t=0.

[0115](5) Calculate relative permeability kro and krw corresponding to water saturation.

[0116](6) Repeat the steps (3) to (5) of Embodiment 2, calculate the parameters at the next time S...


PUM


Abstract

The invention discloses a digital imaging technology-based method for calculating relative permeability of tight core, comprising the following steps: step S1: preparing a small column sample of tight core satisfying resolution requirements; step S2: scanning the sample by MicroCT-400 and establish a digital core; step S3: performing statistical analysis on parameters reflecting the characteristics of rock pore structure and shape according to the digital core; step S4: calculating tortuosity fractal dimension DT and porosity fractal dimension Df by a 3D image fractal box dimension algorithm; step S5: performing statistical analysis on maximum pore equivalent diameter λmax and minimum pore equivalent diameter λmin by a label. The present invention solves the problems of time consumption of experiment, instrument accuracy, incapability of repeated calculation simulations and resource waste by repeated physical experiment.

Description

BACKGROUND TECHNOLOGYTechnical Field[0001]The invention relates to the field of analysis of microphysical properties of tight rock, in particular to a digital imaging technology-based method for calculating relative permeability of tight core.Description of Related Art[0002]The tight reservoir is currently the focus of research on the development of unconventional oil and gas resources, with great commercial value. The flow of oil and gas in low-permeability tight reservoir is often accompanied by non-Darcy flow. In order to effectively characterize the effect of non-Darcy flow at low speed, the threshold pressure gradient is introduced. Due to the low permeability and the threshold pressure gradient, the measurement of relative permeability curve takes a long time and has poor accuracy. Therefore, it is very critical to establish a method for calculating relative permeability with consideration of low permeability characteristics of porous media.[0003]For the tight reservoir, there...

Claims


Application Information

Patent Timeline
IPC IPC(8): E21B49/08E21B49/02E21B47/12G06T17/05
CPCE21B49/0875G06T17/05E21B47/138E21B49/02G01N15/0826G01N15/088E21B49/00G01N2015/0846Y02A10/40G06T17/00
Inventor DUAN, YONGGANGLI, ZHENGLANFANG, QUANTANGWEI, MINGQIANGPENG, YUWEI, SHIHAOWU, ZIJIANSHENG, SHUYAO
Owner SOUTHWEST PETROLEUM UNIV
Why Eureka
Try Eureka