
Using historic execution data to visualize tracepoints

a technology of execution data and tracepoints, applied in error detection/correction, instruments, computing, etc., can solve problems such as unsatisfactory software behavior, slow execution performance, incorrect data, etc., and achieve the effect of convenient monitoring

Active Publication Date: 2020-08-13
MICROSOFT TECH LICENSING LLC
View PDF3 Cites 3 Cited by
  • Summary
  • Abstract
  • Description
  • Claims
  • Application Information

AI Technical Summary

Benefits of technology

The patent talks about using information about how an application has run in the past to create a visual representation of its behavior. This helps to better monitor and improve the application's code.

Problems solved by technology

Undesired software behavior can include many things, such as execution crashes, runtime exceptions, slow execution performance, incorrect data results, data corruption, and the like.
Given this wide variety of triggers, undesired software behavior can appear to be seemingly random; consequently, it can also be extremely difficult to reproduce.
As such, developers often spend exorbitant amounts of time attempting to identify undesired software behavior.
Once an undesired software behavior has been identified, it can again be difficult to determine its root cause(s).
Since execution of some diagnostic code can negatively impact application performance and since diagnostic information can consume large amounts of storage resources, developers are often selective about what diagnostic code is included (or made active) in an application that is to be deployed for production use.
For large applications and for applications that are in active production use, re-deploying those applications can be time consuming and / or disruptive.
In addition, if the undesired software behavior is rare, it may take some time before the undesired software behavior is repeated after the application's re-deployment.
While diagnostic code can be very useful in some cases, its use can be limited and / or inflexible in production environments.

Method used


Image

  • Using historic execution data to visualize tracepoints
  • Using historic execution data to visualize tracepoints
  • Using historic execution data to visualize tracepoints

Examples


example method (

Example Method(s)

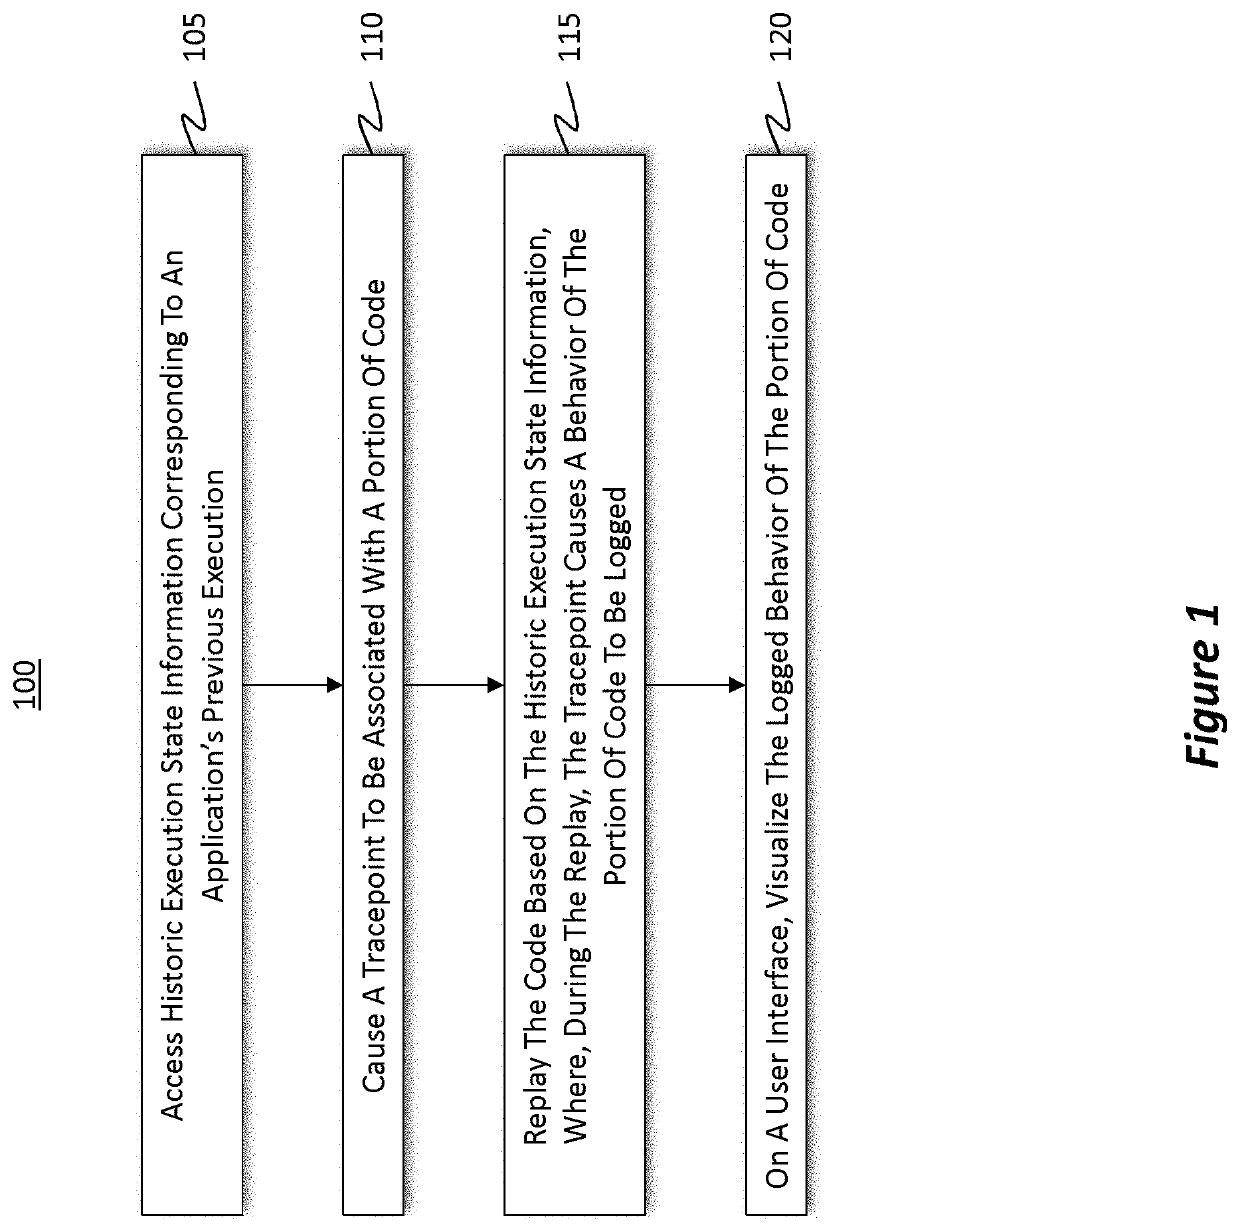
[0036]Attention will now be directed to FIG. 1 which refers to a number of method acts that may be performed. Although the method acts may be discussed in a certain order or illustrated in a flow chart as occurring in a particular order, no particular ordering is required unless specifically stated, or required because an act is dependent on another act being completed prior to the act being performed. The method presented in FIG. 1 is provided to introduce the disclosed embodiments while subsequent portions of the disclosure will more fully clarify different and / or additional aspects of the disclosed embodiments.

[0037]FIG. 1 illustrates a flowchart of an example method 100 for using historic execution state information to visualize tracepoint data. By way of introduction, a “tracepoint” is a debugging feature used to monitor at least a “portion” of code (e.g., source code and / or any other type of code associated with an application) without necessarily having to in...


PUM


Abstract

Techniques are provided to use historic execution state information to visualize tracepoint data. For example, historic execution state information corresponding to an application's previous execution is accessed. This historic execution state information was collected while the application was executing. After correlating the historic execution state information to the application's code, a tracepoint is associated with a portion of the code. Consequently, when the code is replayed based on the historic execution state information, the tracepoint causes a behavior of that code portion to be logged while the code is replayed uninterrupted. The code is then actually replayed based on the historic execution state information. During the replay, the tracepoint causes the behavior of the code portion to be logged. The logged behavior is visualized on a user interface.

Description

BACKGROUND[0001]Tracking down and correcting undesired software behavior is a core activity in software development. Undesired software behavior can include many things, such as execution crashes, runtime exceptions, slow execution performance, incorrect data results, data corruption, and the like.[0002]Undesired software behavior can be triggered by a wide variety of factors, such as data input, user input, race conditions (e.g., when accessing shared resources), and others. Given this wide variety of triggers, undesired software behavior can appear to be seemingly random; consequently, it can also be extremely difficult to reproduce. As such, developers often spend exorbitant amounts of time attempting to identify undesired software behavior. Once an undesired software behavior has been identified, it can again be difficult to determine its root cause(s).[0003]Developers may take several approaches to identify undesired software behavior and to then identify the location(s) in an ...

Claims


Application Information

Patent Timeline
Patent Type & Authority Applications(United States)
IPC IPC(8): G06F11/36
CPCG06F11/3664G06F11/3688G06F9/451G06F11/3636G06F11/323G06F3/0484
Inventor RICHARDSON, LESLIE YVETTEDAVIS, JACKSON MICHAELLAI, THOMASMYERS, DELNELSON, PATRICK LOTHIANMOLA, JORDIPINKERTON, JAMES M.STERLAND, ANDREW R.LUHRS, ANDREW JOSEPHMISIAK, TIMOTHY GARDNER
Owner MICROSOFT TECH LICENSING LLC
Learn More