
Inspection, analysis, classification, and grading of transparent sheets using segmented datasets of photoelasticity measurements

Active Publication Date: 2019-12-12
LITESENTRY LLC
View PDF0 Cites 4 Cited by
  • Summary
  • Abstract
  • Description
  • Claims
  • Application Information

AI Technical Summary

Benefits of technology

The present invention provides an apparatus and method for inspecting, analyzing, classifying, and grading the quality of transparent sheets using statistical analysis of various segmentations of data sets of optical measurements including optical retardance, shear, and stress axis orientation or azimuth over the area of the part being tested. The system can measure the actual thickness of the transparent sheet and provide a thickness map of the entire sheet. The system can also analyze the thickness map to determine the level and range of stress patterns and variation of the patterns. The system can quantify, compare, and grade the quality of the sheet for bow, warp, bi-stability, saddle bow, inclusions such as Nickel sulfide, haze, strain marks, and other physical or optical defects. The invention improves on the prior art in its ability to measure large areas quickly and over large values of retardation.

Problems solved by technology

Fabrication processes employed to form, cut, heat-strengthen, laminate, coat, machine, and mount into frames the transparent sheet can cause stresses on the transparent sheet.
Unintended or inappropriate application of stresses to the transparent sheet can result in poor optical quality, poor physical quality, breakage, and failure or rejection by the end user after the product is deployed.
Historically the amount of time required from order to delivery of fabricated glass products was many weeks or months.
With frequent and significant changes to the heat treatment process recipe in short time spans, the control of the process is difficult.
This idealized stress balance is difficult to achieve in practice, as the variables within the heat treatment process and frequent changes to the process result in highly variable distribution of stress in the glass.
Until now it has been difficult to analyze this retardance map in an automated fashion.
Uneven distribution of stress in the glass leads to visible strain patterns or iridescence when viewed in certain daylight conditions.
White haze is another term for contrasting light and dark areas in the glass and can result from both strain patterns in the glass and physical scuffing or abrasion on the bottom surface of the glass.
The end users including architects and building owners are increasingly dissatisfied with haze, strain patterns or iridescence in glass.
These devices are limited to small spot size measurements.
Small spot size of measurements and small number of samples per sheet of glass provide insufficient coverage to characterize the entire part.
The process is time and labor intensive, requiring tens of minutes or hours to measure the array of sample points on a single sheet.
The most widely used method of testing for stress in heat treated glass is destructive in the form of a break test after heat-treatment.
Break testing of heat treated glass results in 1% to 3% yield loss to the heat treated glass industry.
Shortcomings of the process include the lack of quantified stress measurements and the lack of a check of optical quality.
Systems for measuring photoelastic stress in glass such as described in Redner (U.S. Pat. No. 4,668,086) and Stockley (U.S. Pat. No. 5,400,131) are limited in practice to very small sample spot sizes of 1 square cm or less.
The use of said devices is time consuming.
Systems intended to measure large areas of glass have proven to operate slower than the application requires, requiring tens or hundreds of minutes to measure a single sheet, and often are not able to measure retardation greater than half the wavelength of the light source (or about 230 nm maximum in the case of blue light) The shortcomings of these earlier systems include the lack of ability to resolve the typical retardance range of heat treated glass which may exceed 500 nm, and the very small sample size relative to the very large surface area of the glass.
Systems intended to measure large areas of glass require human operator input of nominal thickness approximated to the nearest millimeter, leading to two types of errors: a nominal thickness entry is only an estimate of actual thickness; and human data entry is prone to error.
Though useful, this method lacks the additional two polarization states, for a total of four polarization states, required to fully define stress maps, shear maps, stress direction and iridescence maps.
The shortcoming of this method is the lack of high resolution data collection of retardance in nm, and in the analysis of discrete areas of the sheet such that maps of the sheet may be created and visualized.

Method used


Image

  • Inspection, analysis, classification, and grading of transparent sheets using segmented datasets of photoelasticity measurements
  • Inspection, analysis, classification, and grading of transparent sheets using segmented datasets of photoelasticity measurements
  • Inspection, analysis, classification, and grading of transparent sheets using segmented datasets of photoelasticity measurements

Examples


Embodiment Construction

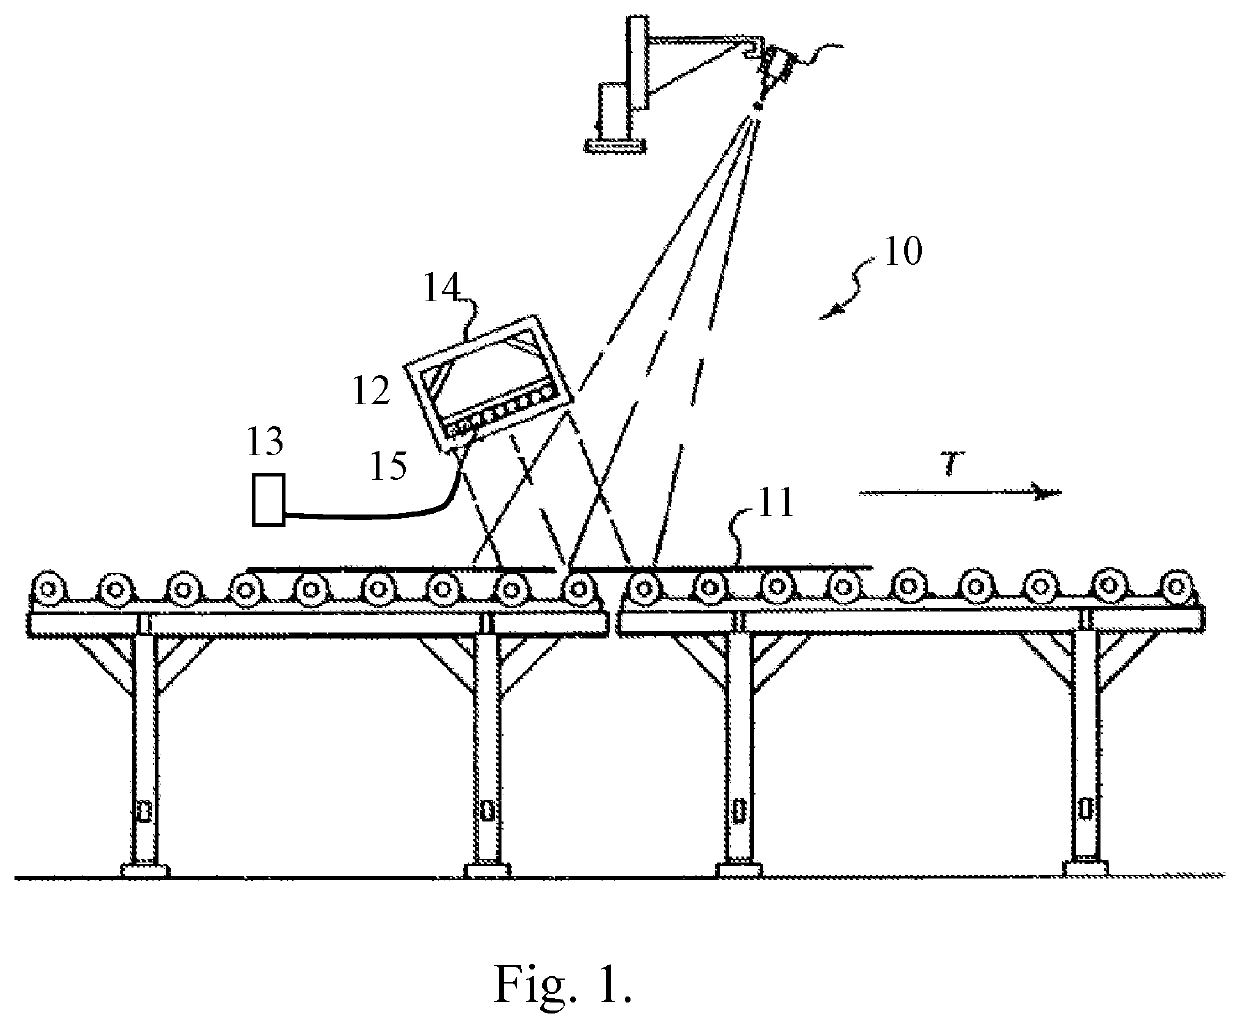
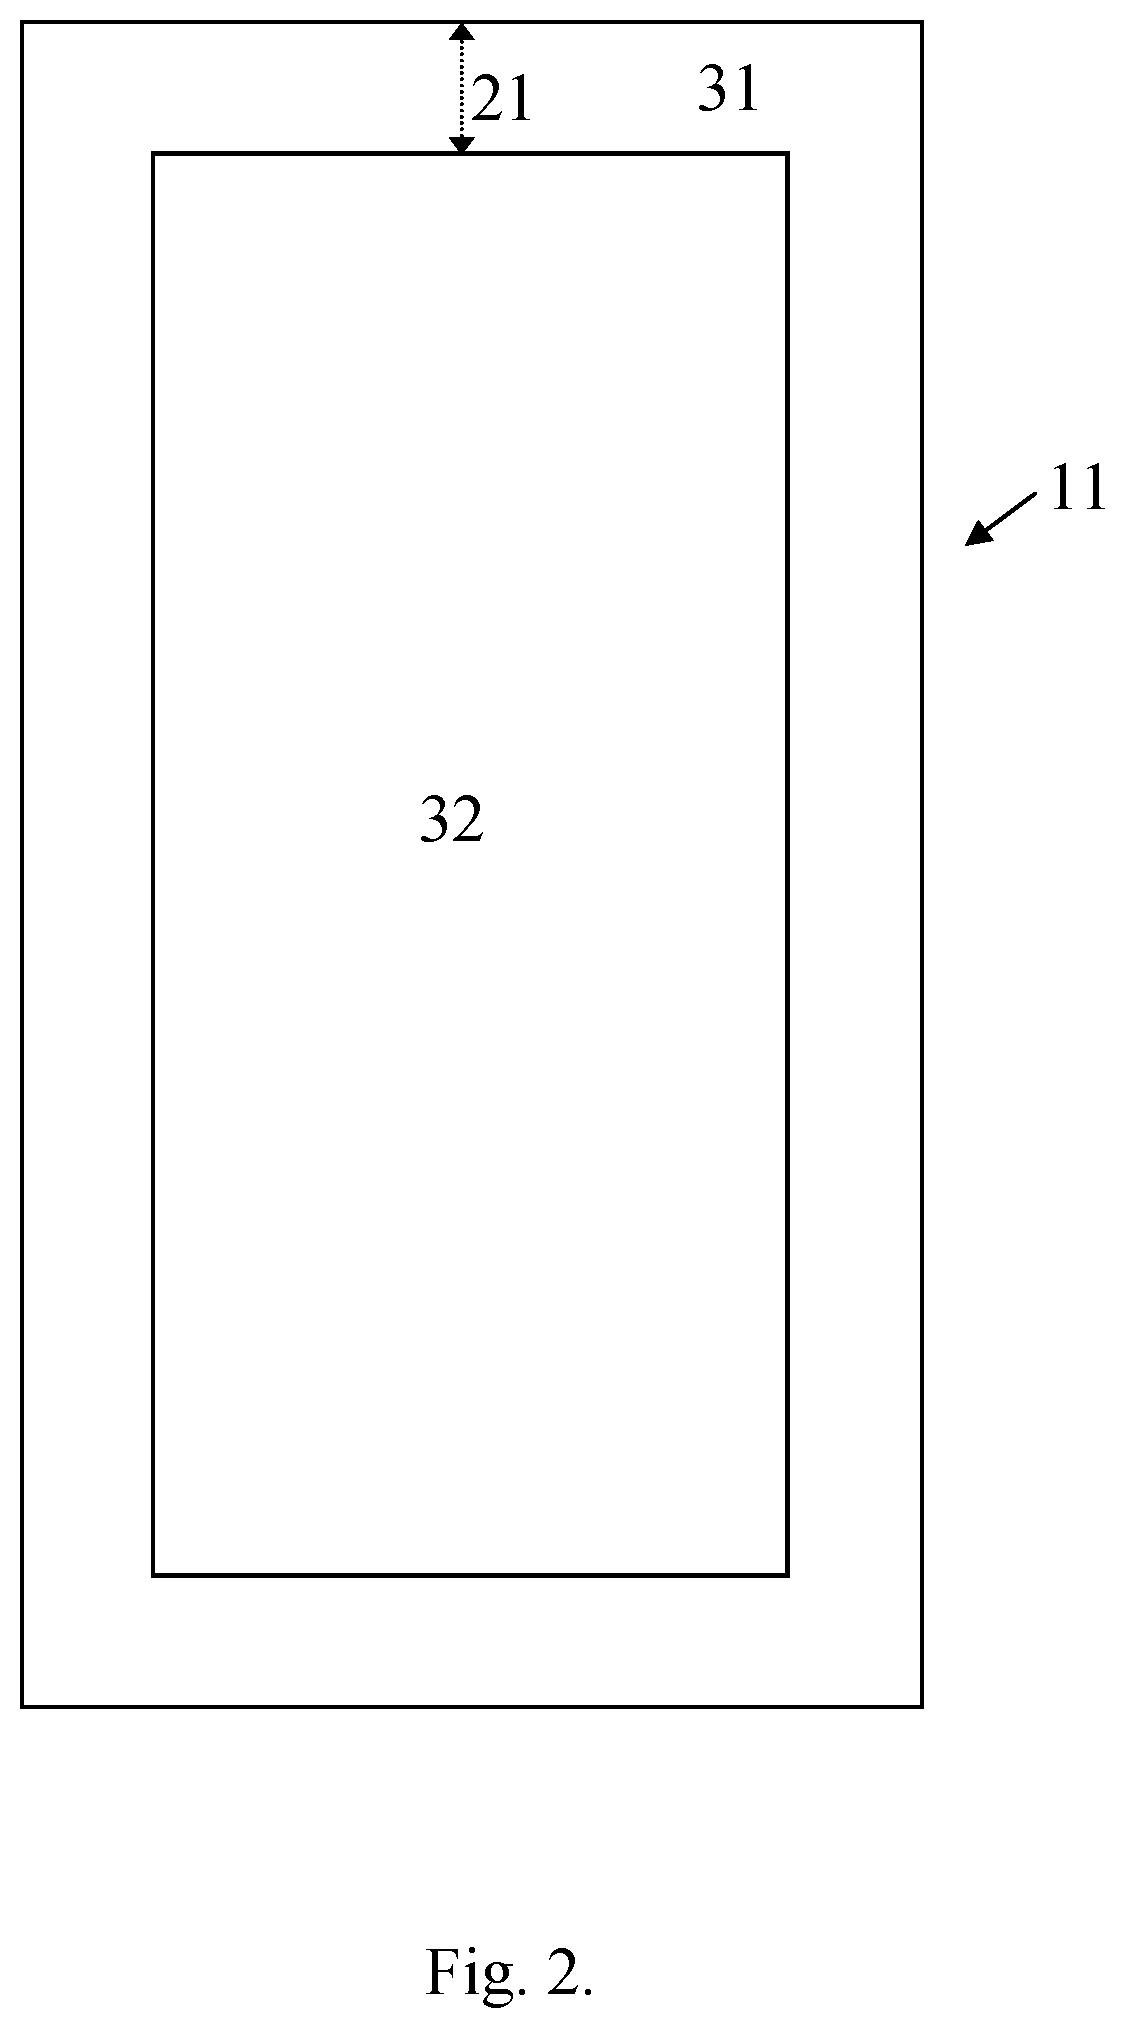
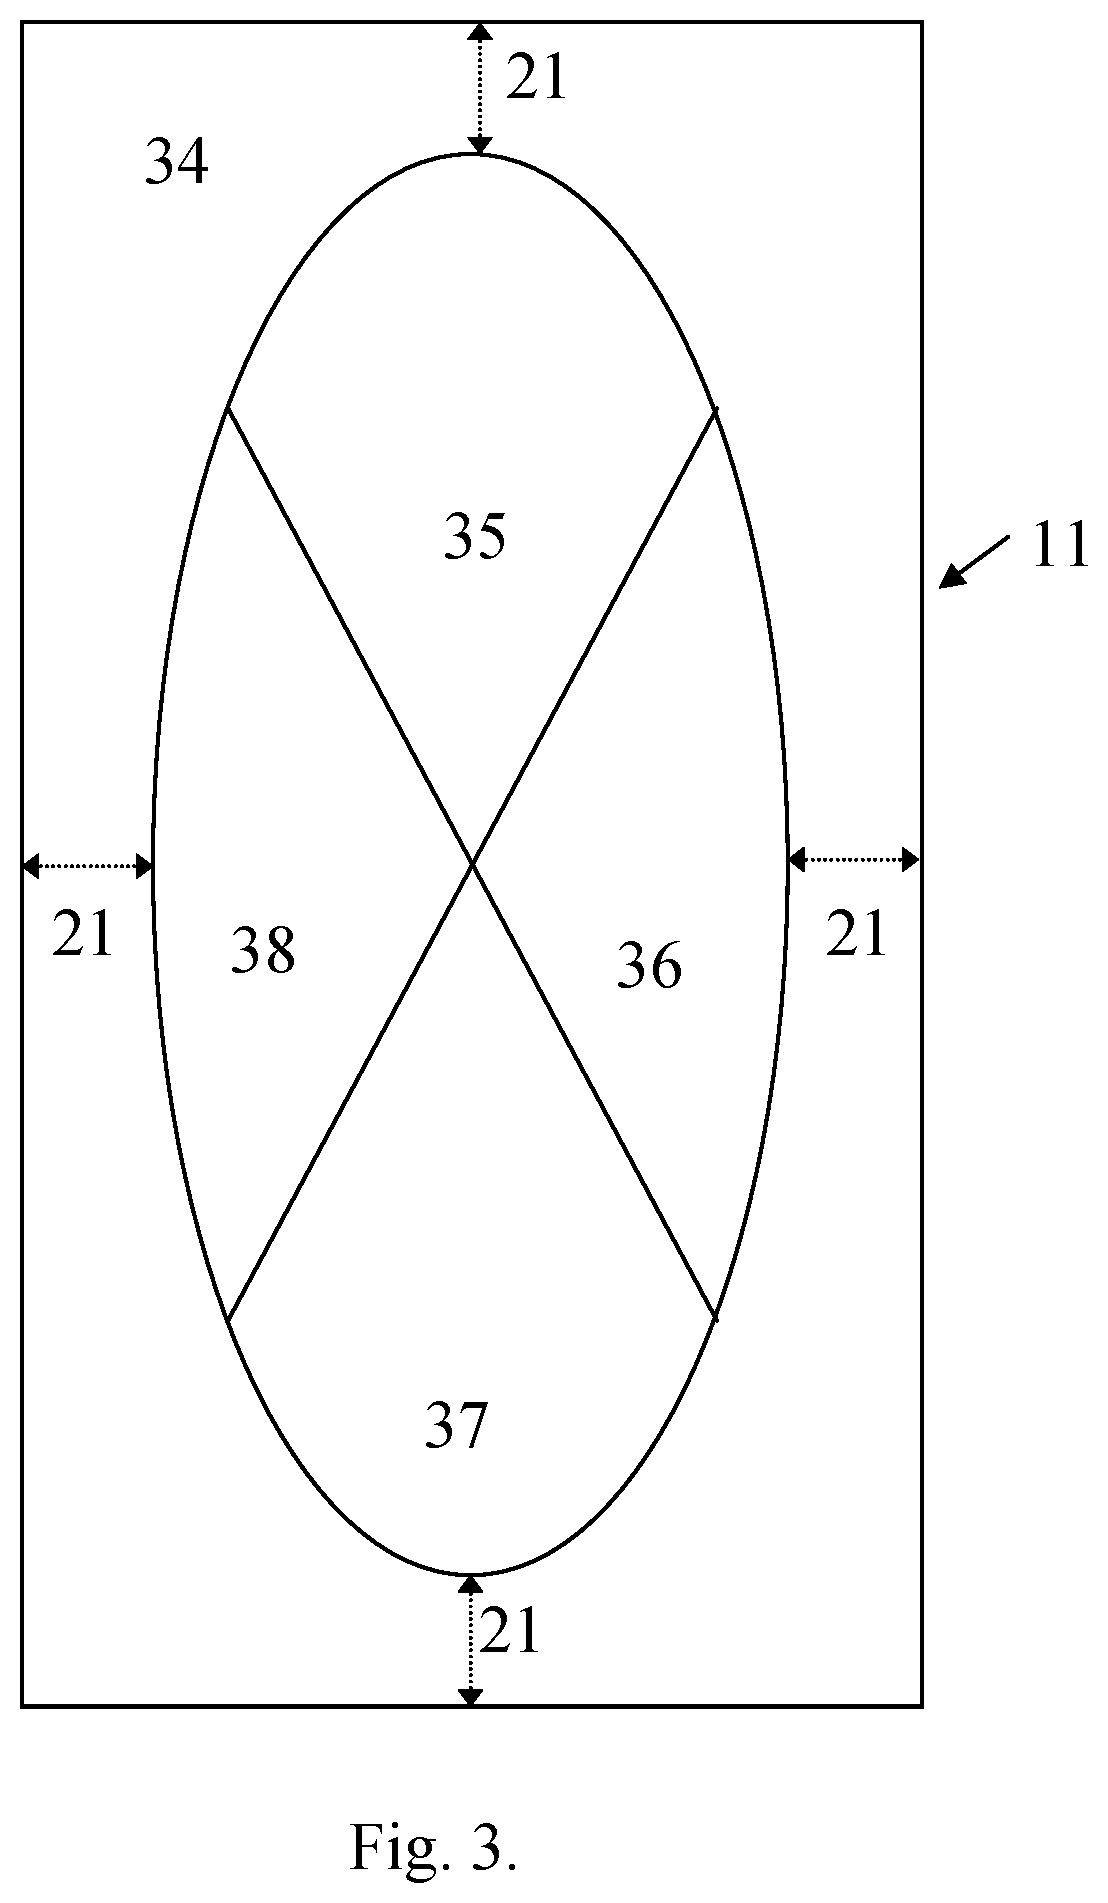
[0043]This invention describes an apparatus and methods for inspecting, analyzing, classifying, and grading the quality of transparent sheets using statistical analysis of various segmentations of a data set of photoelasticity measurements, segmentations A-H, see FIGS. 1-9. Statistics are generated for the various areas of the segmented data set of photoelasticity measurements and mathematical and logical combinations of the statistics of the segments can be directly correlated to physical and optical characteristics.

[0044]A preferred embodiment of the apparatus 10 includes: a computing system 12 capable of inputting, segmenting, and analyzing spatial maps of retardance; a thickness sensor 13 for measuring and inputting the actual thickness of the transparent sheet 11 thereby allowing residual stress to be computed from the retardance data; a display device 14 to display the results to a machine operator; and a storage device 15 and to store critical data and results from the statis...


PUM


Abstract

An apparatus and methods of inspecting, analyzing, classifying, and / or grading quality of a transparent sheet using a data set of photoelasticity measurements, thickness measurements, segmentation specifications, measurement specifications and quality control specifications of the transparent sheet. A results measurement is calculated on a computing system, quality control specifications are applied to the results measurement allowing writing to the database and creating reports, sending results to an operator interface and machine control.

Description

BENEFIT OF PRIORITY[0001]This application claims the benefit of priority of prior filed U.S. Application Ser. No. 62 / 681,692 filed Jun. 7, 2018, which is herein incorporated by reference in its entirety.BACKGROUND OF THE INVENTIONDescription of the Related Art[0002]Photoelastic experiments (also informally referred to as photoelasticity) may be used to determine stress concentration in transparent materials. The photoelastic phenomenon was first discovered by the Scottish physicist David Brewster circa 1815 and since then many apparatuses and methods have been created to take advantage of this phenomenon.[0003]Manufacturers of transparent sheet products such as glass, polycarbonate, acrylic and similar materials are concerned with optical quality and mechanical quality of these products. Fabrication processes employed to form, cut, heat-strengthen, laminate, coat, machine, and mount into frames the transparent sheet can cause stresses on the transparent sheet. Stress may be applied ...

Claims


Application Information

Patent Timeline
IPC IPC(8): G01N21/958G01N21/59G01B11/16G05B19/418
CPCG01N21/958G05B19/41875G01N2201/126G05B2219/32368G05B2219/45234G01N21/59G01B11/18G01B11/16G01L1/241G01N21/896G01N21/8901G01N2021/8848
Inventor HEGSTROM, ERICNELSON, BRYAN
Owner LITESENTRY LLC
Learn More