Method for analysing a signal and apparatus for carrying out the method

Active Publication Date: 2018-06-21
SIEMENS ENERGY GLOBAL GMBH & CO KG
View PDF3 Cites 0 Cited by
  • Summary
  • Abstract
  • Description
  • Claims
  • Application Information

AI Technical Summary

Benefits of technology

The present invention provides a method for analyzing signals more accurately with minimal computing power. The method involves using a characteristic curve to correct the frequency of one or more components in a signal. The method can be applied to pressure or vibration signals captured from condition monitoring methods for monitoring installations such as gas turbines. By improving the accuracy of signal analysis, the monitoring of installations can be improved.

Problems solved by technology

This can become problematic, however, if the signals are not captured regularly enough.
In practice, all systems are restricted with regard to the possible frequency resolution.
However, limits are imposed on the improvement, since the latter is generally associated with an increased computational complexity and / or longer measurement times.
A further problem is that, on account of the so-called leakage effect, the amplitude and / or frequency of a sinusoidal signal component contained in a signal in many cases cannot be reproduced correctly.
Peak fitting using such curves is unsatisfactory here in some instances in practice, since the optimum curve shape is dependent on the window function used for the calculation of the spectra.
Furthermore, there are a number of window functions, for example the so-called Tukey window, for which possibly no optimum curve shape can be found for fitting.
A further problem can arise as a result of noise contained in the signal or as a result of signal mixtures.

Method used


Image

  • Method for analysing a signal and apparatus for carrying out the method
  • Method for analysing a signal and apparatus for carrying out the method
  • Method for analysing a signal and apparatus for carrying out the method

Examples


Embodiment Construction

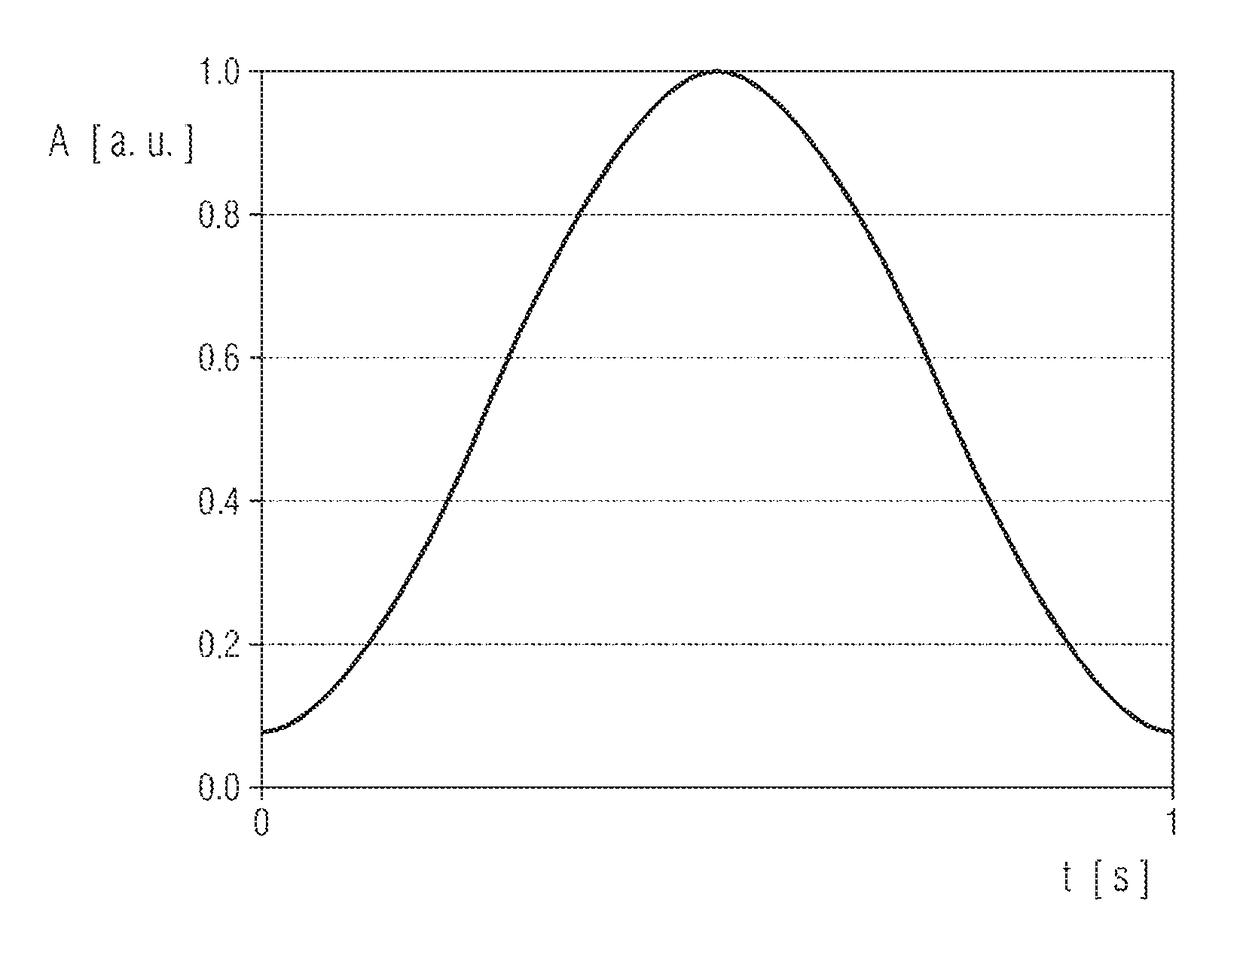
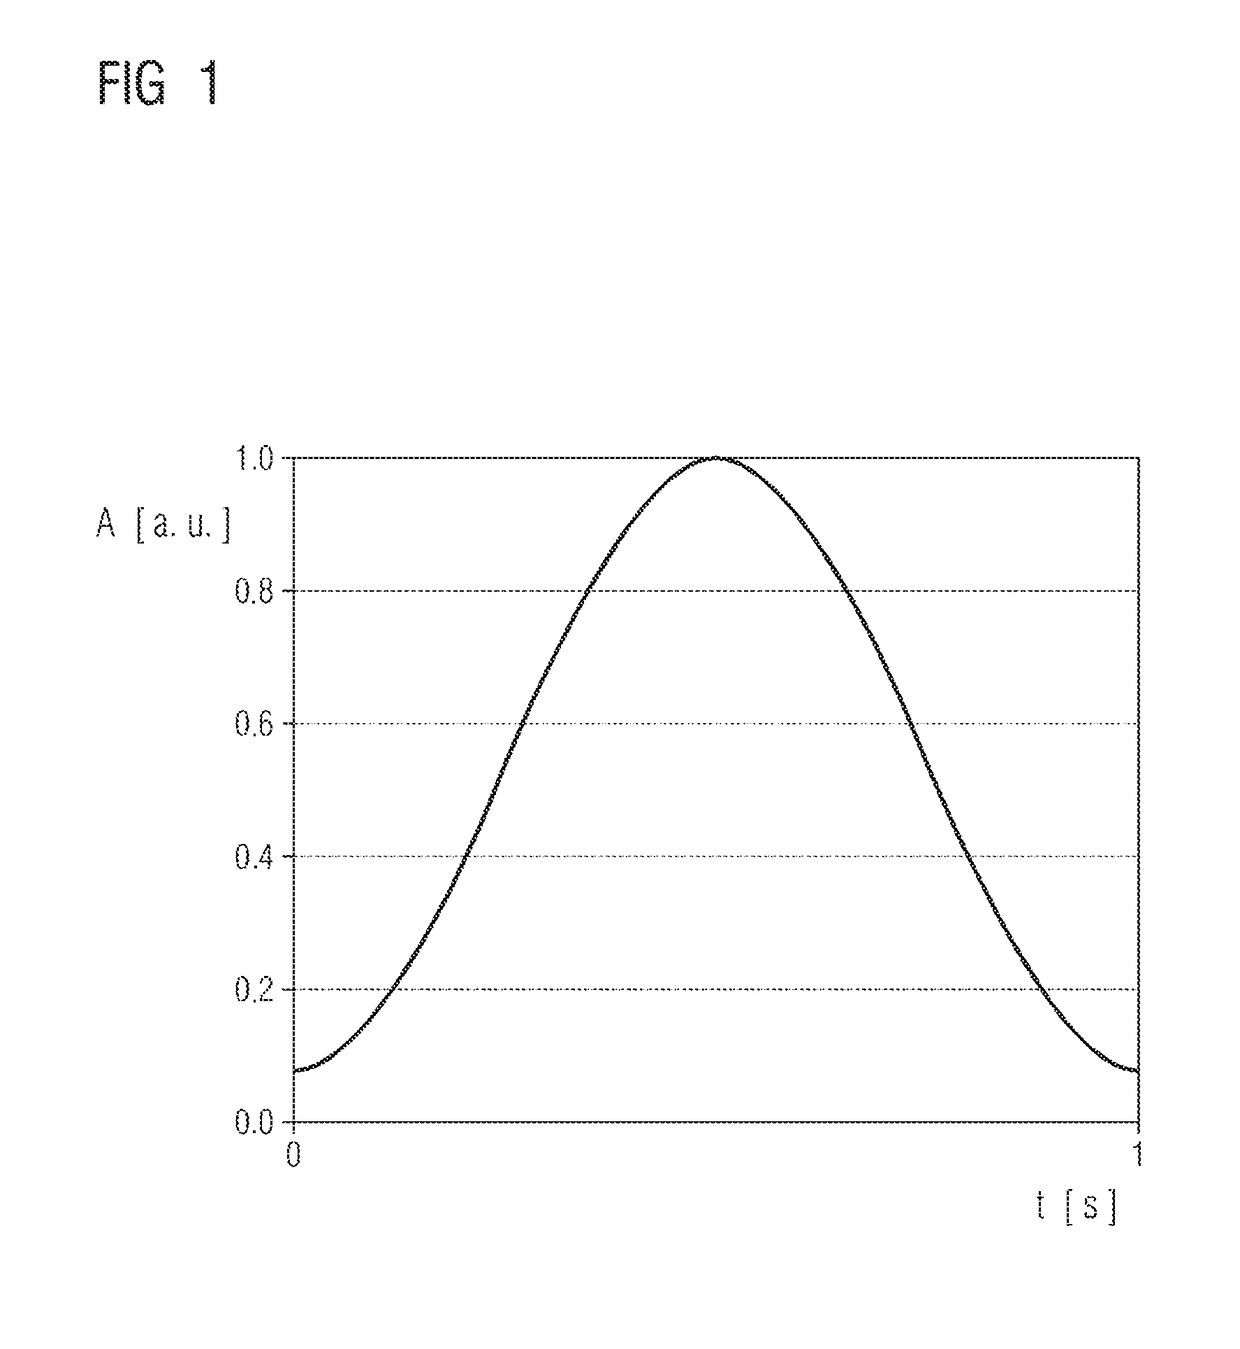
[0115]FIG. 1 shows a graph illustrating a hamming window function which is used in the present exemplary embodiment of the method according to the invention.

[0116]The window function is used in a manner known per se in the context of the Fourier analysis of signals by a procedure in which a signal to be analyzed is multiplied by the window function and a Fourier transformation of the signal multiplied by the window function is carried out afterward.

[0117]The use of the window function is associated with an undesired widening of the peaks corresponding to the signal components of the signal in the spectrum and also a reduction of the amplitude.

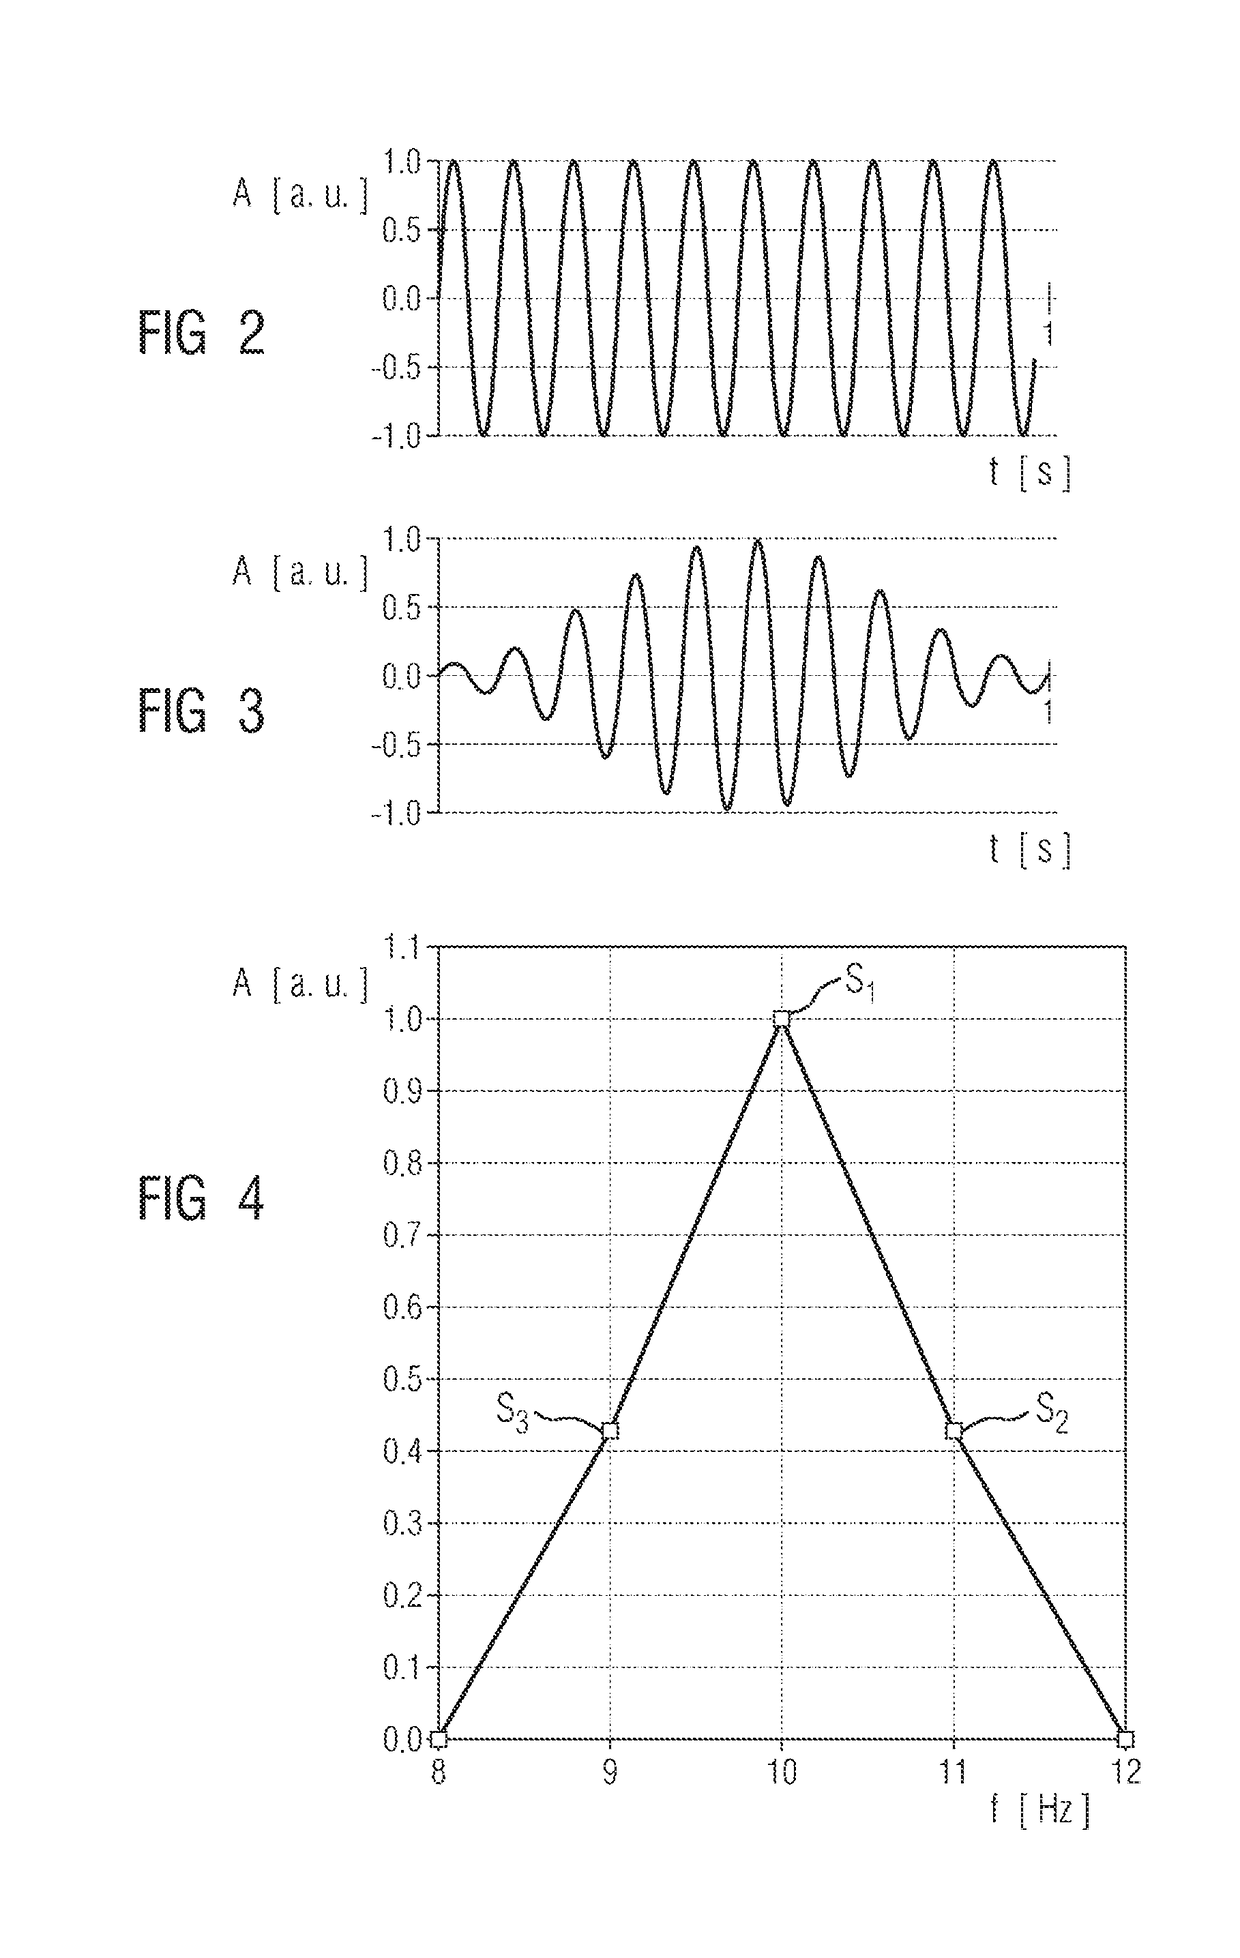
[0118]Using the method according to the invention, the frequency and the amplitude of the signal components can be determined with higher accuracy.

[0119]To that end, according to the invention, a frequency correction characteristic curve is used, which, when a predefined window function is used for the first time, firstly has to be created. The...


PUM


Abstract

A method and apparatus for analysing a signal, in which a spectrum of the signal is provided, which spectrum is the result of a multiplication of the signal by a predefined window function and a subsequent Fourier transform, the highest spectral line and the adjacent second-highest spectral line are determined in the spectrum in the region of at least one local maximum, the amplitude of the highest spectral line and of the second-highest spectral line is determined, at least one value dependent on the amplitude of the highest spectral line and on the amplitude of the second-highest spectral line is determined, a frequency correction value is determined for the frequency of the highest spectral line from the determined value using a frequency correction characteristic curve which was created for the predefined window function, and the frequency of the highest spectral line is corrected by the frequency correction value.

Description

CROSS REFERENCE TO RELATED APPLICATIONS[0001]This application is the US National Stage of International Application No. PCT / EP2016 / 061402 filed May 20, 2016, and claims the benefit thereof. The International Application claims the benefit of European Application No. EP15173342 filed Jun. 23, 2015. All of the applications are incorporated by reference herein in their entirety.FIELD OF INVENTION[0002]The invention relates to a method for analyzing a signal and an apparatus for carrying out such a method.BACKGROUND OF INVENTION[0003]Fourier transformation, in particular discrete or fast Fourier transformation, is often used for the analysis of signals with regard to their signal components. In this case, it is generally endeavored to be able to determine as accurately as possible the frequencies and amplitudes of the individual signal components of the signal to be analyzed.[0004]This can become problematic, however, if the signals are not captured regularly enough. In such cases, reco...

Claims


Application Information

Patent Timeline
IPC IPC(8): G01R23/167
CPCG01R23/167G01H1/003G01L19/00G01M15/14G06F17/142G01R23/16H03M1/12H03M1/124
Inventor HEMPL, MARTIN
Owner SIEMENS ENERGY GLOBAL GMBH & CO KG
Why Eureka
Try Eureka